BELMANIP_00181


Location

lon / lat [deg]: 13.113 / 14.6893

Source network: BELMANIP


Geostationary surface albedo (GSA) data


“+000”


“+057/+063”


Landcover information (based on ESA CCI landcover data)


Landcover fractions @ 2km distance


Landcover fractions @ 20 km distance


Legend


Distance to open water bodies [km]:

59.25

Distance to urban areas [km]:

48.83


Radius: 1 km

Number of landcover classes:

2

Dominant landcover type:

150: Sparse vegetation (tree, shrub, herbaceous cover) (<15%)

Fraction of dominant landcover type [%]:

54.0


Radius: 2 km

Number of landcover classes:

2

Dominant landcover type:

200: bare areas

Fraction of dominant landcover type [%]:

66.0


Radius: 5 km

Number of landcover classes:

2

Dominant landcover type:

200: bare areas

Fraction of dominant landcover type [%]:

73.0


Radius: 10 km

Number of landcover classes:

2

Dominant landcover type:

200: bare areas

Fraction of dominant landcover type [%]:

77.0


Radius: 20 km

Number of landcover classes:

2

Dominant landcover type:

200: bare areas

Fraction of dominant landcover type [%]:

65.0


Disturbances


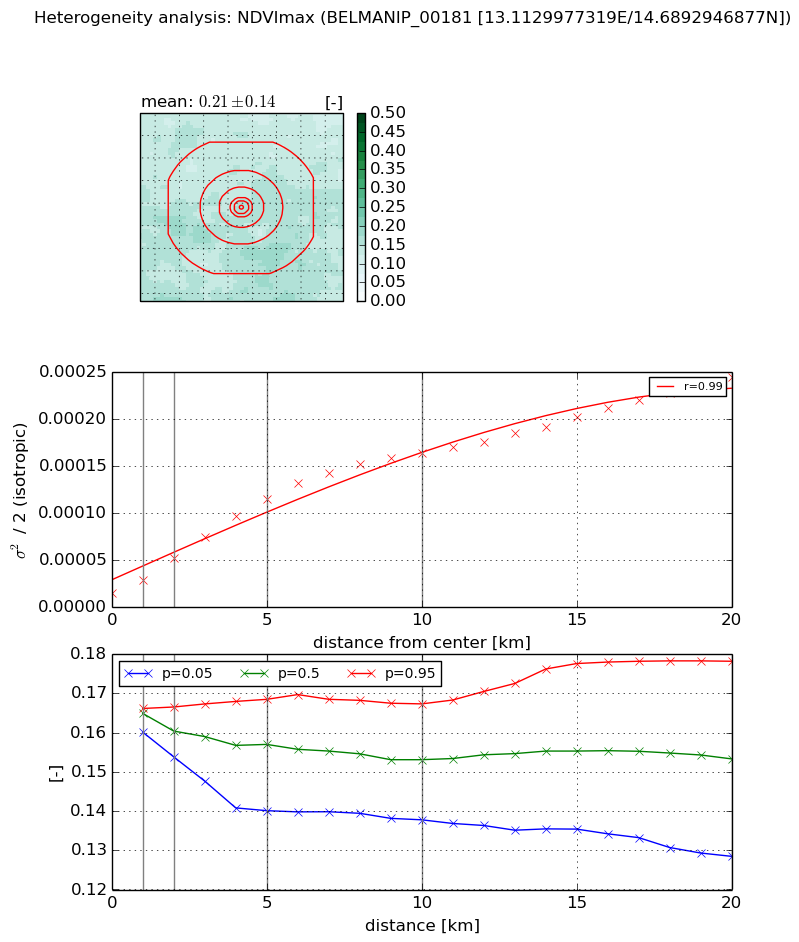
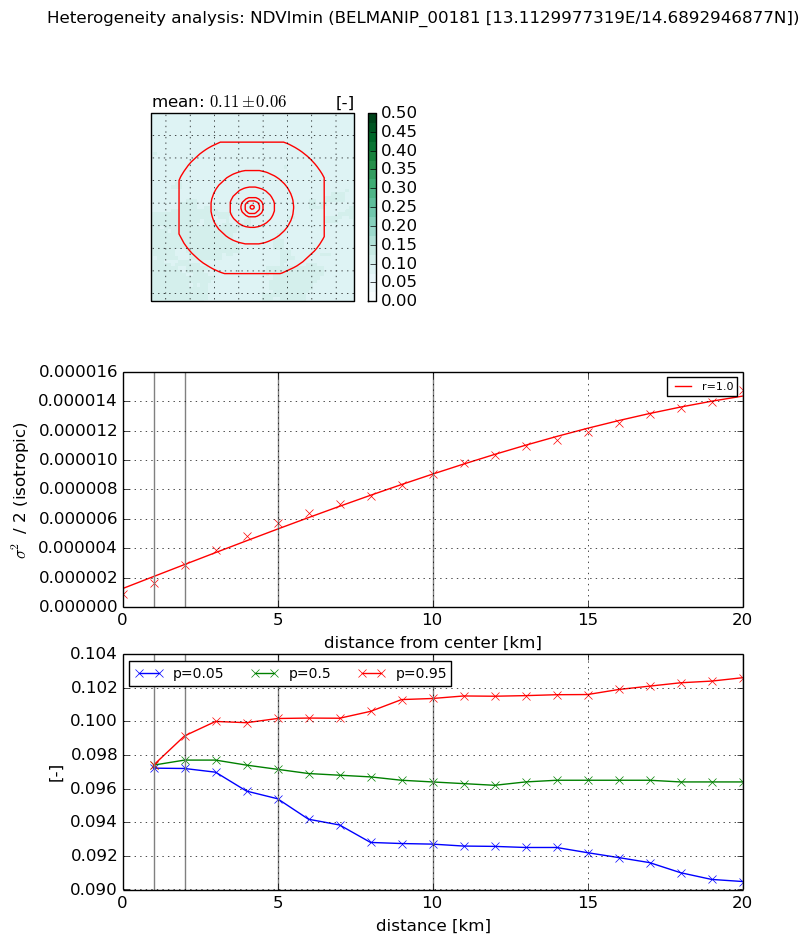
Heterogeneity analysis

The heterogeneity analysis provides information about the spatial and temporal heterogeneity of the site.

Topography


Roman et al. (2009) index


St

2.29539320479

Rcv

0.128603763047

Rse

0.0

Rst

0.178378036918

Rsv

-0.999983818708


Height range @ 1km [m]

8

Height range @ 2km [m]

7

Height range @ 5km [m]

8

Height range @ 10km [m]

-999

Height range @ 20km [m]

-999


Variance slope @ 1 km

2

Variance slope @ 2 km

1

Variance slope @ 5 km

0

Variance slope @ 10 km

-999

Variance slope @ 20 km

-999


NDVI (max. NDVI composite)


Roman et al. (2009) index


St

0.803345573926

Rcv

0.514614251053

Rse

0.0

Rst

-0.41155467151

Rsv

2.80821400973


NDVI range @ 1km [-]

0.01

NDVI range @ 2km [-]

0.01

NDVI range @ 5km [-]

0.03

NDVI range @ 10km [-]

0.03

NDVI range @ 20km [-]

0.05


Variance slope @ 1 km

1.38315328349e-05

Variance slope @ 2 km

1.87499647986e-05

Variance slope @ 5 km

2.07821122743e-05

Variance slope @ 10 km

1.57412642111e-05

Variance slope @ 20 km

1.05585301292e-05


NDVI (min. NDVI composite)I


Roman et al. (2009) index


St

nan

Rcv

nan

Rse

nan

Rst

nan

Rsv

nan


NDVI range @ 1km [-]

0.0

NDVI range @ 2km [-]

0.0

NDVI range @ 5km [-]

0.0

NDVI range @ 10km [-]

0.01

NDVI range @ 20km [-]

0.01


NDVI slope @ 1 km

7.51975081816e-07

NDVI slope @ 2 km

9.57706382588e-07

NDVI slope @ 5 km

9.89804102089e-07

NDVI slope @ 10 km

8.08784445401e-07

NDVI slope @ 20 km

6.6855443142e-07


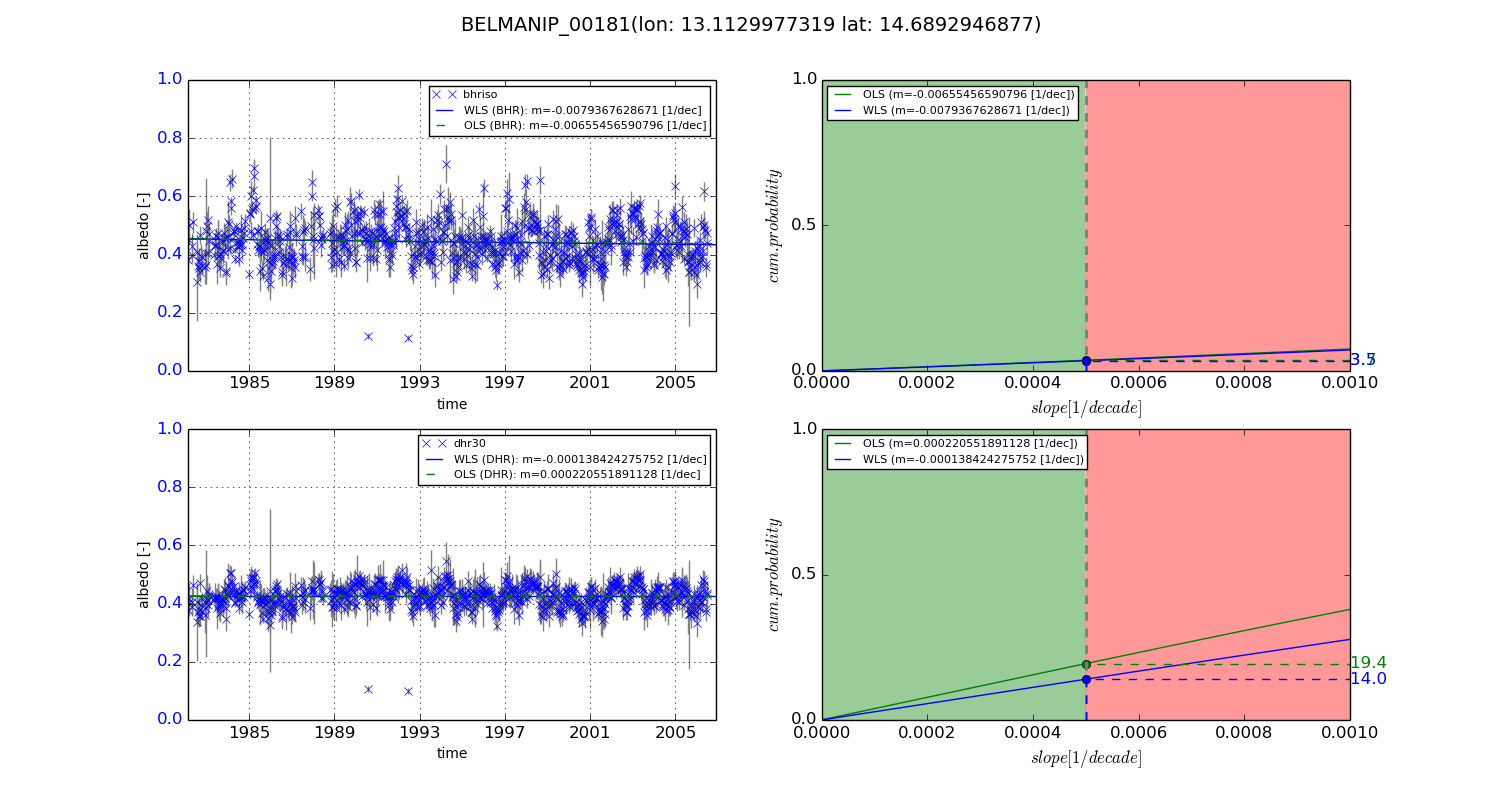
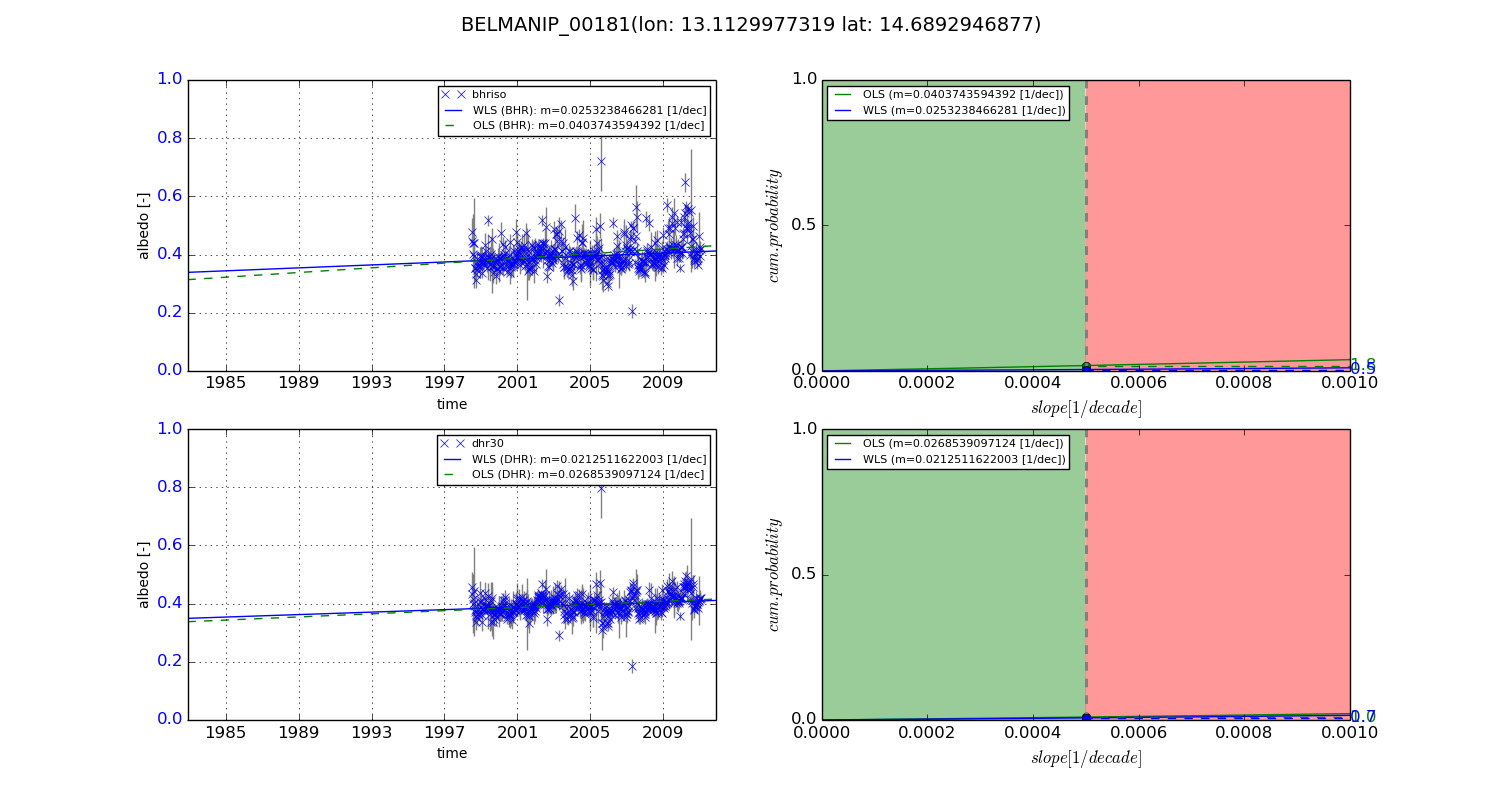
Temporal stability analysis

+000 deg (BHR)


BHR statistics

Temporal stability [1/decade]:


abs

rel


Weighted least square:

-0.0079367628671


Ordinary least square:

-0.00655456590796


Probabilities that GCOS criteria is met:

Weighted least square:

3.5 %

Ordinary least square:

3.7 %


DHR statistics

Temporal stability [1/decade]:


abs

rel


Weighted least square:

-0.000138424275752


Ordinary least square:

0.000220551891128


Probabilities that GCOS criteria is met:

Weighted least square:

14.0 %

Ordinary least square:

19.4 %


+057/+063 deg (BHR)


BHR statistics

Temporal stability [1/decade]:


abs

rel


Weighted least square:

0.0253238466281


Ordinary least square:

0.0403743594392


Probabilities that GCOS criteria is met:

Weighted least square:

0.5 %

Ordinary least square:

1.8 %


DHR statistics

Temporal stability [1/decade]:


abs

rel


Weighted least square:

0.0212511622003


Ordinary least square:

0.0268539097124


Probabilities that GCOS criteria is met:

Weighted least square:

0.7 %

Ordinary least square:

1.0 %


Temporal anomaly analyis

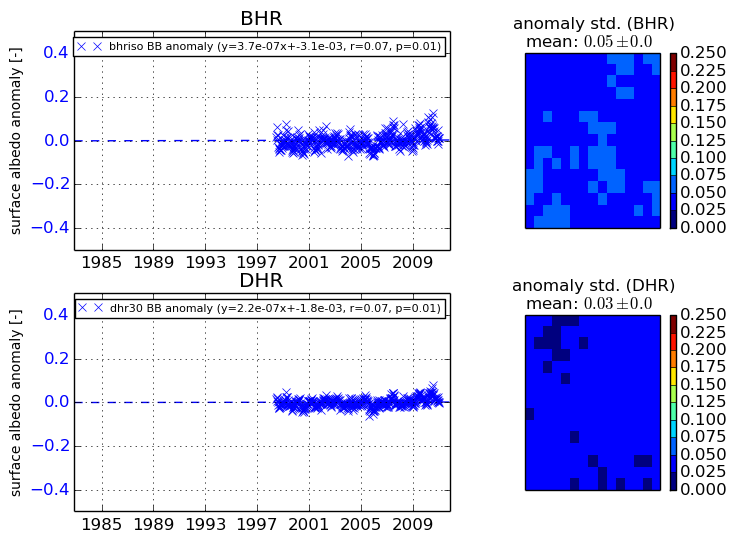
The variance of the temporal anomalies provides an additional measure about the stability of the signal AFTER removal of the mean seasonal cylce.
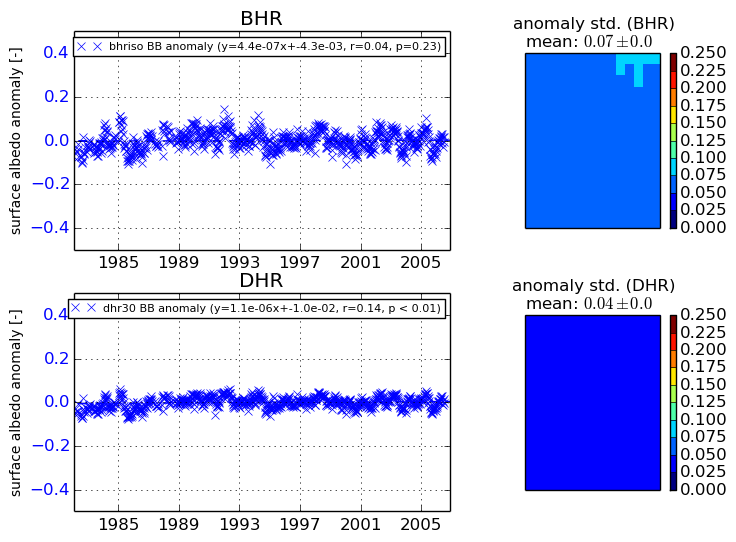
+000 deg


+057/+063 deg