BELMANIP_00183


Location

lon / lat [deg]: -15.4035 / 14.7727

Source network: BELMANIP


Geostationary surface albedo (GSA) data


“+000”


“+057/+063”


Landcover information (based on ESA CCI landcover data)


Landcover fractions @ 2km distance


Landcover fractions @ 20 km distance


Legend


Distance to open water bodies [km]:

none in region

Distance to urban areas [km]:

15.32


Radius: 1 km

Number of landcover classes:

2

Dominant landcover type:

10: cropland, rainfed

Fraction of dominant landcover type [%]:

74.0


Radius: 2 km

Number of landcover classes:

2

Dominant landcover type:

10: cropland, rainfed

Fraction of dominant landcover type [%]:

56.0


Radius: 5 km

Number of landcover classes:

2

Dominant landcover type:

10: cropland, rainfed

Fraction of dominant landcover type [%]:

55.0


Radius: 10 km

Number of landcover classes:

2

Dominant landcover type:

10: cropland, rainfed

Fraction of dominant landcover type [%]:

58.0


Radius: 20 km

Number of landcover classes:

2

Dominant landcover type:

10: cropland, rainfed

Fraction of dominant landcover type [%]:

66.0


Disturbances


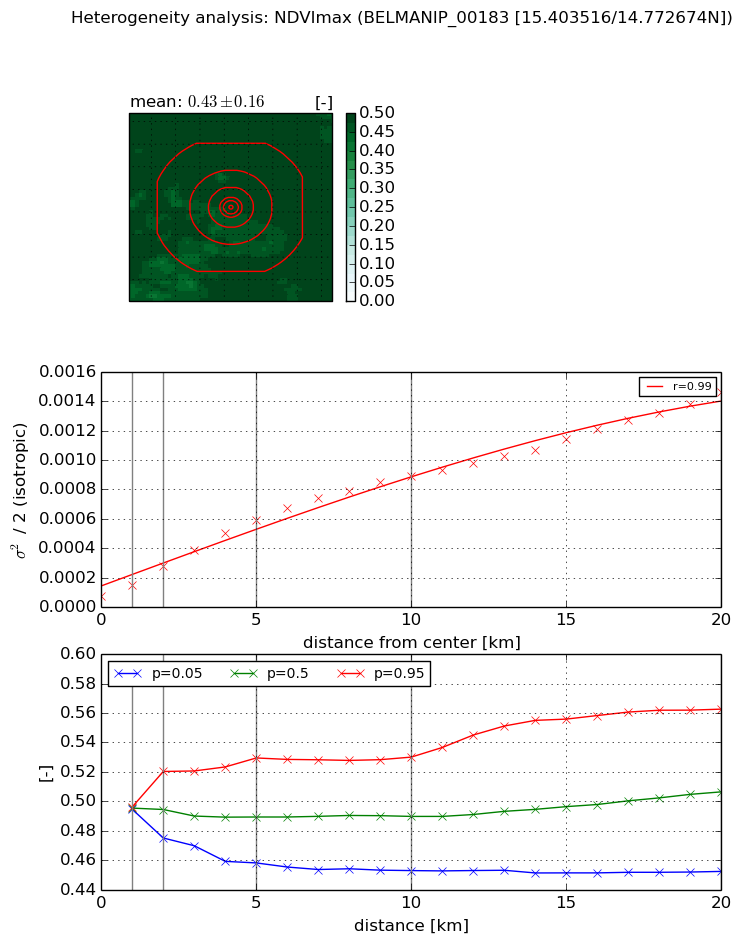
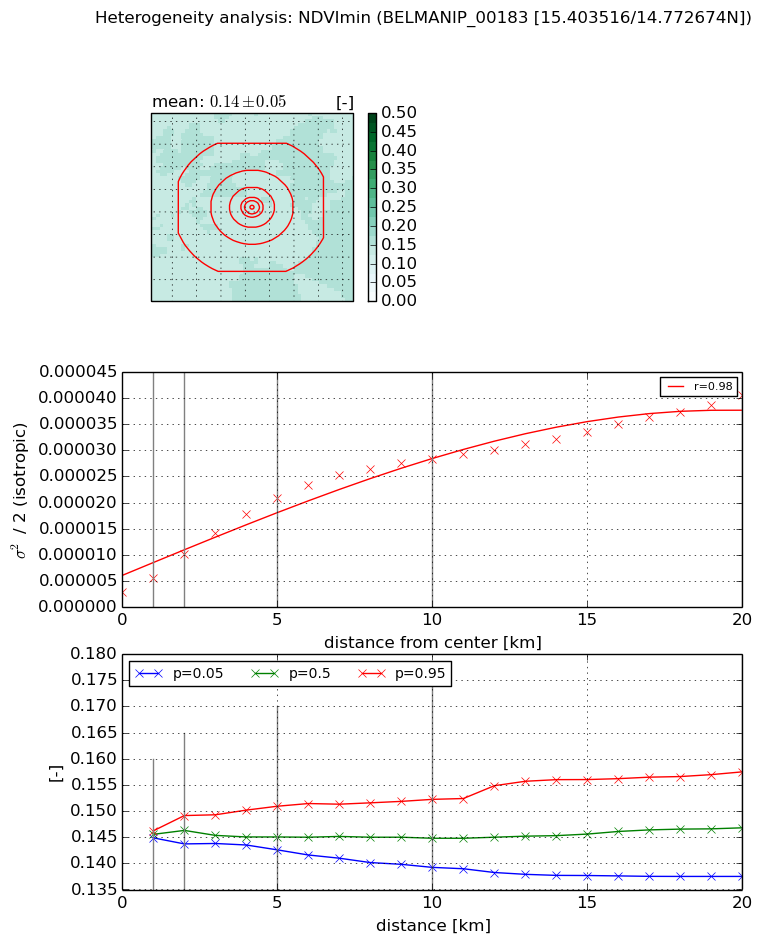
Heterogeneity analysis

The heterogeneity analysis provides information about the spatial and temporal heterogeneity of the site.

Topography


Roman et al. (2009) index


St

5.72738827855e-08

Rcv

0.53350942925

Rse

0.0

Rst

8.90751983285e-09

Rsv

52379895.0506


Height range @ 1km [m]

8

Height range @ 2km [m]

11

Height range @ 5km [m]

20

Height range @ 10km [m]

-999

Height range @ 20km [m]

-999


Variance slope @ 1 km

4

Variance slope @ 2 km

5

Variance slope @ 5 km

8

Variance slope @ 10 km

-999

Variance slope @ 20 km

-999


NDVI (max. NDVI composite)


Roman et al. (2009) index


St

1.67736753668

Rcv

0.357568656921

Rse

0.0

Rst

-0.430948933473

Rsv

-0.999999198203


NDVI range @ 1km [-]

0.0

NDVI range @ 2km [-]

0.05

NDVI range @ 5km [-]

0.07

NDVI range @ 10km [-]

0.08

NDVI range @ 20km [-]

0.11


Variance slope @ 1 km

7.21255153843e-05

Variance slope @ 2 km

9.91312912441e-05

Variance slope @ 5 km

0.000106333303821

Variance slope @ 10 km

8.43511942151e-05

Variance slope @ 20 km

6.41518209814e-05


NDVI (min. NDVI composite)I


Roman et al. (2009) index


St

1.82550661322

Rcv

0.364514823975

Rse

0.0

Rst

-0.387463715466

Rsv

0.891400880974


NDVI range @ 1km [-]

0.0

NDVI range @ 2km [-]

0.01

NDVI range @ 5km [-]

0.01

NDVI range @ 10km [-]

0.01

NDVI range @ 20km [-]

0.02


NDVI slope @ 1 km

2.66716604825e-06

NDVI slope @ 2 km

3.57505323183e-06

NDVI slope @ 5 km

3.70249218359e-06

NDVI slope @ 10 km

2.64994133438e-06

NDVI slope @ 20 km

1.65446210397e-06


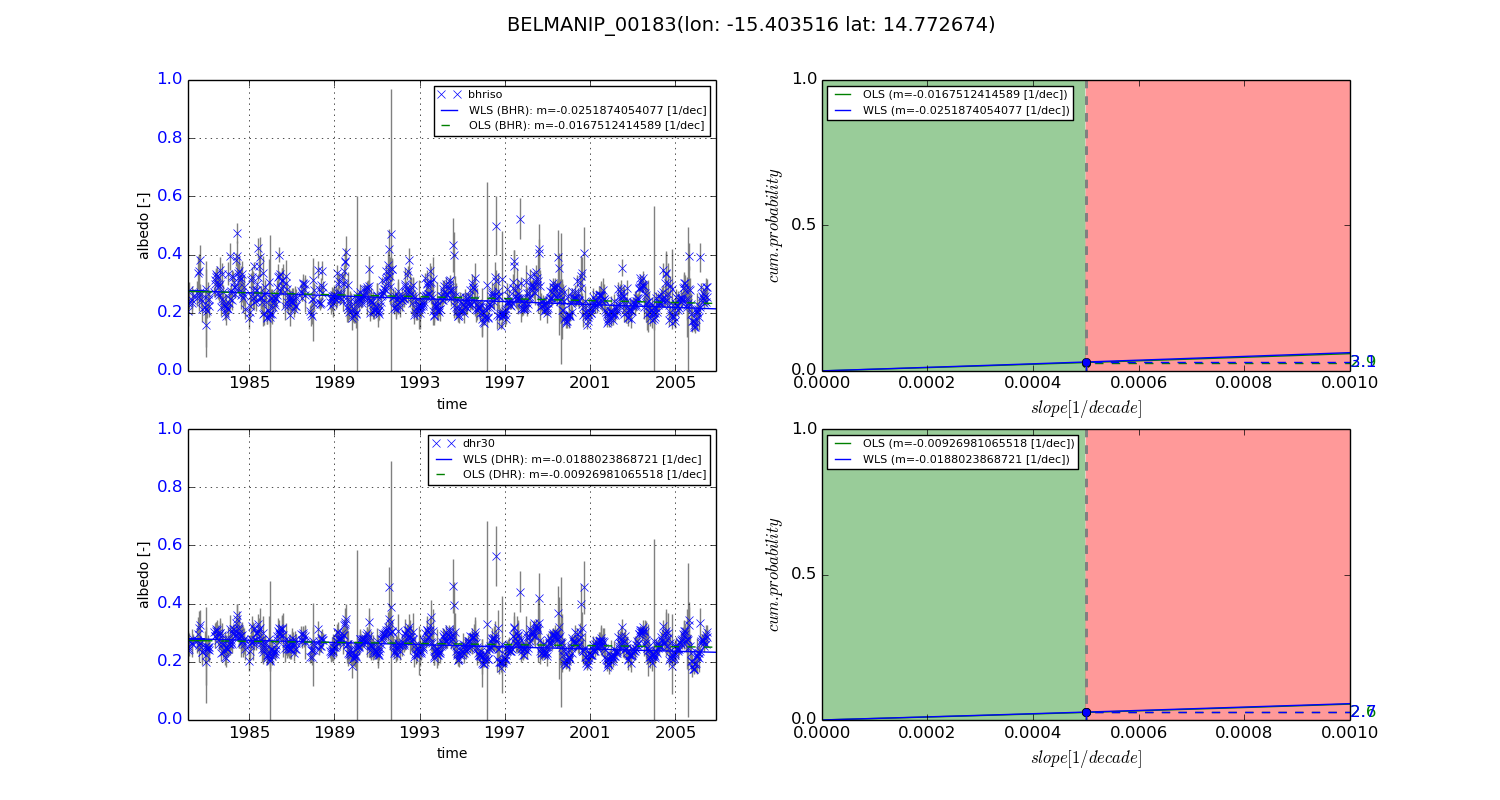
Temporal stability analysis

+000 deg (BHR)


BHR statistics

Temporal stability [1/decade]:


abs

rel


Weighted least square:

-0.0251874054077


Ordinary least square:

-0.0167512414589


Probabilities that GCOS criteria is met:

Weighted least square:

3.1 %

Ordinary least square:

2.9 %


DHR statistics

Temporal stability [1/decade]:


abs

rel


Weighted least square:

-0.0188023868721


Ordinary least square:

-0.00926981065518


Probabilities that GCOS criteria is met:

Weighted least square:

2.7 %

Ordinary least square:

2.6 %


+057/+063 deg (BHR)


BHR statistics

Temporal stability [1/decade]:


abs

rel


Weighted least square:

-99999.0


Ordinary least square:

-99999.0


Probabilities that GCOS criteria is met:

Weighted least square:

-99999.0 %

Ordinary least square:

-99999.0 %


DHR statistics

Temporal stability [1/decade]:


abs

rel


Weighted least square:

-99999.0


Ordinary least square:

-99999.0


Probabilities that GCOS criteria is met:

Weighted least square:

-99999.0 %

Ordinary least square:

-99999.0 %


Temporal anomaly analyis

The variance of the temporal anomalies provides an additional measure about the stability of the signal AFTER removal of the mean seasonal cylce.
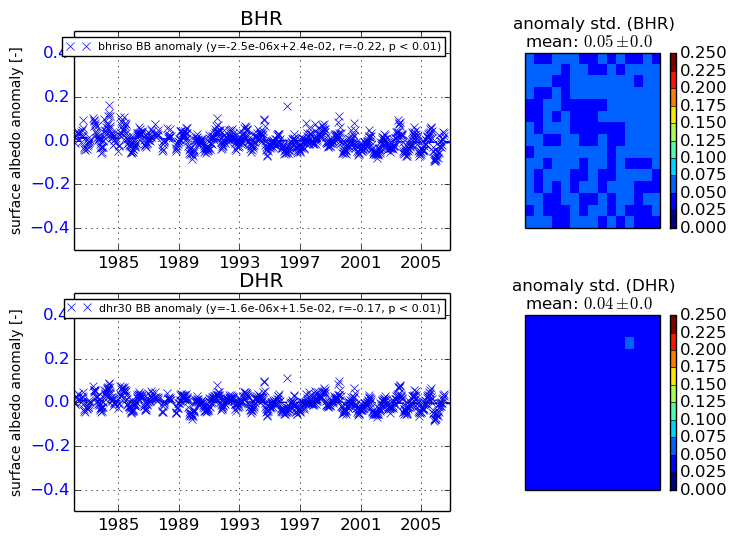
+000 deg


+057/+063 deg