BELMANIP_00184


Location

lon / lat [deg]: -1.4854 / 12.6942

Source network: BELMANIP


Geostationary surface albedo (GSA) data


“+000”


“+057/+063”


Landcover information (based on ESA CCI landcover data)


Landcover fractions @ 2km distance


Landcover fractions @ 20 km distance


Legend


Distance to open water bodies [km]:

2.39

Distance to urban areas [km]:

20.63


Radius: 1 km

Number of landcover classes:

1

Dominant landcover type:

10: cropland, rainfed

Fraction of dominant landcover type [%]:

100.0


Radius: 2 km

Number of landcover classes:

1

Dominant landcover type:

10: cropland, rainfed

Fraction of dominant landcover type [%]:

100.0


Radius: 5 km

Number of landcover classes:

1

Dominant landcover type:

10: cropland, rainfed

Fraction of dominant landcover type [%]:

99.0


Radius: 10 km

Number of landcover classes:

1

Dominant landcover type:

10: cropland, rainfed

Fraction of dominant landcover type [%]:

99.0


Radius: 20 km

Number of landcover classes:

2

Dominant landcover type:

10: cropland, rainfed

Fraction of dominant landcover type [%]:

98.0


Disturbances


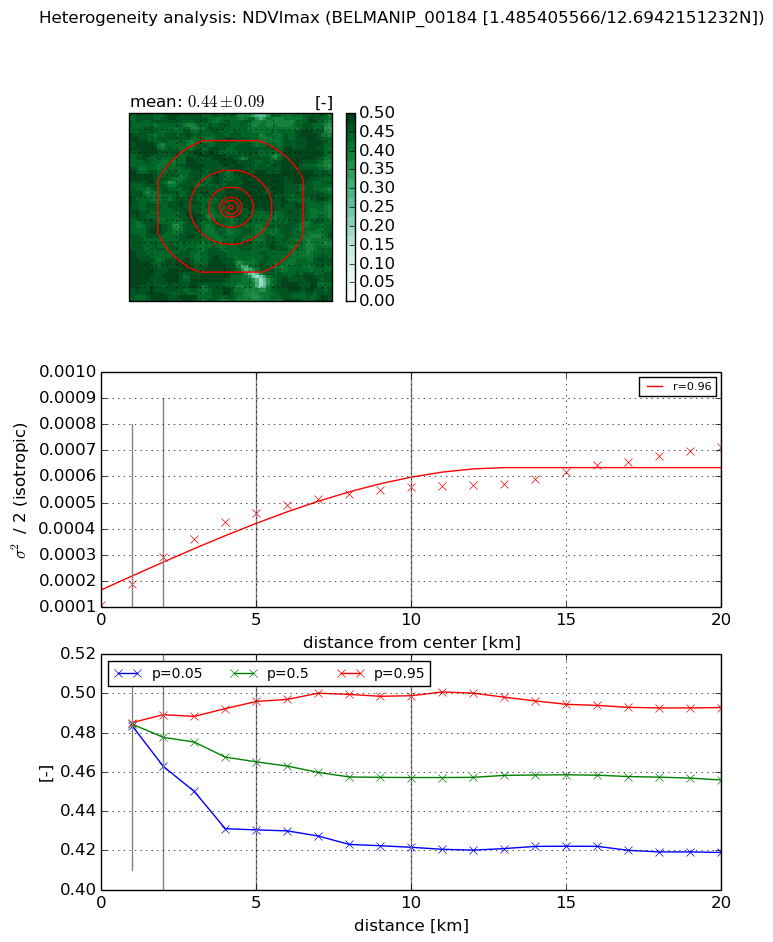
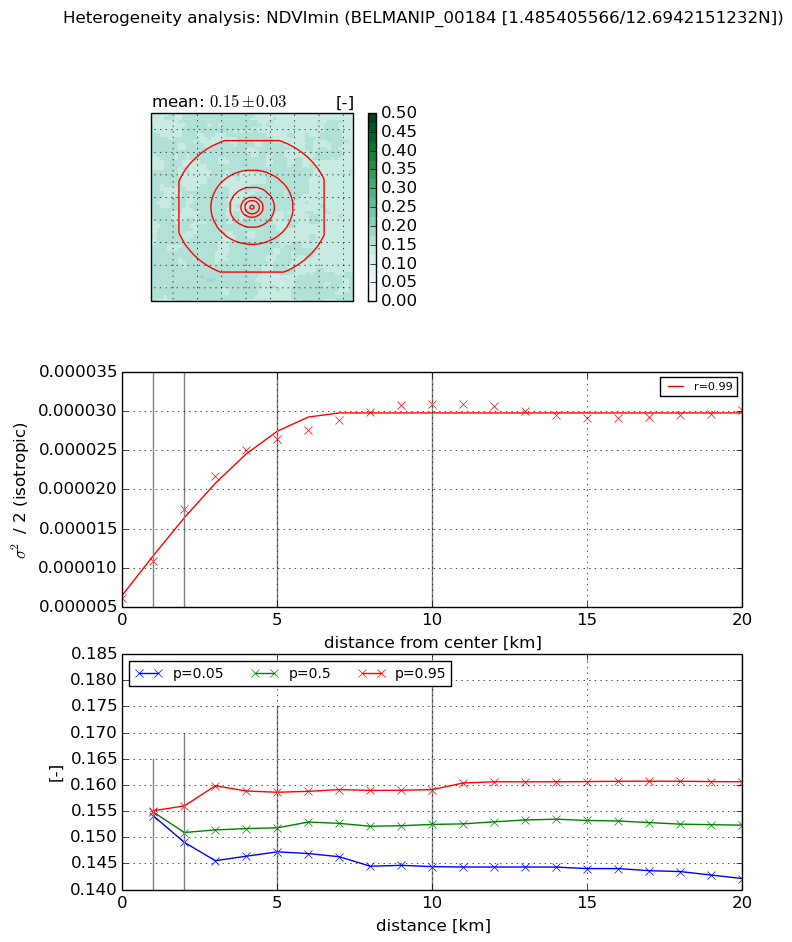
Heterogeneity analysis

The heterogeneity analysis provides information about the spatial and temporal heterogeneity of the site.

Topography


Roman et al. (2009) index


St

3.20447469313

Rcv

0.485634001741

Rse

0.0

Rst

-2.99291566364e-09

Rsv

-0.450556880604


Height range @ 1km [m]

8

Height range @ 2km [m]

14

Height range @ 5km [m]

30

Height range @ 10km [m]

-999

Height range @ 20km [m]

-999


Variance slope @ 1 km

15

Variance slope @ 2 km

18

Variance slope @ 5 km

19

Variance slope @ 10 km

-999

Variance slope @ 20 km

-999


NDVI (max. NDVI composite)


Roman et al. (2009) index


St

2.51982453508

Rcv

0.481271434129

Rse

0.0

Rst

-0.127632075866

Rsv

0.581655577843


NDVI range @ 1km [-]

0.0

NDVI range @ 2km [-]

0.03

NDVI range @ 5km [-]

0.07

NDVI range @ 10km [-]

0.08

NDVI range @ 20km [-]

0.07


Variance slope @ 1 km

7.75077842625e-05

Variance slope @ 2 km

9.07776467085e-05

Variance slope @ 5 km

7.24097618435e-05

Variance slope @ 10 km

4.35636638109e-05

Variance slope @ 20 km

2.41160230847e-05


NDVI (min. NDVI composite)I


Roman et al. (2009) index


St

nan

Rcv

nan

Rse

nan

Rst

nan

Rsv

nan


NDVI range @ 1km [-]

0.0

NDVI range @ 2km [-]

0.01

NDVI range @ 5km [-]

0.01

NDVI range @ 10km [-]

0.01

NDVI range @ 20km [-]

0.02


NDVI slope @ 1 km

4.65946835674e-06

NDVI slope @ 2 km

5.65215837547e-06

NDVI slope @ 5 km

4.22786328122e-06

NDVI slope @ 10 km

2.3395160624e-06

NDVI slope @ 20 km

7.89231037296e-07


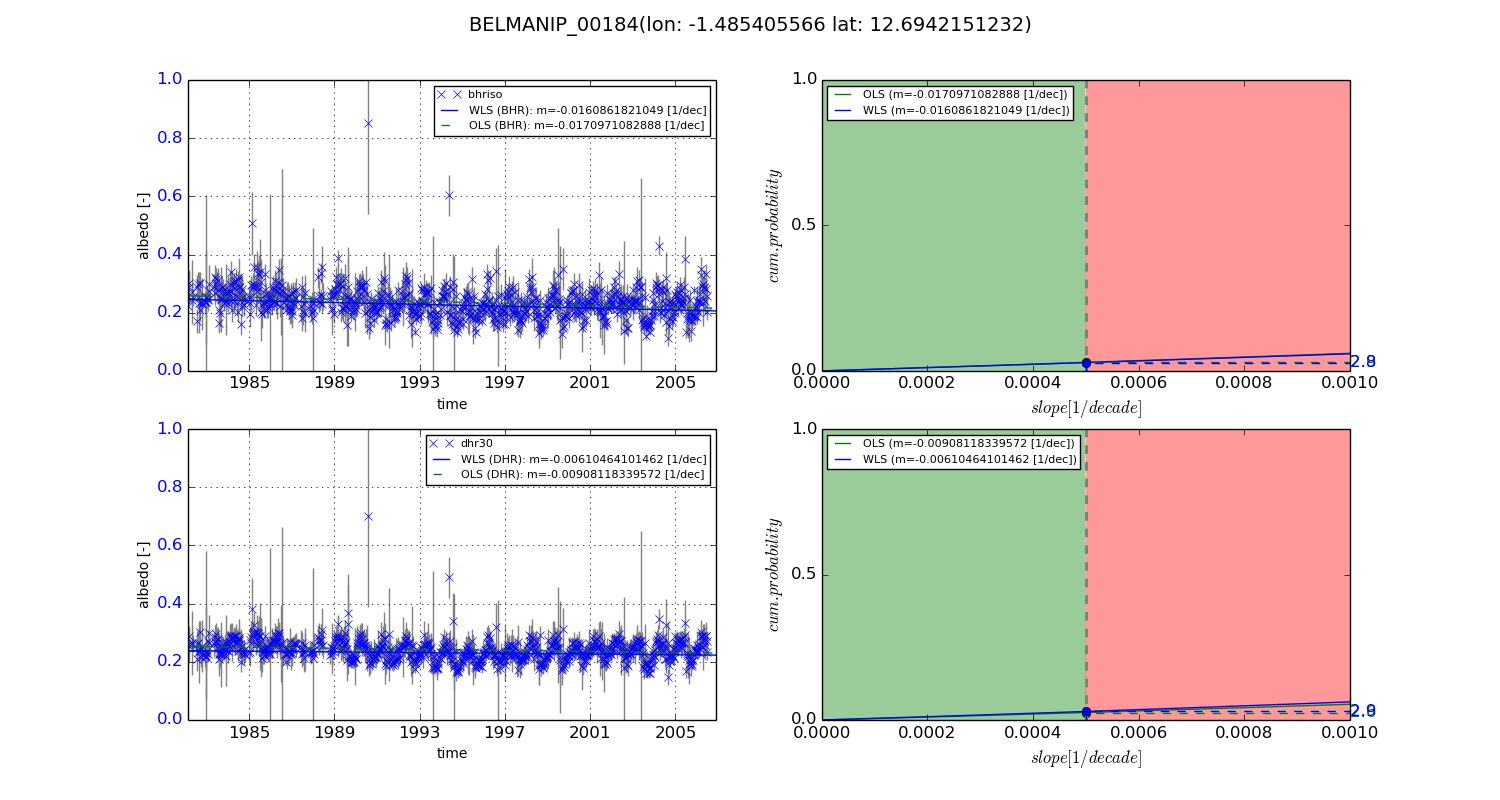
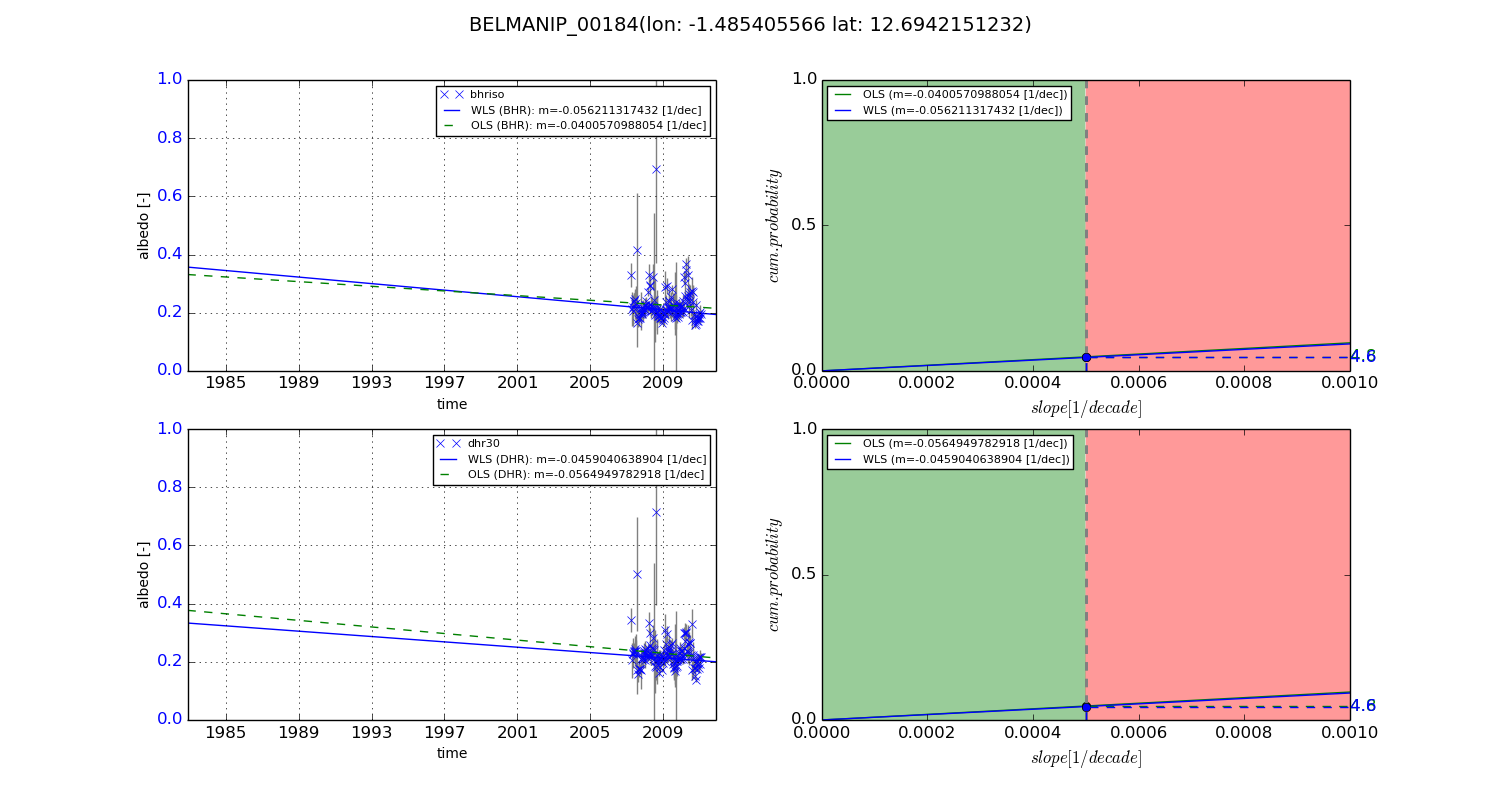
Temporal stability analysis

+000 deg (BHR)


BHR statistics

Temporal stability [1/decade]:


abs

rel


Weighted least square:

-0.0160861821049


Ordinary least square:

-0.0170971082888


Probabilities that GCOS criteria is met:

Weighted least square:

2.8 %

Ordinary least square:

2.9 %


DHR statistics

Temporal stability [1/decade]:


abs

rel


Weighted least square:

-0.00610464101462


Ordinary least square:

-0.00908118339572


Probabilities that GCOS criteria is met:

Weighted least square:

2.9 %

Ordinary least square:

2.6 %


+057/+063 deg (BHR)


BHR statistics

Temporal stability [1/decade]:


abs

rel


Weighted least square:

-0.056211317432


Ordinary least square:

-0.0400570988054


Probabilities that GCOS criteria is met:

Weighted least square:

4.6 %

Ordinary least square:

4.8 %


DHR statistics

Temporal stability [1/decade]:


abs

rel


Weighted least square:

-0.0459040638904


Ordinary least square:

-0.0564949782918


Probabilities that GCOS criteria is met:

Weighted least square:

4.6 %

Ordinary least square:

4.8 %


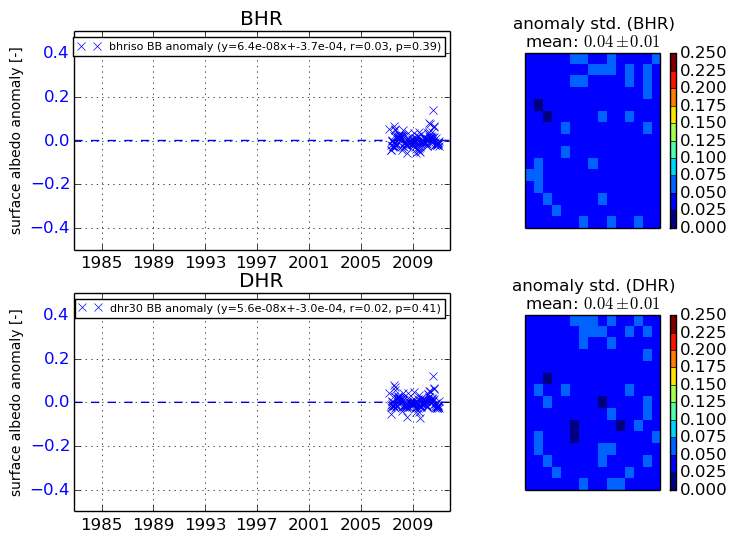
Temporal anomaly analyis

The variance of the temporal anomalies provides an additional measure about the stability of the signal AFTER removal of the mean seasonal cylce.
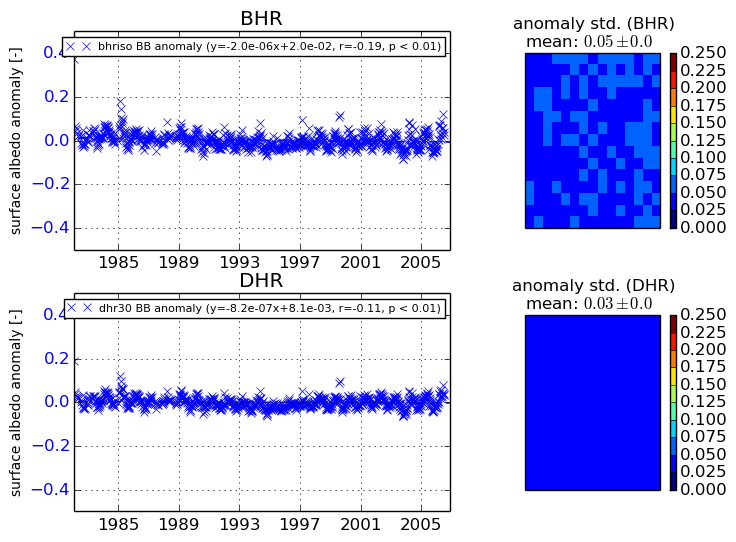
+000 deg


+057/+063 deg