BELMANIP_00185


Location

lon / lat [deg]: 16.9037 / 12.0068

Source network: BELMANIP


Geostationary surface albedo (GSA) data


“+000”


“+057/+063”


Landcover information (based on ESA CCI landcover data)


Landcover fractions @ 2km distance


Landcover fractions @ 20 km distance


Legend


Distance to open water bodies [km]:

none in region

Distance to urban areas [km]:

44.41


Radius: 1 km

Number of landcover classes:

1

Dominant landcover type:

10: cropland, rainfed

Fraction of dominant landcover type [%]:

100.0


Radius: 2 km

Number of landcover classes:

1

Dominant landcover type:

10: cropland, rainfed

Fraction of dominant landcover type [%]:

100.0


Radius: 5 km

Number of landcover classes:

1

Dominant landcover type:

10: cropland, rainfed

Fraction of dominant landcover type [%]:

100.0


Radius: 10 km

Number of landcover classes:

2

Dominant landcover type:

10: cropland, rainfed

Fraction of dominant landcover type [%]:

96.0


Radius: 20 km

Number of landcover classes:

2

Dominant landcover type:

10: cropland, rainfed

Fraction of dominant landcover type [%]:

94.0


Disturbances


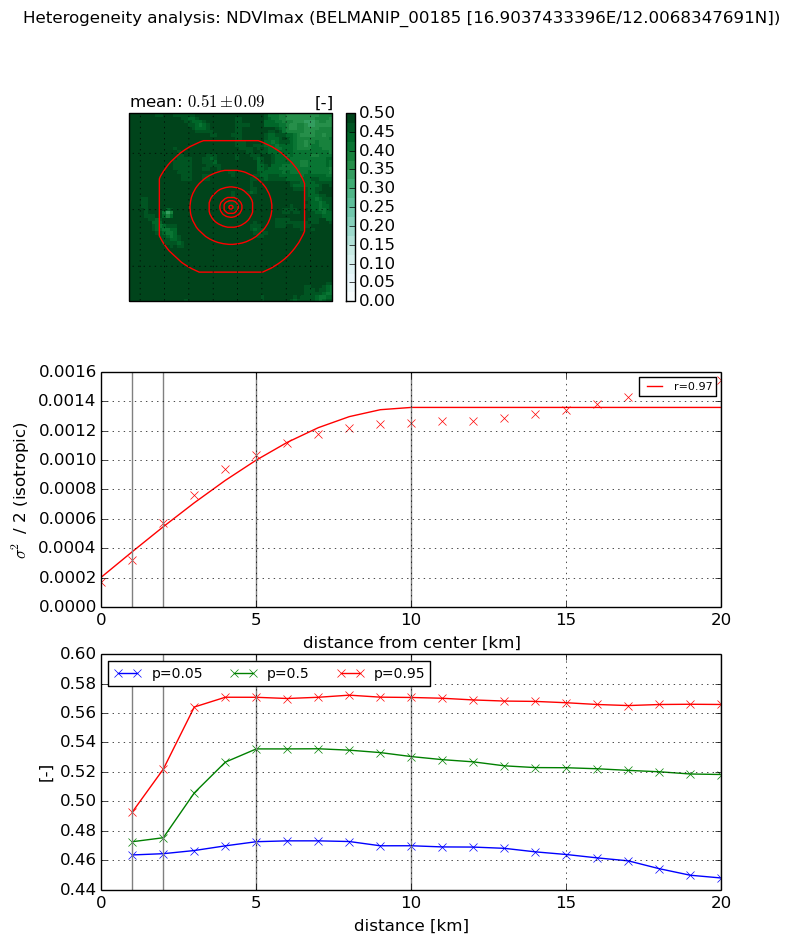
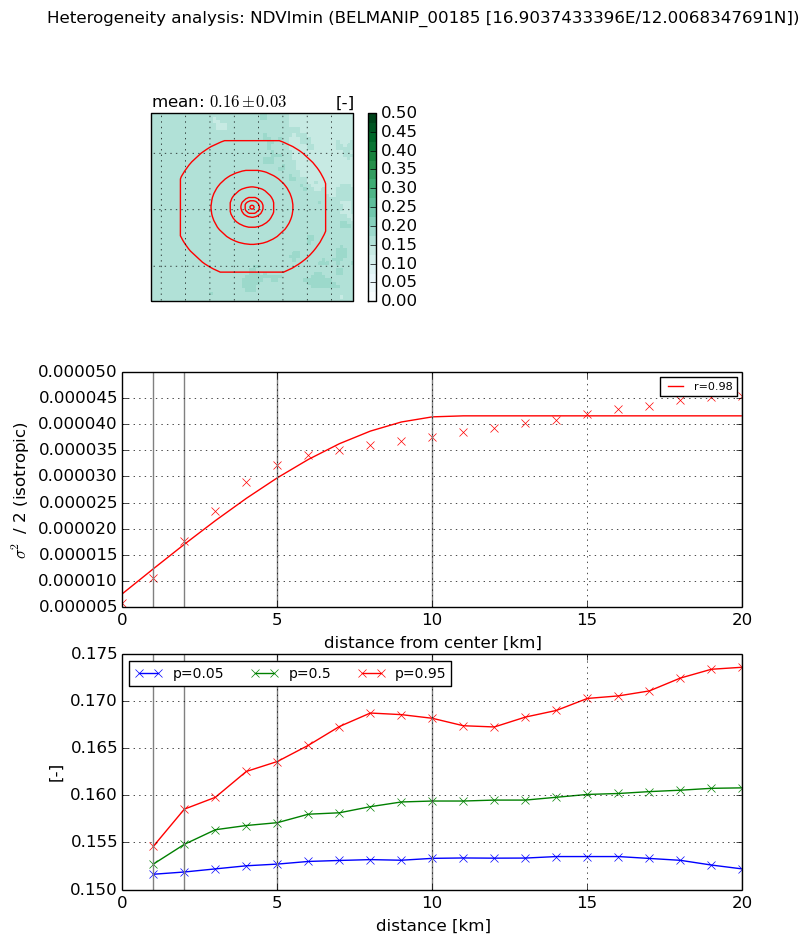
Heterogeneity analysis

The heterogeneity analysis provides information about the spatial and temporal heterogeneity of the site.

Topography


Roman et al. (2009) index


St

2.01224153898

Rcv

0.186069417373

Rse

0.0

Rst

1.28082696634e-08

Rsv

1.30480526944


Height range @ 1km [m]

4

Height range @ 2km [m]

4

Height range @ 5km [m]

5

Height range @ 10km [m]

-999

Height range @ 20km [m]

-999


Variance slope @ 1 km

0

Variance slope @ 2 km

0

Variance slope @ 5 km

0

Variance slope @ 10 km

-999

Variance slope @ 20 km

-999


NDVI (max. NDVI composite)


Roman et al. (2009) index


St

9.09934762311

Rcv

-0.020324139245

Rse

0.0

Rst

0.12644036898

Rsv

-0.182929457129


NDVI range @ 1km [-]

0.03

NDVI range @ 2km [-]

0.06

NDVI range @ 5km [-]

0.1

NDVI range @ 10km [-]

0.1

NDVI range @ 20km [-]

0.12


Variance slope @ 1 km

0.000151688395406

Variance slope @ 2 km

0.000199482618817

Variance slope @ 5 km

0.000182212570481

Variance slope @ 10 km

0.000109665931639

Variance slope @ 20 km

5.41126964235e-05


NDVI (min. NDVI composite)I


Roman et al. (2009) index


St

3.91721491691

Rcv

0.374419863812

Rse

0.0

Rst

-0.119131418722

Rsv

0.272298961488


NDVI range @ 1km [-]

0.0

NDVI range @ 2km [-]

0.01

NDVI range @ 5km [-]

0.01

NDVI range @ 10km [-]

0.01

NDVI range @ 20km [-]

0.02


NDVI slope @ 1 km

4.7584357502e-06

NDVI slope @ 2 km

5.93879330932e-06

NDVI slope @ 5 km

5.52122168976e-06

NDVI slope @ 10 km

3.16373869236e-06

NDVI slope @ 20 km

1.62061139992e-06


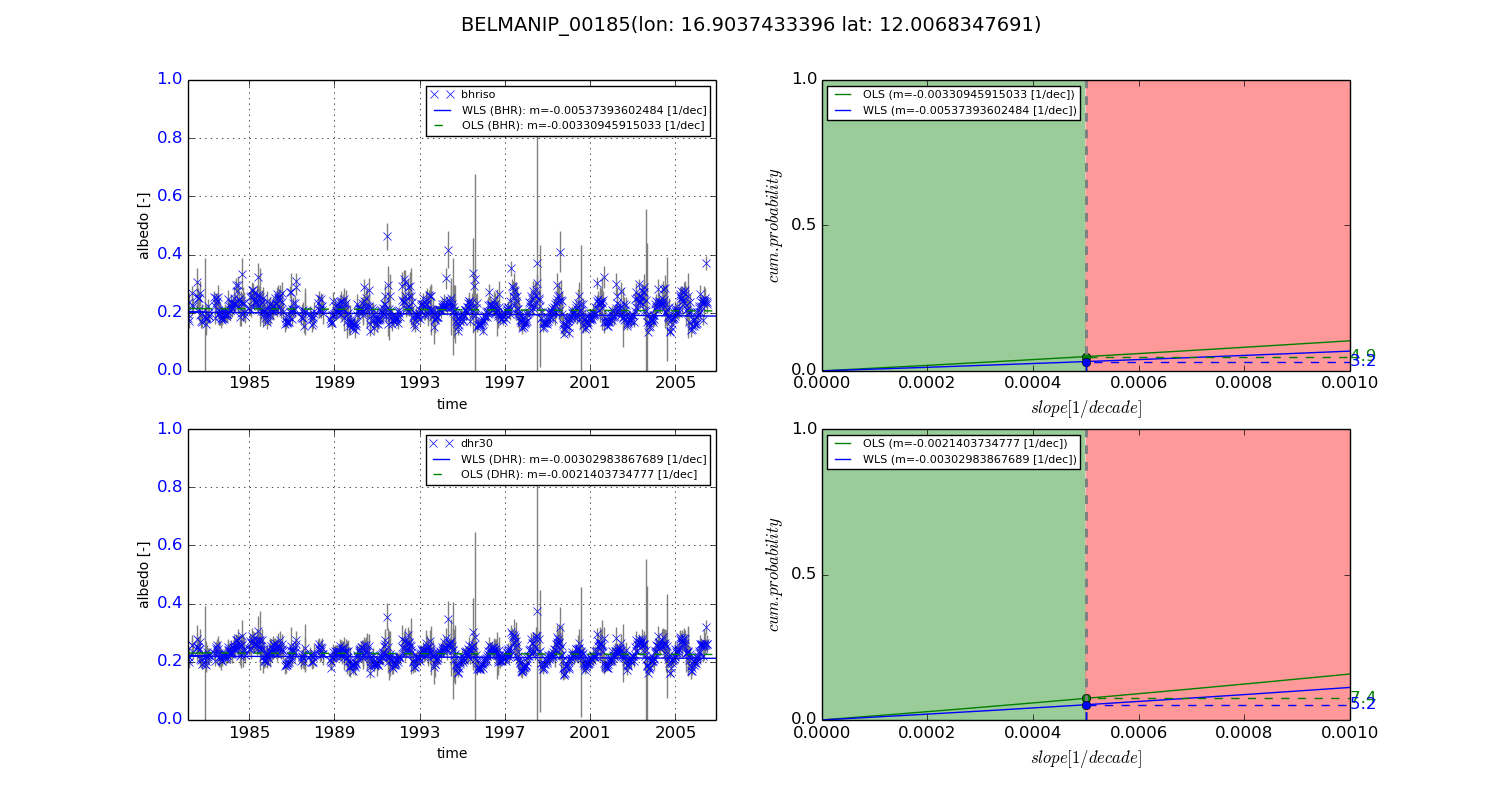
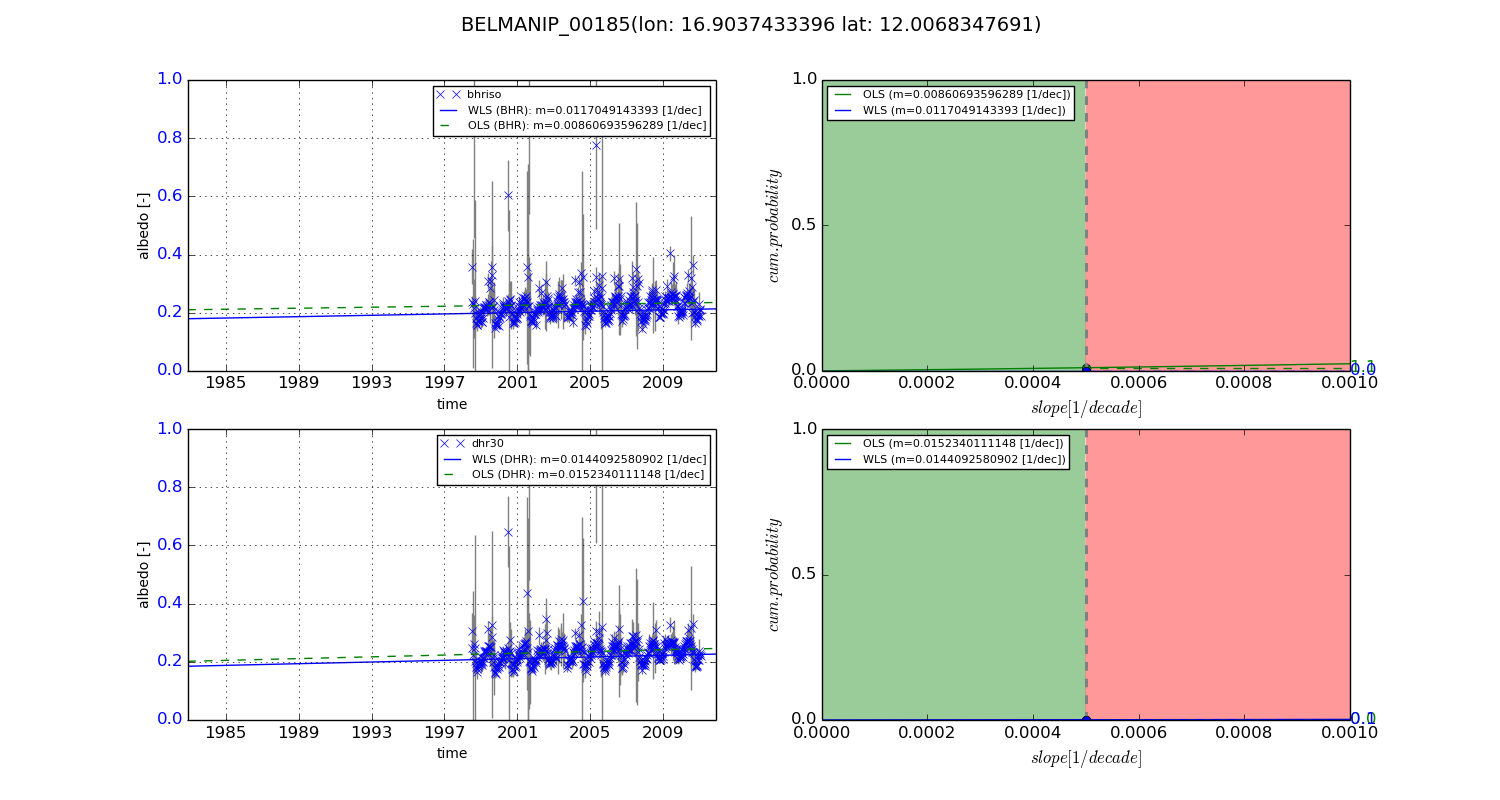
Temporal stability analysis

+000 deg (BHR)


BHR statistics

Temporal stability [1/decade]:


abs

rel


Weighted least square:

-0.00537393602484


Ordinary least square:

-0.00330945915033


Probabilities that GCOS criteria is met:

Weighted least square:

3.2 %

Ordinary least square:

4.9 %


DHR statistics

Temporal stability [1/decade]:


abs

rel


Weighted least square:

-0.00302983867689


Ordinary least square:

-0.0021403734777


Probabilities that GCOS criteria is met:

Weighted least square:

5.2 %

Ordinary least square:

7.4 %


+057/+063 deg (BHR)


BHR statistics

Temporal stability [1/decade]:


abs

rel


Weighted least square:

0.0117049143393


Ordinary least square:

0.00860693596289


Probabilities that GCOS criteria is met:

Weighted least square:

0.0 %

Ordinary least square:

1.1 %


DHR statistics

Temporal stability [1/decade]:


abs

rel


Weighted least square:

0.0144092580902


Ordinary least square:

0.0152340111148


Probabilities that GCOS criteria is met:

Weighted least square:

0.1 %

Ordinary least square:

0.0 %


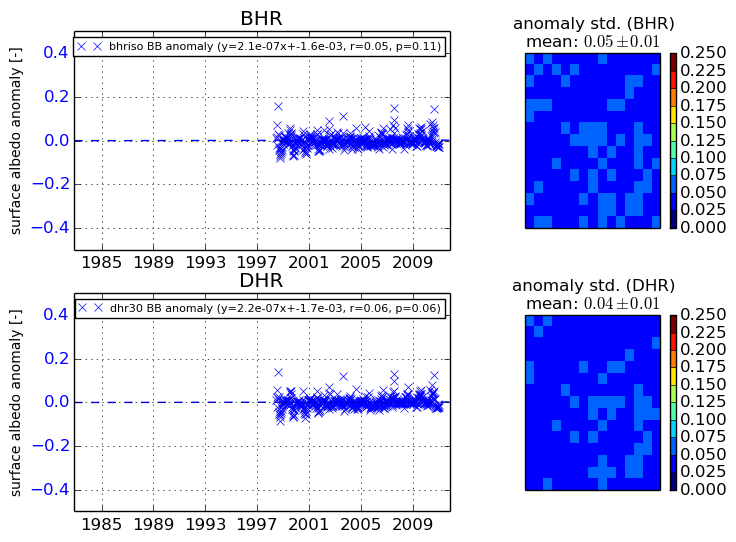
Temporal anomaly analyis

The variance of the temporal anomalies provides an additional measure about the stability of the signal AFTER removal of the mean seasonal cylce.
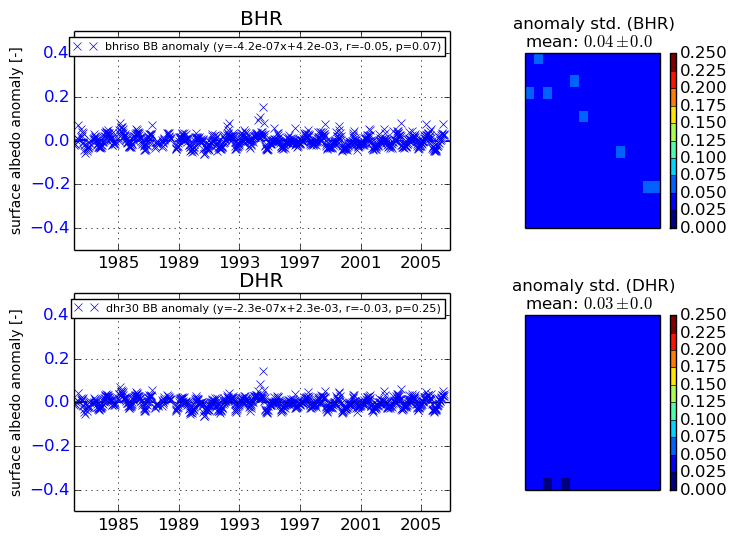
+000 deg


+057/+063 deg