BELMANIP_00192


Location

lon / lat [deg]: -0.6789 / 18.2436

Source network: BELMANIP


Geostationary surface albedo (GSA) data


“+000”


“+057/+063”


Landcover information (based on ESA CCI landcover data)


Landcover fractions @ 2km distance


Landcover fractions @ 20 km distance


Legend


Distance to open water bodies [km]:

none in region

Distance to urban areas [km]:

none in region


Radius: 1 km

Number of landcover classes:

1

Dominant landcover type:

200: bare areas

Fraction of dominant landcover type [%]:

100.0


Radius: 2 km

Number of landcover classes:

1

Dominant landcover type:

200: bare areas

Fraction of dominant landcover type [%]:

100.0


Radius: 5 km

Number of landcover classes:

1

Dominant landcover type:

200: bare areas

Fraction of dominant landcover type [%]:

100.0


Radius: 10 km

Number of landcover classes:

1

Dominant landcover type:

200: bare areas

Fraction of dominant landcover type [%]:

100.0


Radius: 20 km

Number of landcover classes:

1

Dominant landcover type:

200: bare areas

Fraction of dominant landcover type [%]:

100.0


Disturbances


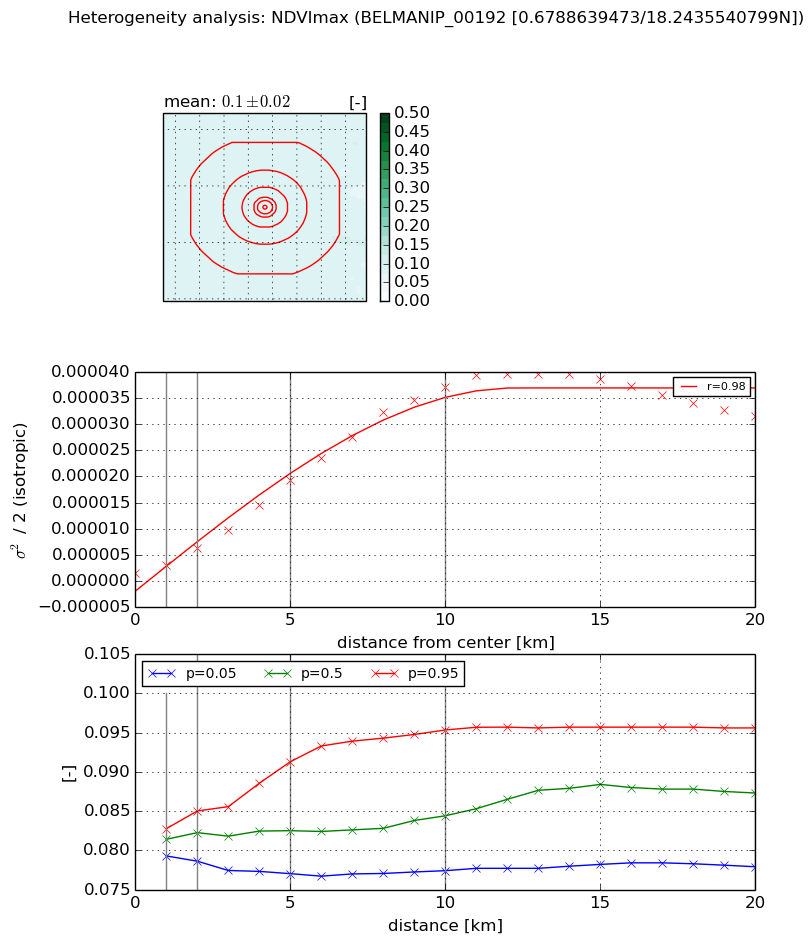
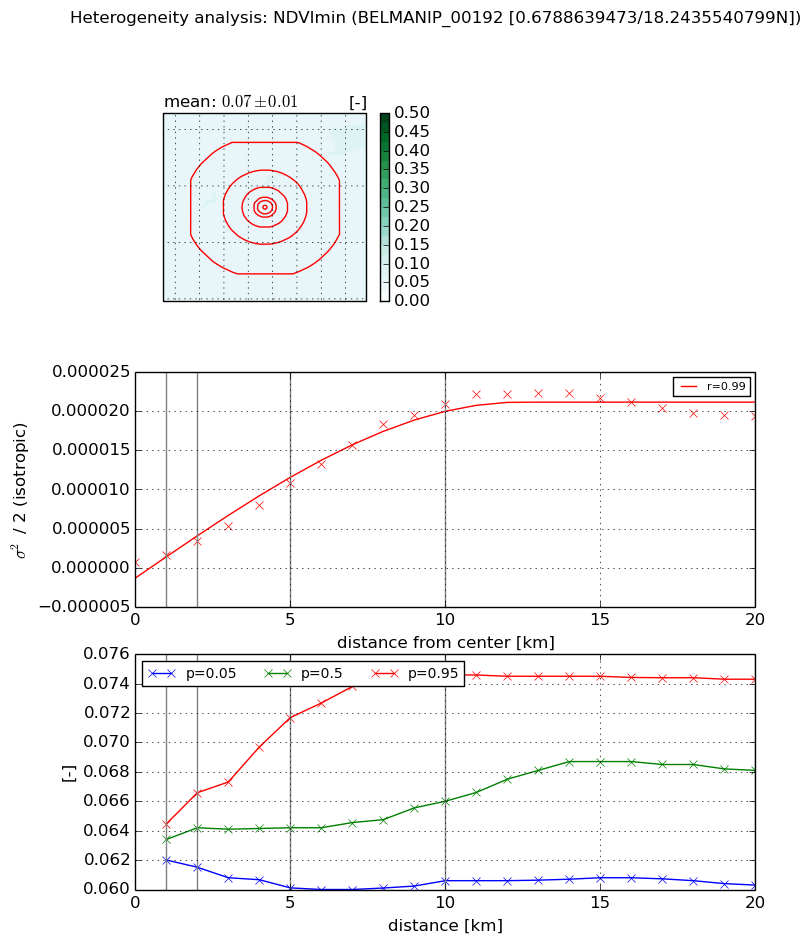
Heterogeneity analysis

The heterogeneity analysis provides information about the spatial and temporal heterogeneity of the site.

Topography


Roman et al. (2009) index


St

2.62474116852

Rcv

0.519155185577

Rse

0.0

Rst

-1.06955023485e-07

Rsv

-0.623814549971


Height range @ 1km [m]

8

Height range @ 2km [m]

10

Height range @ 5km [m]

22

Height range @ 10km [m]

-999

Height range @ 20km [m]

-999


Variance slope @ 1 km

6

Variance slope @ 2 km

6

Variance slope @ 5 km

8

Variance slope @ 10 km

-999

Variance slope @ 20 km

-999


NDVI (max. NDVI composite)


Roman et al. (2009) index


St

1.69012031661

Rcv

0.603059318193

Rse

0.0

Rst

-0.171962534393

Rsv

-0.999999706833


NDVI range @ 1km [-]

0.0

NDVI range @ 2km [-]

0.01

NDVI range @ 5km [-]

0.01

NDVI range @ 10km [-]

0.02

NDVI range @ 20km [-]

0.02


Variance slope @ 1 km

1.61422487998e-06

Variance slope @ 2 km

2.44445186476e-06

Variance slope @ 5 km

3.61047703377e-06

Variance slope @ 10 km

3.86921268389e-06

Variance slope @ 20 km

1.71648607316e-06


NDVI (min. NDVI composite)I


Roman et al. (2009) index


St

2.07767786357

Rcv

0.583526770582

Rse

0.0

Rst

4.98637202106e-09

Rsv

0.860392925653


NDVI range @ 1km [-]

0.0

NDVI range @ 2km [-]

0.01

NDVI range @ 5km [-]

0.01

NDVI range @ 10km [-]

0.01

NDVI range @ 20km [-]

0.01


NDVI slope @ 1 km

8.43571692392e-07

NDVI slope @ 2 km

1.30517297019e-06

NDVI slope @ 5 km

2.04533989993e-06

NDVI slope @ 10 km

2.21015595209e-06

NDVI slope @ 20 km

1.01568346684e-06


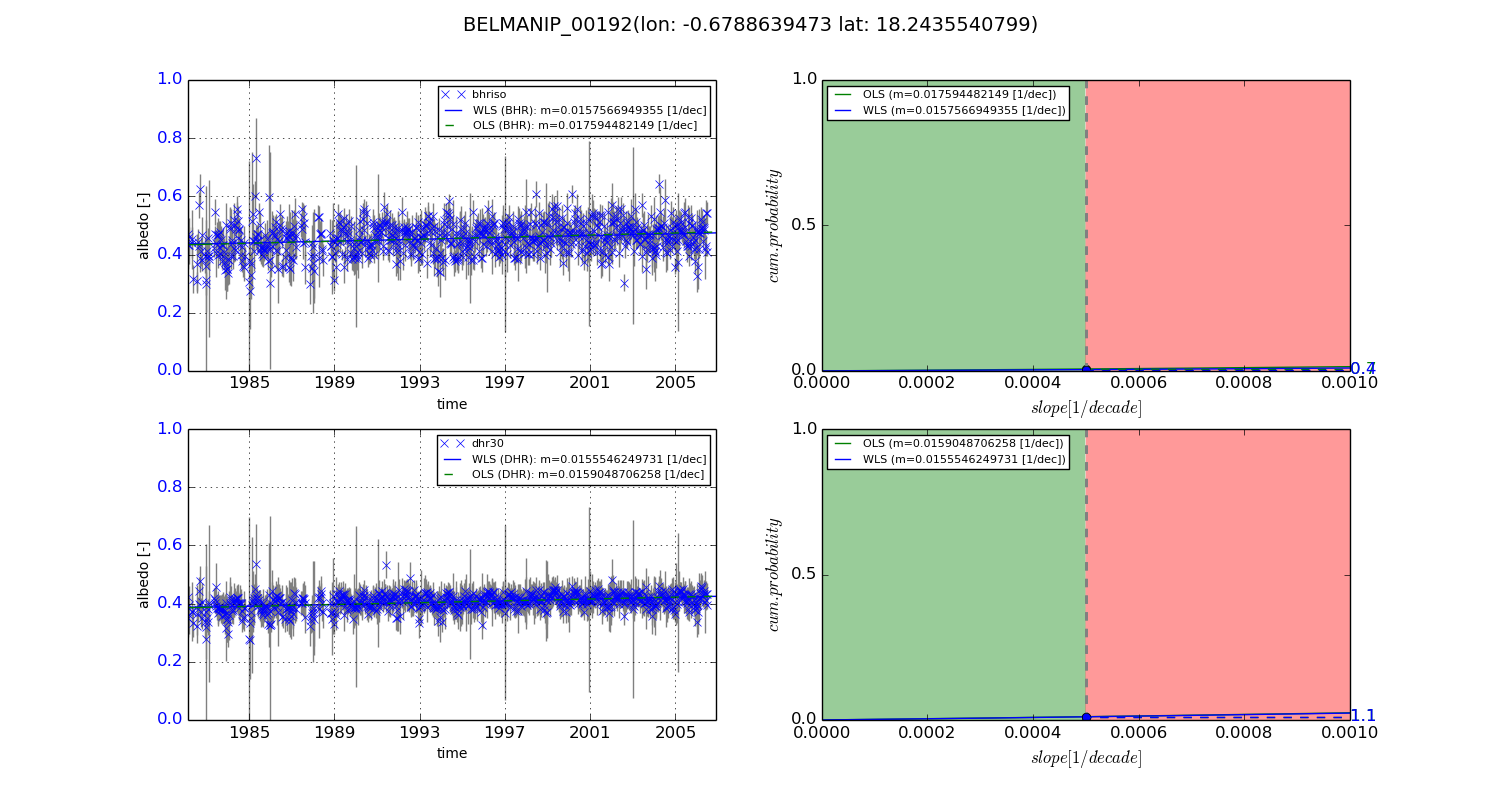
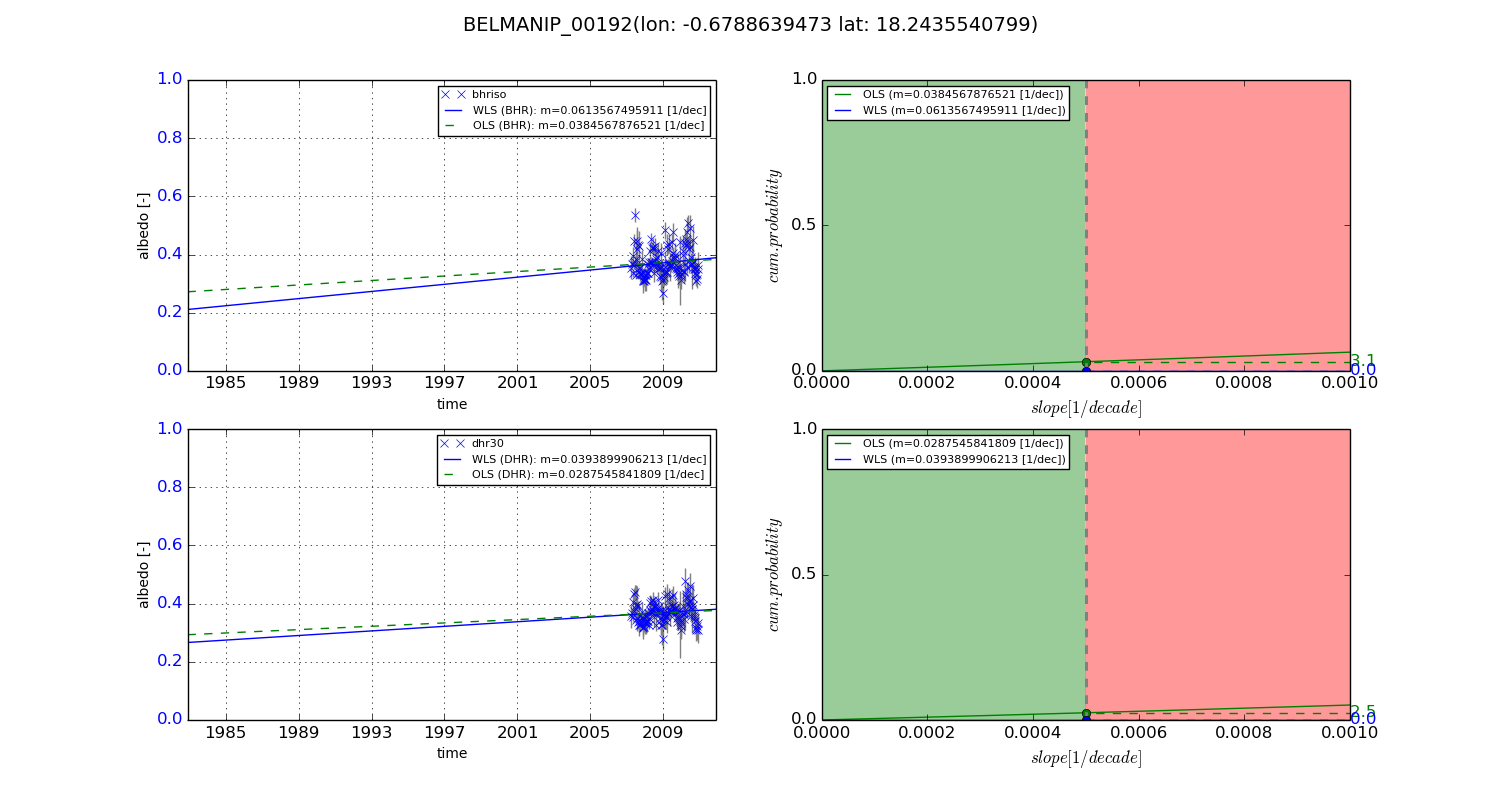
Temporal stability analysis

+000 deg (BHR)


BHR statistics

Temporal stability [1/decade]:


abs

rel


Weighted least square:

0.0157566949355


Ordinary least square:

0.017594482149


Probabilities that GCOS criteria is met:

Weighted least square:

0.4 %

Ordinary least square:

0.7 %


DHR statistics

Temporal stability [1/decade]:


abs

rel


Weighted least square:

0.0155546249731


Ordinary least square:

0.0159048706258


Probabilities that GCOS criteria is met:

Weighted least square:

1.1 %

Ordinary least square:

1.1 %


+057/+063 deg (BHR)


BHR statistics

Temporal stability [1/decade]:


abs

rel


Weighted least square:

0.0613567495911


Ordinary least square:

0.0384567876521


Probabilities that GCOS criteria is met:

Weighted least square:

0.0 %

Ordinary least square:

3.1 %


DHR statistics

Temporal stability [1/decade]:


abs

rel


Weighted least square:

0.0393899906213


Ordinary least square:

0.0287545841809


Probabilities that GCOS criteria is met:

Weighted least square:

0.0 %

Ordinary least square:

2.5 %


Temporal anomaly analyis

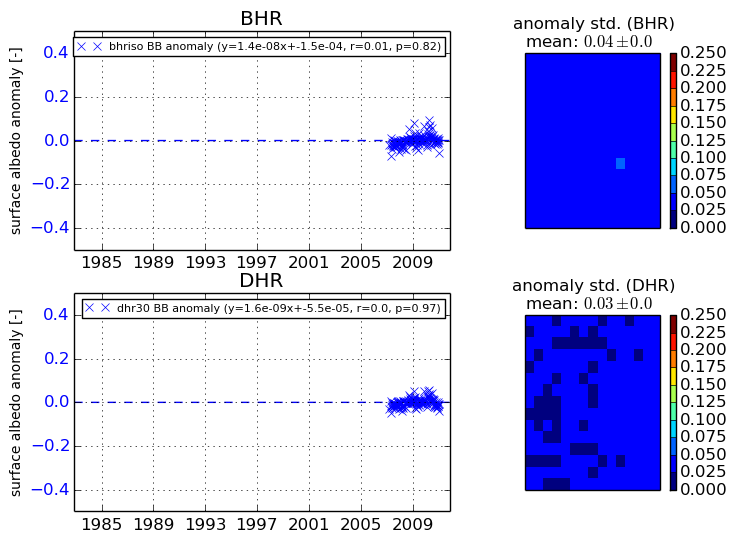
The variance of the temporal anomalies provides an additional measure about the stability of the signal AFTER removal of the mean seasonal cylce.
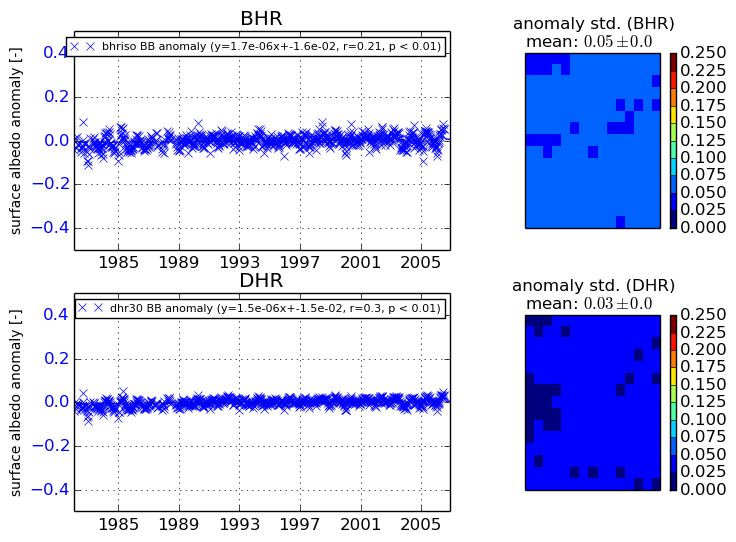
+000 deg


+057/+063 deg