BELMANIP_00194


Location

lon / lat [deg]: 20.0942 / 16.0197

Source network: BELMANIP


Geostationary surface albedo (GSA) data


“+000”


“+057/+063”


Landcover information (based on ESA CCI landcover data)


Landcover fractions @ 2km distance


Landcover fractions @ 20 km distance


Legend


Distance to open water bodies [km]:

none in region

Distance to urban areas [km]:

none in region


Radius: 1 km

Number of landcover classes:

1

Dominant landcover type:

200: bare areas

Fraction of dominant landcover type [%]:

100.0


Radius: 2 km

Number of landcover classes:

1

Dominant landcover type:

200: bare areas

Fraction of dominant landcover type [%]:

100.0


Radius: 5 km

Number of landcover classes:

1

Dominant landcover type:

200: bare areas

Fraction of dominant landcover type [%]:

100.0


Radius: 10 km

Number of landcover classes:

1

Dominant landcover type:

200: bare areas

Fraction of dominant landcover type [%]:

100.0


Radius: 20 km

Number of landcover classes:

1

Dominant landcover type:

200: bare areas

Fraction of dominant landcover type [%]:

100.0


Disturbances


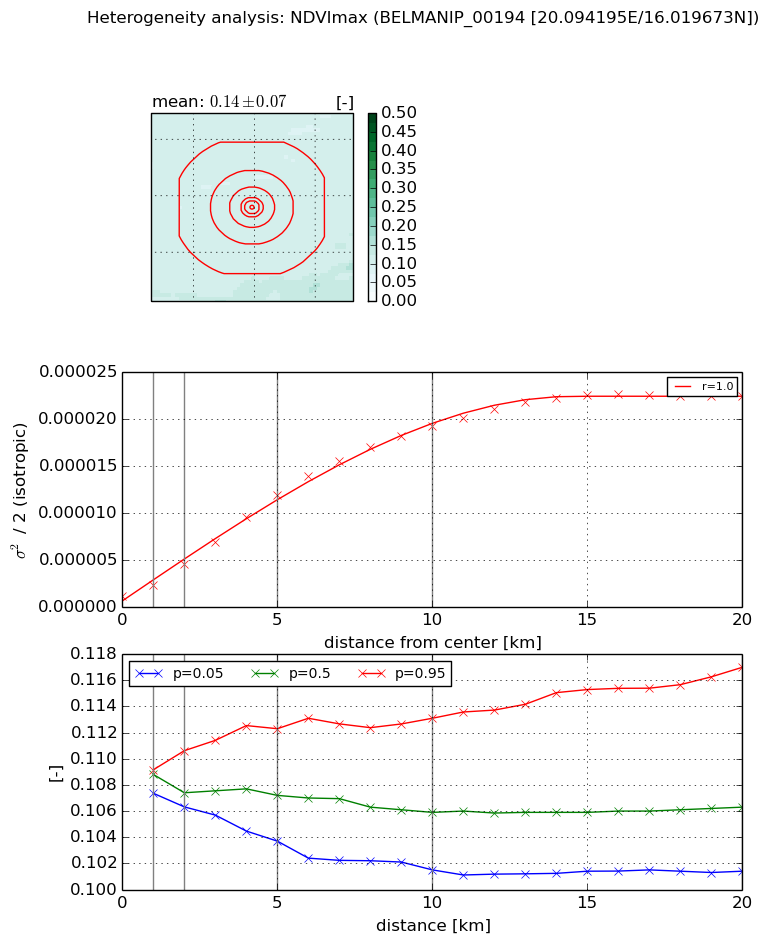
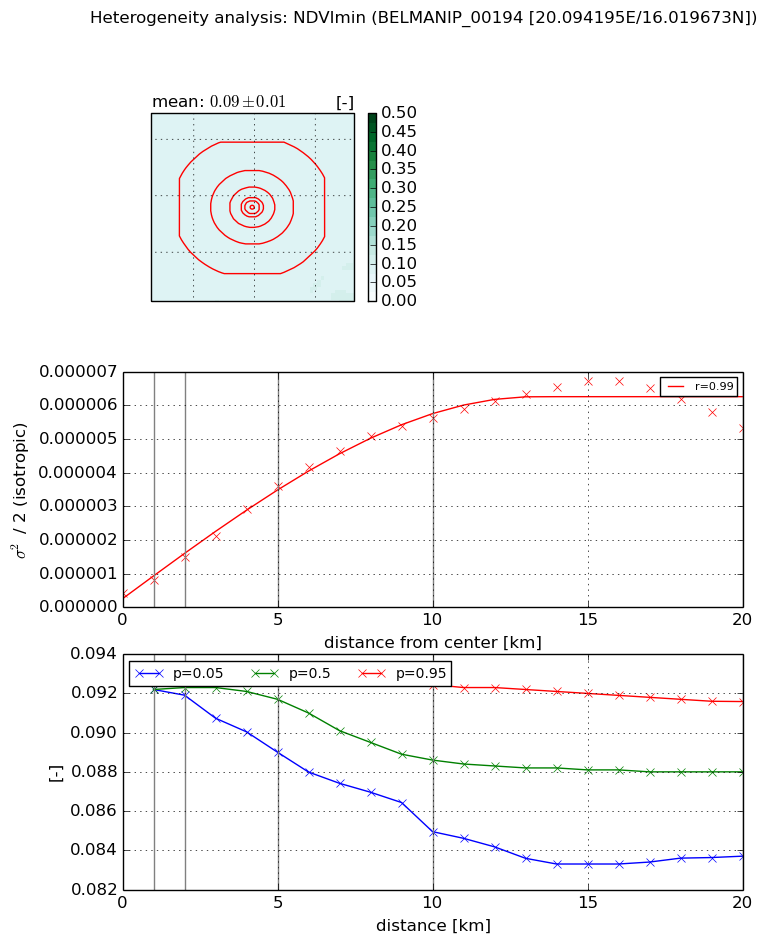
Heterogeneity analysis

The heterogeneity analysis provides information about the spatial and temporal heterogeneity of the site.

Topography


Roman et al. (2009) index


St

0.683323769798

Rcv

0.109729853686

Rse

0.0

Rst

2.02143102875e-08

Rsv

4.28057547269


Height range @ 1km [m]

9

Height range @ 2km [m]

12

Height range @ 5km [m]

18

Height range @ 10km [m]

-999

Height range @ 20km [m]

-999


Variance slope @ 1 km

4

Variance slope @ 2 km

4

Variance slope @ 5 km

4

Variance slope @ 10 km

-999

Variance slope @ 20 km

-999


NDVI (max. NDVI composite)


Roman et al. (2009) index


St

2.54774579087

Rcv

0.503622700262

Rse

0.0

Rst

-0.0589376830037

Rsv

0.61495112936


NDVI range @ 1km [-]

0.0

NDVI range @ 2km [-]

0.0

NDVI range @ 5km [-]

0.01

NDVI range @ 10km [-]

0.01

NDVI range @ 20km [-]

0.02


Variance slope @ 1 km

1.18415750802e-06

Variance slope @ 2 km

1.70922202973e-06

Variance slope @ 5 km

2.2140038439e-06

Variance slope @ 10 km

1.93267020002e-06

Variance slope @ 20 km

1.09108046033e-06


NDVI (min. NDVI composite)I


Roman et al. (2009) index


St

3.17729005277

Rcv

0.787695002688

Rse

0.0

Rst

-0.0717331229029

Rsv

0.0847727343173


NDVI range @ 1km [-]

0.0

NDVI range @ 2km [-]

0.0

NDVI range @ 5km [-]

0.0

NDVI range @ 10km [-]

0.01

NDVI range @ 20km [-]

0.01


NDVI slope @ 1 km

3.83460474431e-07

NDVI slope @ 2 km

5.3522569639e-07

NDVI slope @ 5 km

6.55154771051e-07

NDVI slope @ 10 km

5.59529082531e-07

NDVI slope @ 20 km

2.83680208103e-07


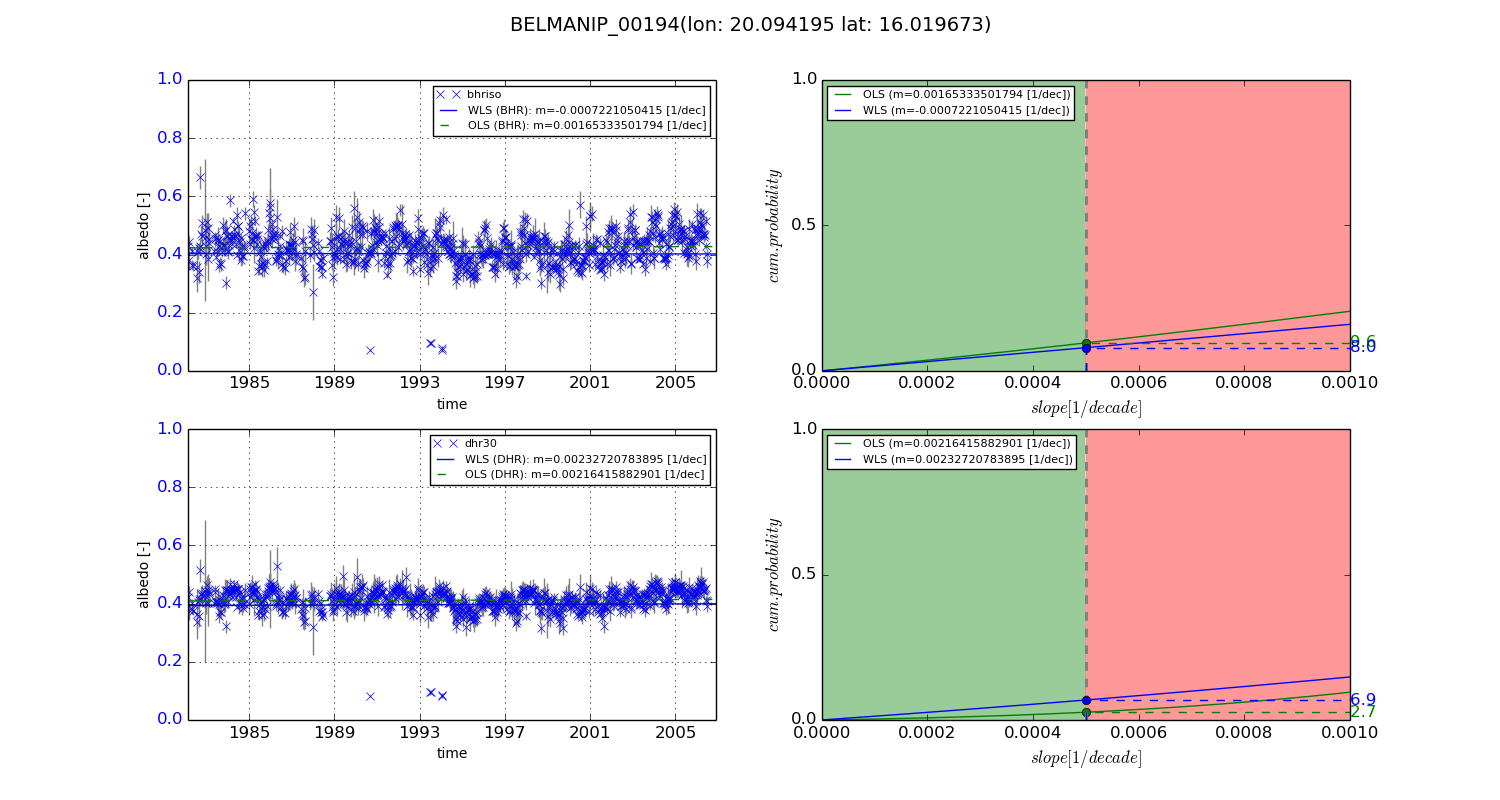
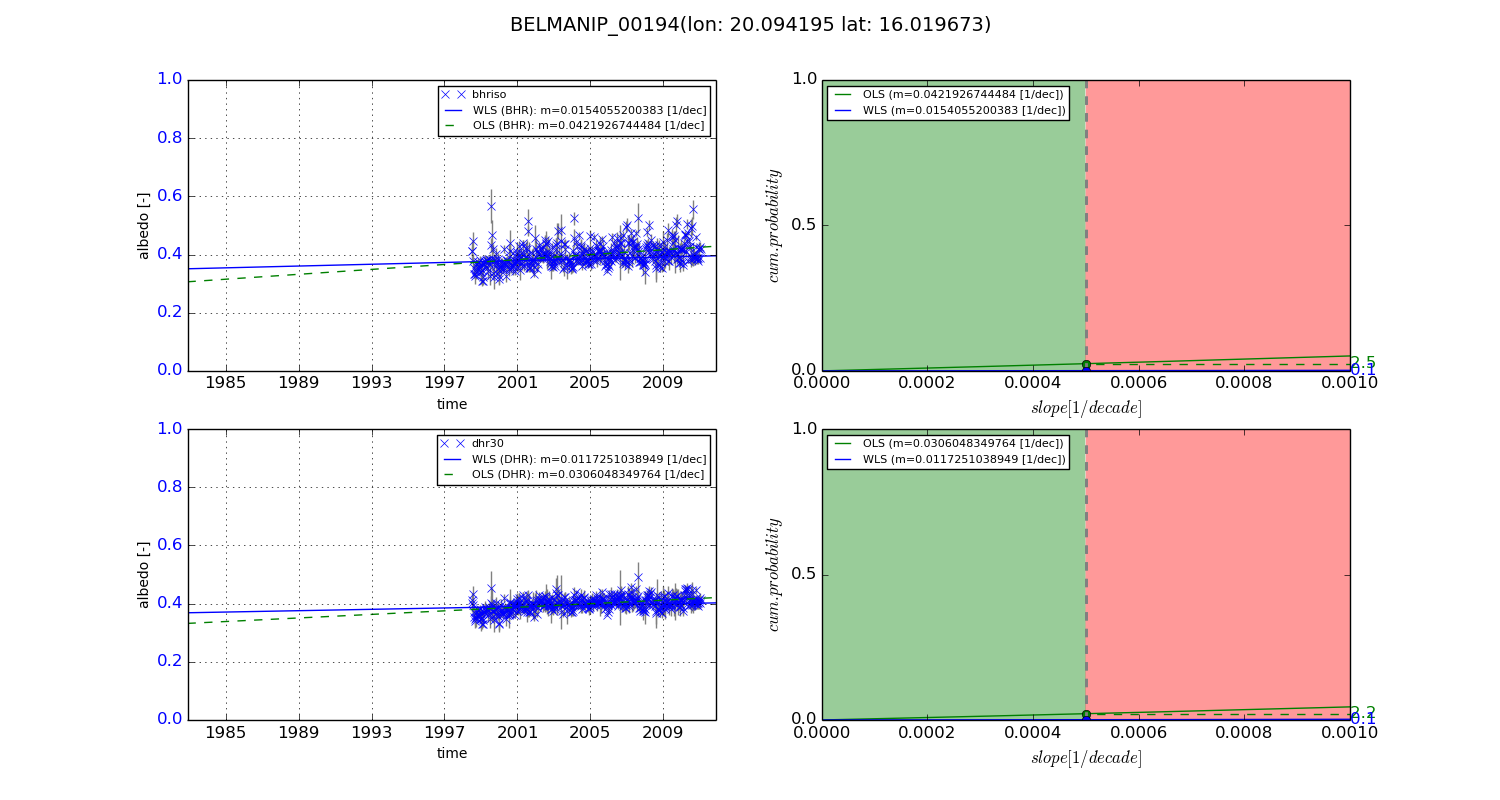
Temporal stability analysis

+000 deg (BHR)


BHR statistics

Temporal stability [1/decade]:


abs

rel


Weighted least square:

-0.0007221050415


Ordinary least square:

0.00165333501794


Probabilities that GCOS criteria is met:

Weighted least square:

8.0 %

Ordinary least square:

9.6 %


DHR statistics

Temporal stability [1/decade]:


abs

rel


Weighted least square:

0.00232720783895


Ordinary least square:

0.00216415882901


Probabilities that GCOS criteria is met:

Weighted least square:

6.9 %

Ordinary least square:

2.7 %


+057/+063 deg (BHR)


BHR statistics

Temporal stability [1/decade]:


abs

rel


Weighted least square:

0.0154055200383


Ordinary least square:

0.0421926744484


Probabilities that GCOS criteria is met:

Weighted least square:

0.1 %

Ordinary least square:

2.5 %


DHR statistics

Temporal stability [1/decade]:


abs

rel


Weighted least square:

0.0117251038949


Ordinary least square:

0.0306048349764


Probabilities that GCOS criteria is met:

Weighted least square:

0.1 %

Ordinary least square:

2.2 %


Temporal anomaly analyis

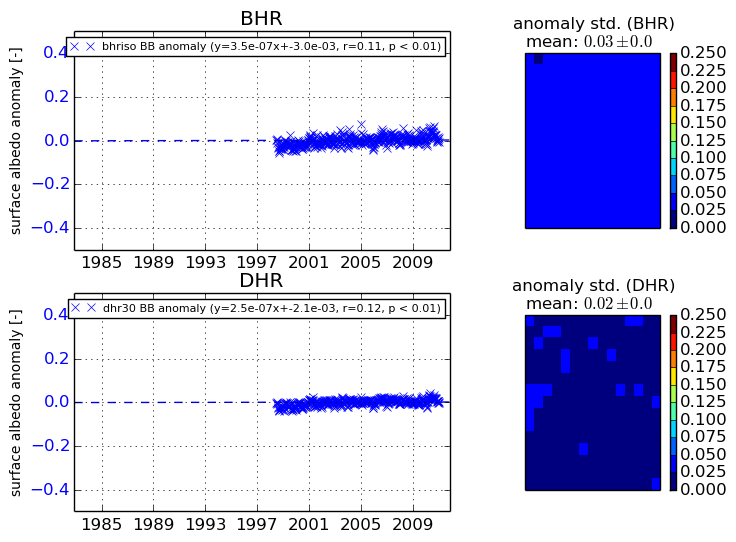
The variance of the temporal anomalies provides an additional measure about the stability of the signal AFTER removal of the mean seasonal cylce.
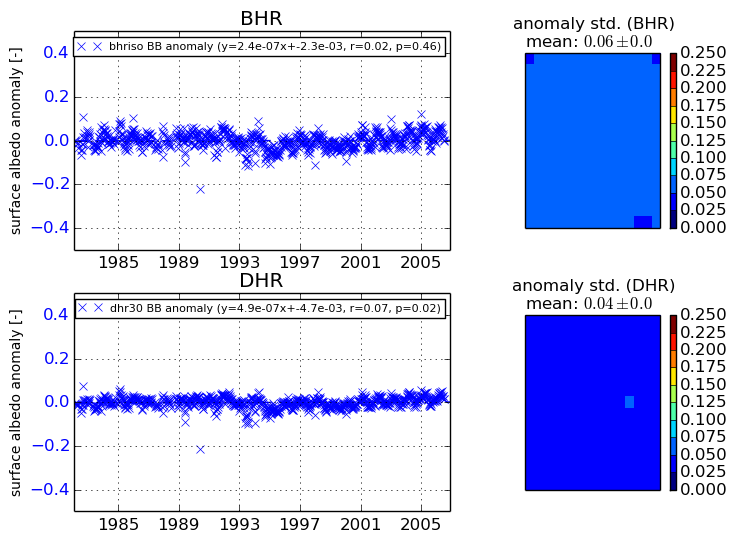
+000 deg


+057/+063 deg