BELMANIP_00196


Location

lon / lat [deg]: 34.6477 / 19.4339

Source network: BELMANIP


Geostationary surface albedo (GSA) data


“+000”


“+057/+063”


Landcover information (based on ESA CCI landcover data)


Landcover fractions @ 2km distance


Landcover fractions @ 20 km distance


Legend


Distance to open water bodies [km]:

none in region

Distance to urban areas [km]:

none in region


Radius: 1 km

Number of landcover classes:

1

Dominant landcover type:

200: bare areas

Fraction of dominant landcover type [%]:

100.0


Radius: 2 km

Number of landcover classes:

1

Dominant landcover type:

200: bare areas

Fraction of dominant landcover type [%]:

100.0


Radius: 5 km

Number of landcover classes:

1

Dominant landcover type:

200: bare areas

Fraction of dominant landcover type [%]:

100.0


Radius: 10 km

Number of landcover classes:

1

Dominant landcover type:

200: bare areas

Fraction of dominant landcover type [%]:

100.0


Radius: 20 km

Number of landcover classes:

1

Dominant landcover type:

200: bare areas

Fraction of dominant landcover type [%]:

100.0


Disturbances


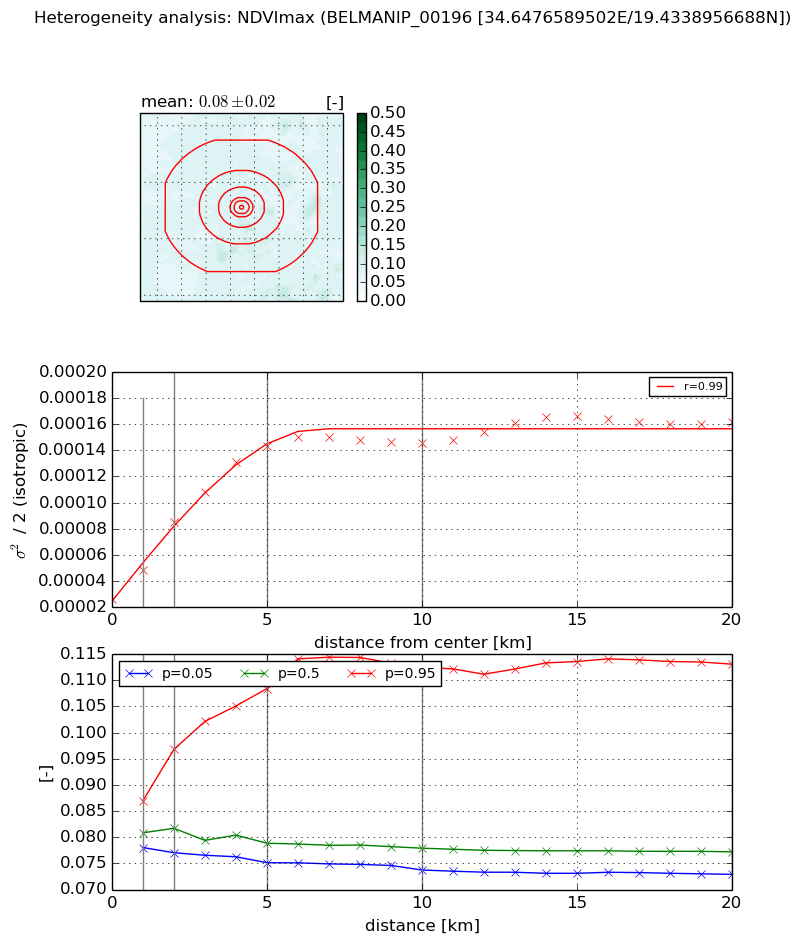
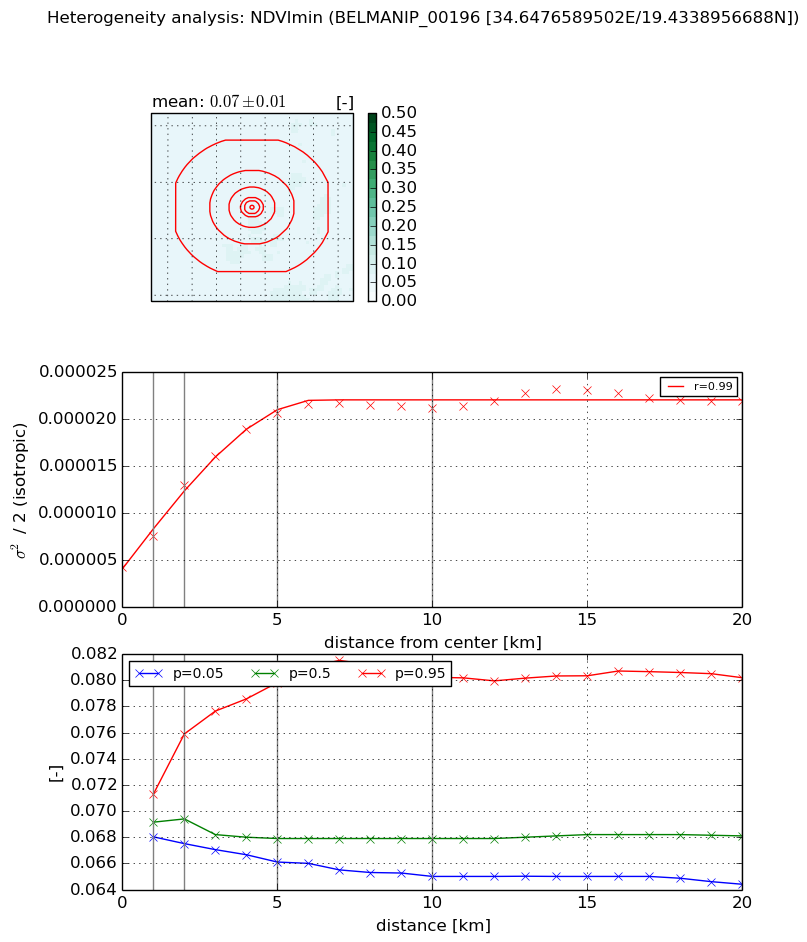
Heterogeneity analysis

The heterogeneity analysis provides information about the spatial and temporal heterogeneity of the site.

Topography


Roman et al. (2009) index


St

1.01014605308

Rcv

0.573741789943

Rse

0.0

Rst

-0.187636064155

Rsv

2.20848971194


Height range @ 1km [m]

20

Height range @ 2km [m]

46

Height range @ 5km [m]

47

Height range @ 10km [m]

-999

Height range @ 20km [m]

-999


Variance slope @ 1 km

269

Variance slope @ 2 km

189

Variance slope @ 5 km

99

Variance slope @ 10 km

-999

Variance slope @ 20 km

-999


NDVI (max. NDVI composite)


Roman et al. (2009) index


St

3.77647800827

Rcv

0.153522970573

Rse

0.0

Rst

-0.126183844788

Rsv

0.514684147177


NDVI range @ 1km [-]

0.01

NDVI range @ 2km [-]

0.02

NDVI range @ 5km [-]

0.03

NDVI range @ 10km [-]

0.04

NDVI range @ 20km [-]

0.04


Variance slope @ 1 km

2.1841530207e-05

Variance slope @ 2 km

2.93367313338e-05

Variance slope @ 5 km

2.44585971168e-05

Variance slope @ 10 km

1.16634831375e-05

Variance slope @ 20 km

4.86556812563e-06


NDVI (min. NDVI composite)I


Roman et al. (2009) index


St

5.33718660788

Rcv

0.126776413211

Rse

0.0

Rst

-0.0228640287611

Rsv

0.412453451385


NDVI range @ 1km [-]

0.0

NDVI range @ 2km [-]

0.01

NDVI range @ 5km [-]

0.01

NDVI range @ 10km [-]

0.02

NDVI range @ 20km [-]

0.02


NDVI slope @ 1 km

3.35699633734e-06

NDVI slope @ 2 km

4.36935097667e-06

NDVI slope @ 5 km

3.39995494037e-06

NDVI slope @ 10 km

1.6278025436e-06

NDVI slope @ 20 km

6.06283256357e-07


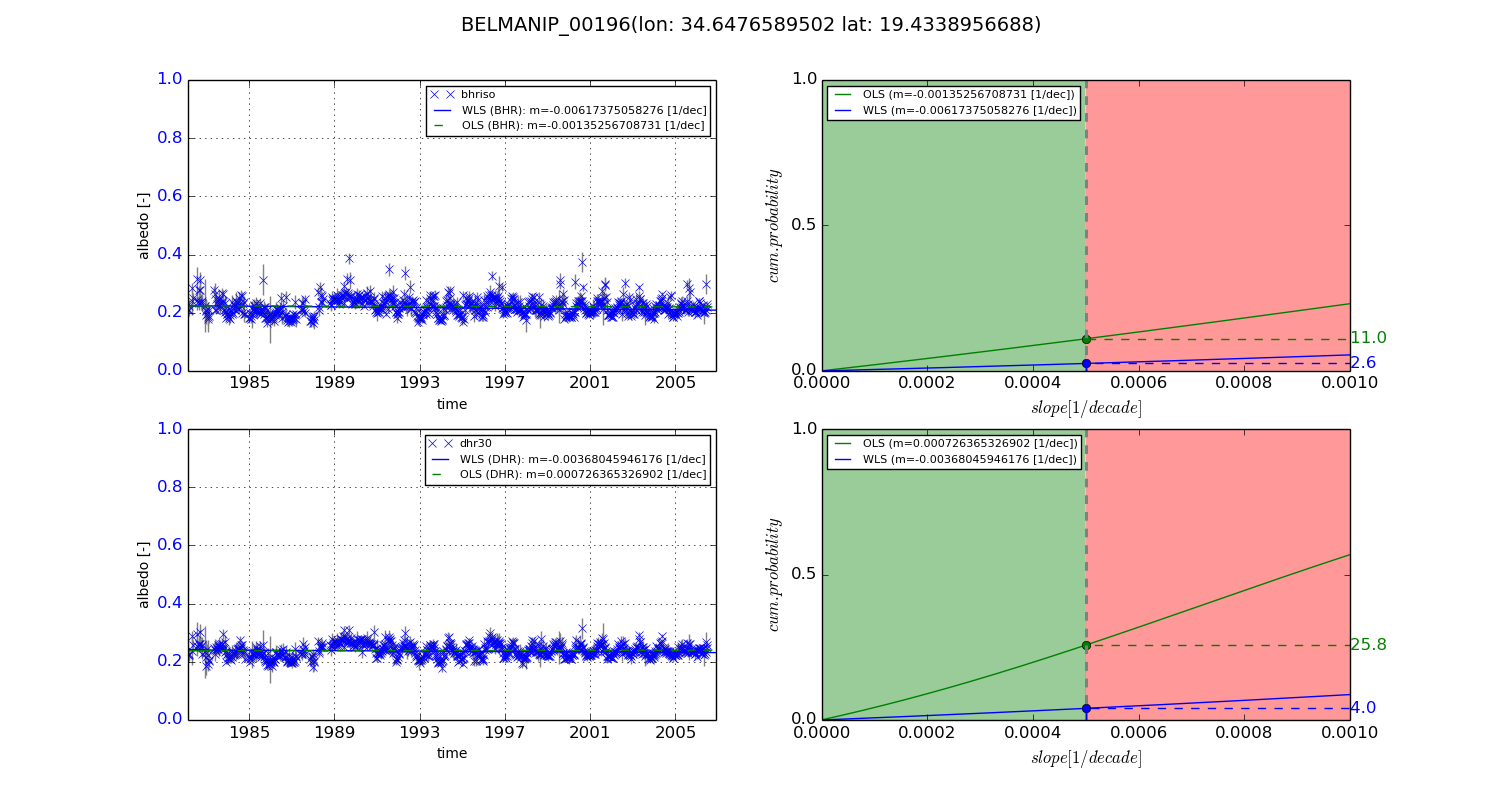
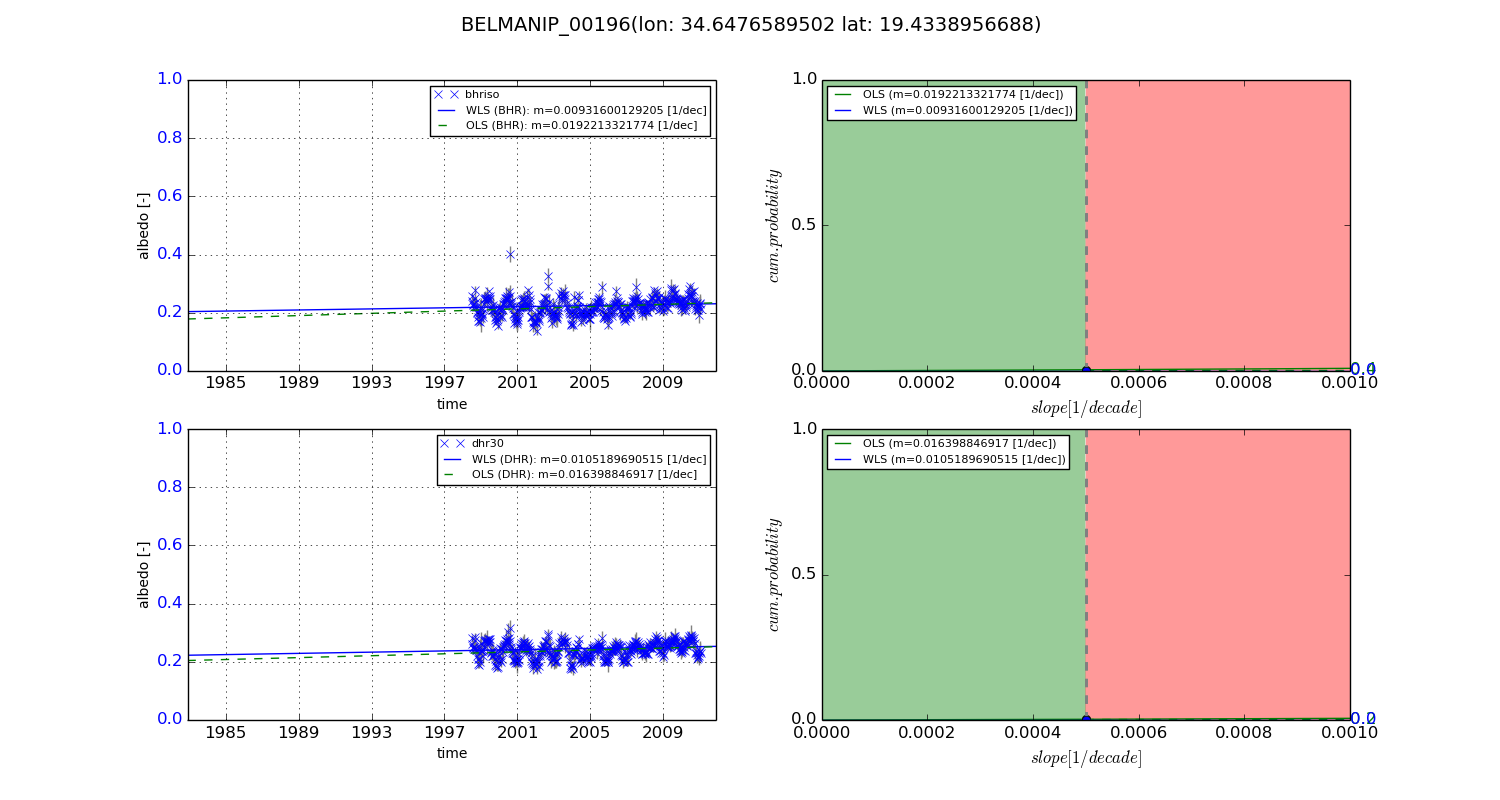
Temporal stability analysis

+000 deg (BHR)


BHR statistics

Temporal stability [1/decade]:


abs

rel


Weighted least square:

-0.00617375058276


Ordinary least square:

-0.00135256708731


Probabilities that GCOS criteria is met:

Weighted least square:

2.6 %

Ordinary least square:

11.0 %


DHR statistics

Temporal stability [1/decade]:


abs

rel


Weighted least square:

-0.00368045946176


Ordinary least square:

0.000726365326902


Probabilities that GCOS criteria is met:

Weighted least square:

4.0 %

Ordinary least square:

25.8 %


+057/+063 deg (BHR)


BHR statistics

Temporal stability [1/decade]:


abs

rel


Weighted least square:

0.00931600129205


Ordinary least square:

0.0192213321774


Probabilities that GCOS criteria is met:

Weighted least square:

0.0 %

Ordinary least square:

0.4 %


DHR statistics

Temporal stability [1/decade]:


abs

rel


Weighted least square:

0.0105189690515


Ordinary least square:

0.016398846917


Probabilities that GCOS criteria is met:

Weighted least square:

0.0 %

Ordinary least square:

0.2 %


Temporal anomaly analyis

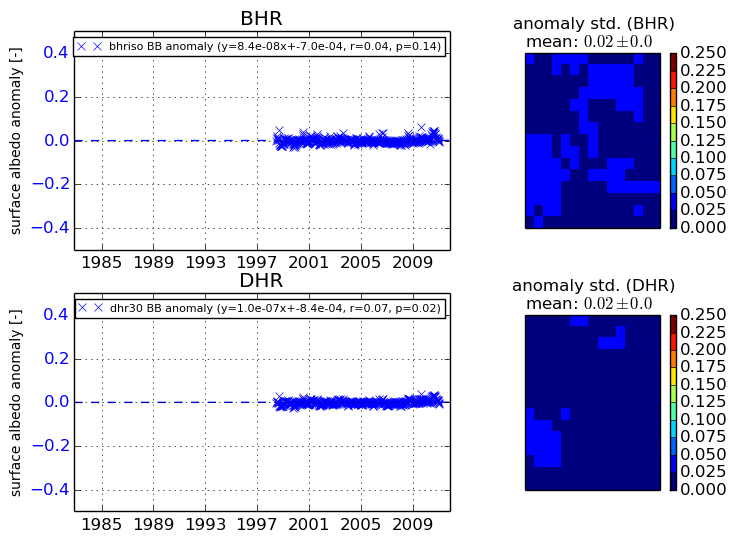
The variance of the temporal anomalies provides an additional measure about the stability of the signal AFTER removal of the mean seasonal cylce.
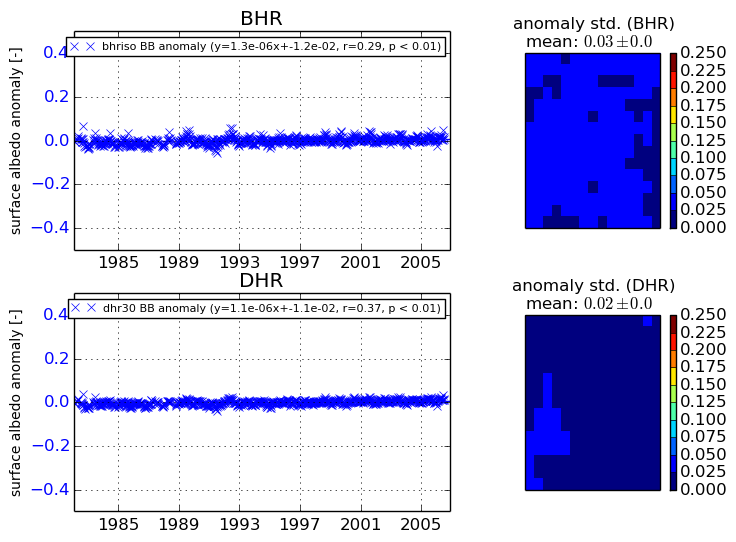
+000 deg


+057/+063 deg