BELMANIP_00197


Location

lon / lat [deg]: 46.9071 / 16.0305

Source network: BELMANIP


Geostationary surface albedo (GSA) data


“+000”


“+057/+063”


Landcover information (based on ESA CCI landcover data)


Landcover fractions @ 2km distance


Landcover fractions @ 20 km distance


Legend


Distance to open water bodies [km]:

none in region

Distance to urban areas [km]:

none in region


Radius: 1 km

Number of landcover classes:

1

Dominant landcover type:

200: bare areas

Fraction of dominant landcover type [%]:

100.0


Radius: 2 km

Number of landcover classes:

1

Dominant landcover type:

200: bare areas

Fraction of dominant landcover type [%]:

100.0


Radius: 5 km

Number of landcover classes:

1

Dominant landcover type:

200: bare areas

Fraction of dominant landcover type [%]:

100.0


Radius: 10 km

Number of landcover classes:

1

Dominant landcover type:

200: bare areas

Fraction of dominant landcover type [%]:

100.0


Radius: 20 km

Number of landcover classes:

1

Dominant landcover type:

200: bare areas

Fraction of dominant landcover type [%]:

100.0


Disturbances


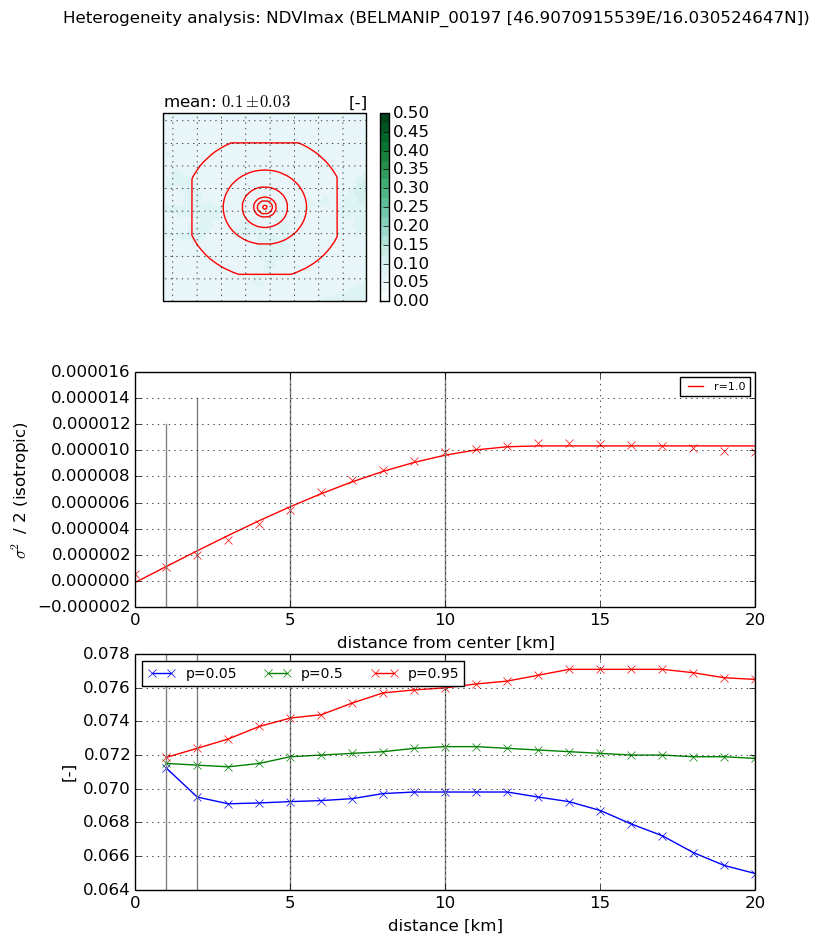
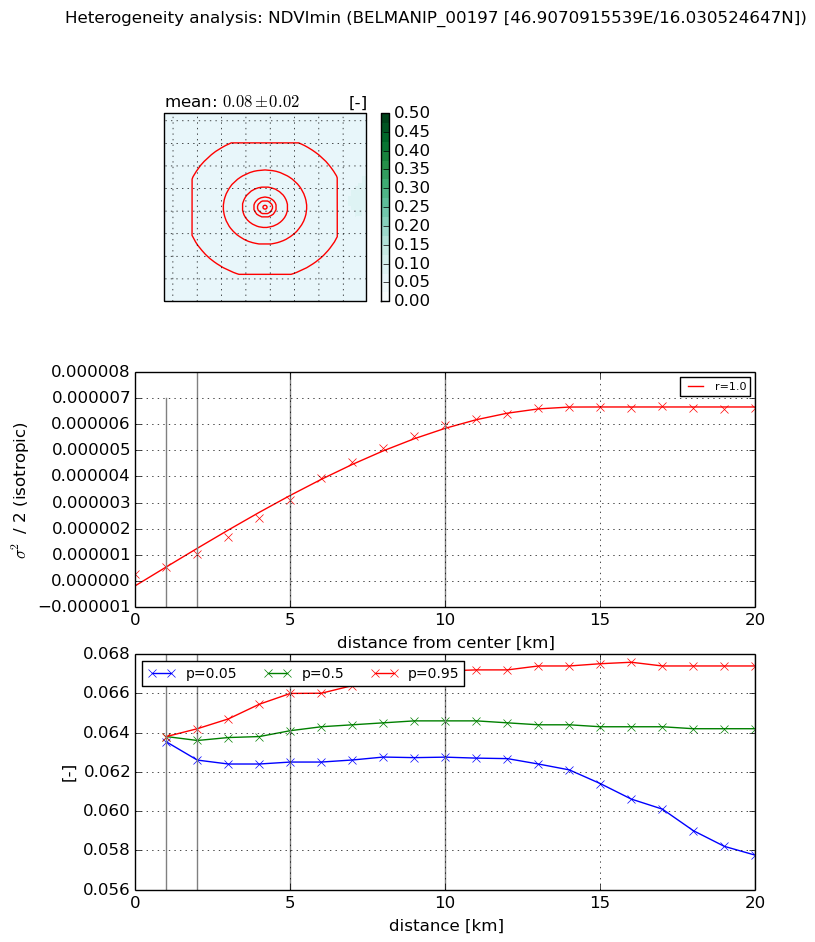
Heterogeneity analysis

The heterogeneity analysis provides information about the spatial and temporal heterogeneity of the site.

Topography


Roman et al. (2009) index


St

1.91603858835

Rcv

0.628640044664

Rse

0.0

Rst

-1.27644192301e-07

Rsv

-0.937090297968


Height range @ 1km [m]

9

Height range @ 2km [m]

11

Height range @ 5km [m]

27

Height range @ 10km [m]

-999

Height range @ 20km [m]

-999


Variance slope @ 1 km

6

Variance slope @ 2 km

8

Variance slope @ 5 km

14

Variance slope @ 10 km

-999

Variance slope @ 20 km

-999


NDVI (max. NDVI composite)


Roman et al. (2009) index


St

3.8542091297

Rcv

0.0805303043005

Rse

0.0

Rst

0.263323858612

Rsv

0.434515639827


NDVI range @ 1km [-]

0.0

NDVI range @ 2km [-]

0.0

NDVI range @ 5km [-]

0.0

NDVI range @ 10km [-]

0.01

NDVI range @ 20km [-]

0.01


Variance slope @ 1 km

5.11830270869e-07

Variance slope @ 2 km

7.22118695657e-07

Variance slope @ 5 km

1.01952374241e-06

Variance slope @ 10 km

1.00374413912e-06

Variance slope @ 20 km

4.92766638485e-07


NDVI (min. NDVI composite)I


Roman et al. (2009) index


St

3.76455940011

Rcv

0.239364996718

Rse

0.0

Rst

0.222524279205

Rsv

0.335016731168


NDVI range @ 1km [-]

0.0

NDVI range @ 2km [-]

0.0

NDVI range @ 5km [-]

0.0

NDVI range @ 10km [-]

0.0

NDVI range @ 20km [-]

0.01


NDVI slope @ 1 km

2.65497013373e-07

NDVI slope @ 2 km

3.85947772785e-07

NDVI slope @ 5 km

5.87547428572e-07

NDVI slope @ 10 km

6.17514623854e-07

NDVI slope @ 20 km

3.39116244687e-07


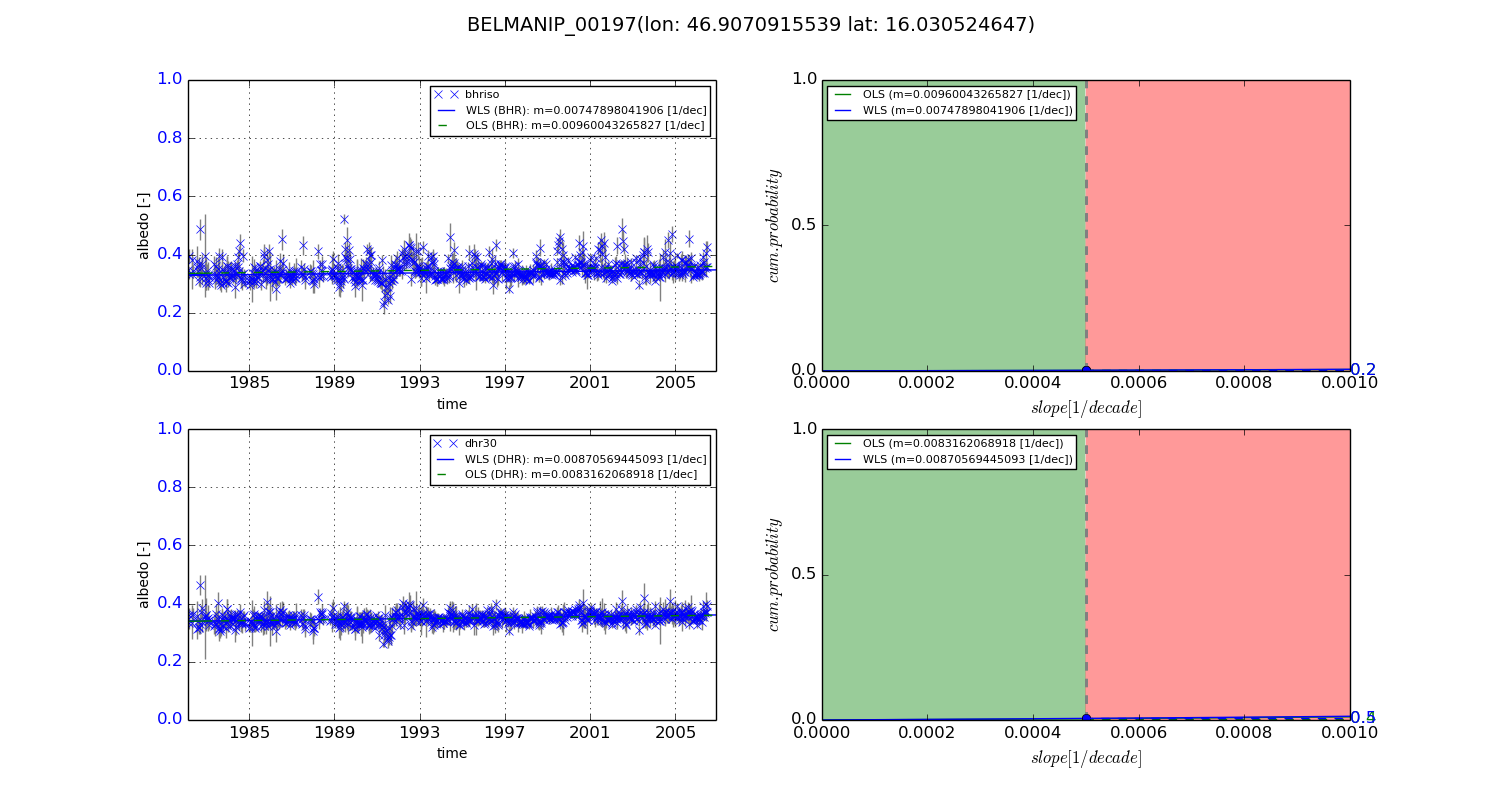
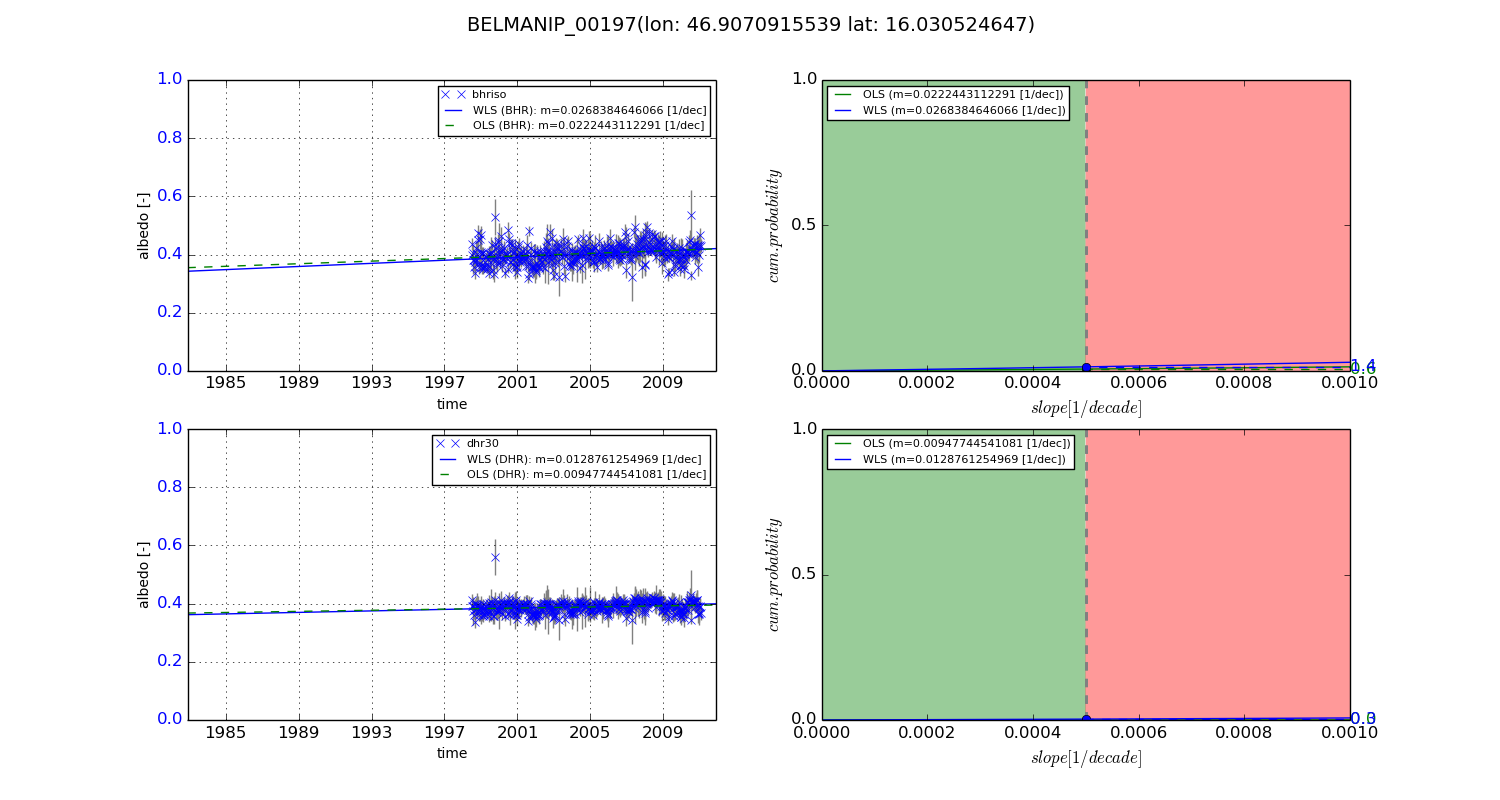
Temporal stability analysis

+000 deg (BHR)


BHR statistics

Temporal stability [1/decade]:


abs

rel


Weighted least square:

0.00747898041906


Ordinary least square:

0.00960043265827


Probabilities that GCOS criteria is met:

Weighted least square:

0.2 %

Ordinary least square:

0.2 %


DHR statistics

Temporal stability [1/decade]:


abs

rel


Weighted least square:

0.00870569445093


Ordinary least square:

0.0083162068918


Probabilities that GCOS criteria is met:

Weighted least square:

0.5 %

Ordinary least square:

0.4 %


+057/+063 deg (BHR)


BHR statistics

Temporal stability [1/decade]:


abs

rel


Weighted least square:

0.0268384646066


Ordinary least square:

0.0222443112291


Probabilities that GCOS criteria is met:

Weighted least square:

1.4 %

Ordinary least square:

0.6 %


DHR statistics

Temporal stability [1/decade]:


abs

rel


Weighted least square:

0.0128761254969


Ordinary least square:

0.00947744541081


Probabilities that GCOS criteria is met:

Weighted least square:

0.3 %

Ordinary least square:

0.0 %


Temporal anomaly analyis

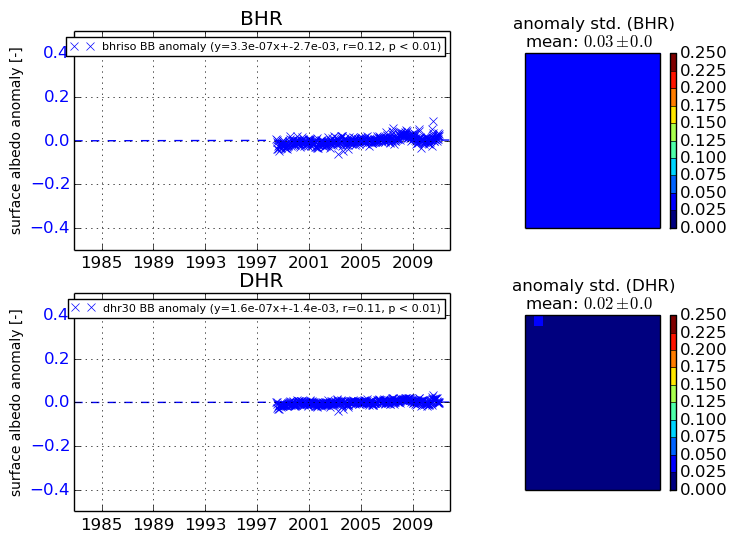
The variance of the temporal anomalies provides an additional measure about the stability of the signal AFTER removal of the mean seasonal cylce.
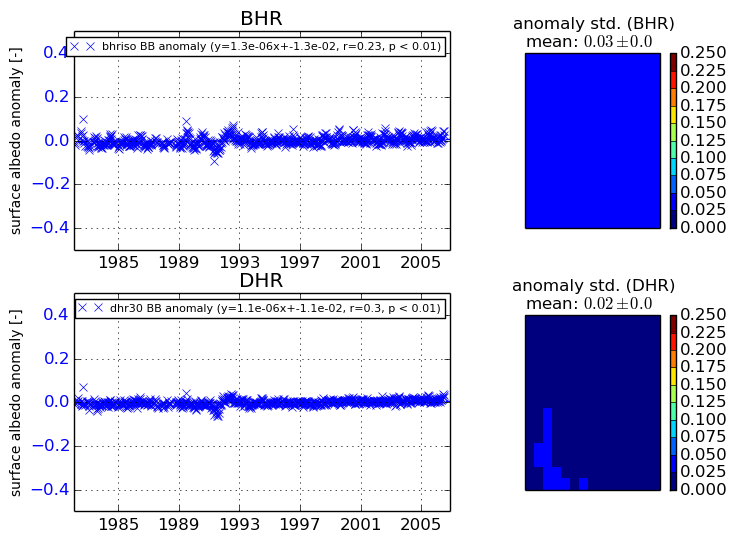
+000 deg


+057/+063 deg