BELMANIP_00198


Location

lon / lat [deg]: 51.1011 / 18.9812

Source network: BELMANIP


Geostationary surface albedo (GSA) data


“+000”


“+057/+063”


Landcover information (based on ESA CCI landcover data)


Landcover fractions @ 2km distance


Landcover fractions @ 20 km distance


Legend


Distance to open water bodies [km]:

none in region

Distance to urban areas [km]:

13.96


Radius: 1 km

Number of landcover classes:

1

Dominant landcover type:

200: bare areas

Fraction of dominant landcover type [%]:

100.0


Radius: 2 km

Number of landcover classes:

1

Dominant landcover type:

200: bare areas

Fraction of dominant landcover type [%]:

100.0


Radius: 5 km

Number of landcover classes:

1

Dominant landcover type:

200: bare areas

Fraction of dominant landcover type [%]:

100.0


Radius: 10 km

Number of landcover classes:

1

Dominant landcover type:

200: bare areas

Fraction of dominant landcover type [%]:

100.0


Radius: 20 km

Number of landcover classes:

1

Dominant landcover type:

200: bare areas

Fraction of dominant landcover type [%]:

100.0


Disturbances


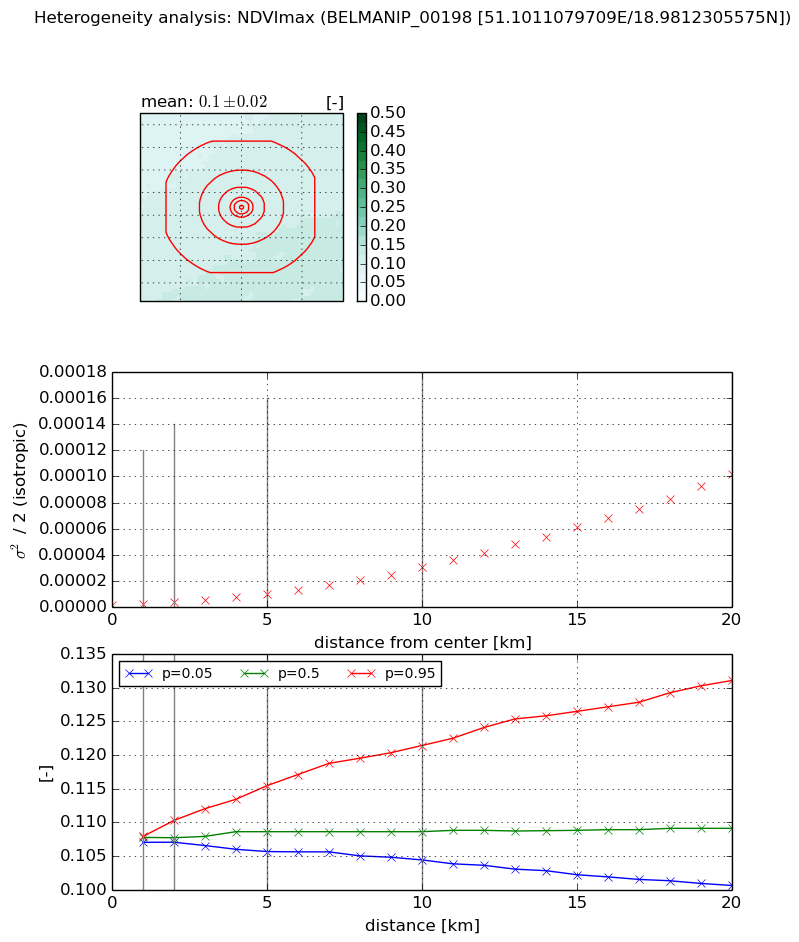
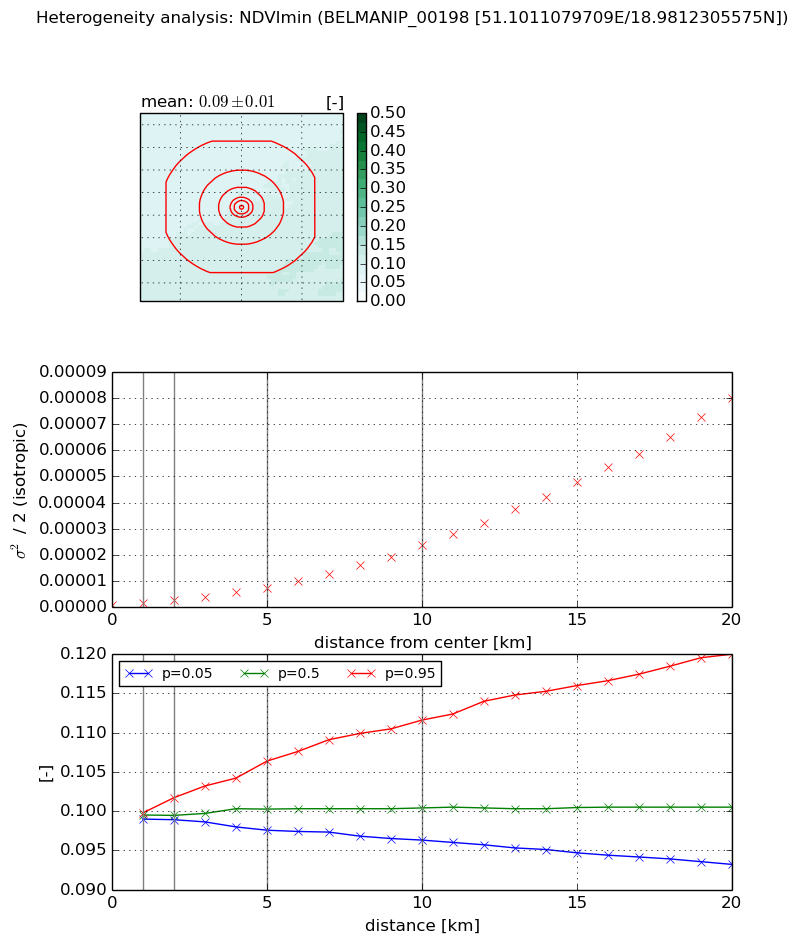
Heterogeneity analysis

The heterogeneity analysis provides information about the spatial and temporal heterogeneity of the site.

Topography


Roman et al. (2009) index


St

20.4999538873

Rcv

-0.0293354065879

Rse

0.0

Rst

0.00713947578202

Rsv

-0.109866910226


Height range @ 1km [m]

61

Height range @ 2km [m]

68

Height range @ 5km [m]

68

Height range @ 10km [m]

-999

Height range @ 20km [m]

-999


Variance slope @ 1 km

552

Variance slope @ 2 km

198

Variance slope @ 5 km

33

Variance slope @ 10 km

-999

Variance slope @ 20 km

-999


NDVI (max. NDVI composite)


Roman et al. (2009) index


St

4.57521123914e-05

Rcv

0.609405640977

Rse

0.0

Rst

0.12118696689

Rsv

65570.0123347


NDVI range @ 1km [-]

0.0

NDVI range @ 2km [-]

0.0

NDVI range @ 5km [-]

0.01

NDVI range @ 10km [-]

0.02

NDVI range @ 20km [-]

0.03


Variance slope @ 1 km

9.57581429656e-07

Variance slope @ 2 km

1.26813631805e-06

Variance slope @ 5 km

1.76740704099e-06

Variance slope @ 10 km

2.86382728823e-06

Variance slope @ 20 km

5.02295219669e-06


NDVI (min. NDVI composite)I


Roman et al. (2009) index


St

2.07244818885e-06

Rcv

0.670610247775

Rse

0.0

Rst

0.0464101778559

Rsv

1447562.61226


NDVI range @ 1km [-]

0.0

NDVI range @ 2km [-]

0.0

NDVI range @ 5km [-]

0.01

NDVI range @ 10km [-]

0.02

NDVI range @ 20km [-]

0.03


NDVI slope @ 1 km

6.74138170543e-07

NDVI slope @ 2 km

9.20808307105e-07

NDVI slope @ 5 km

1.34300413989e-06

NDVI slope @ 10 km

2.23647680827e-06

NDVI slope @ 20 km

3.96209601636e-06


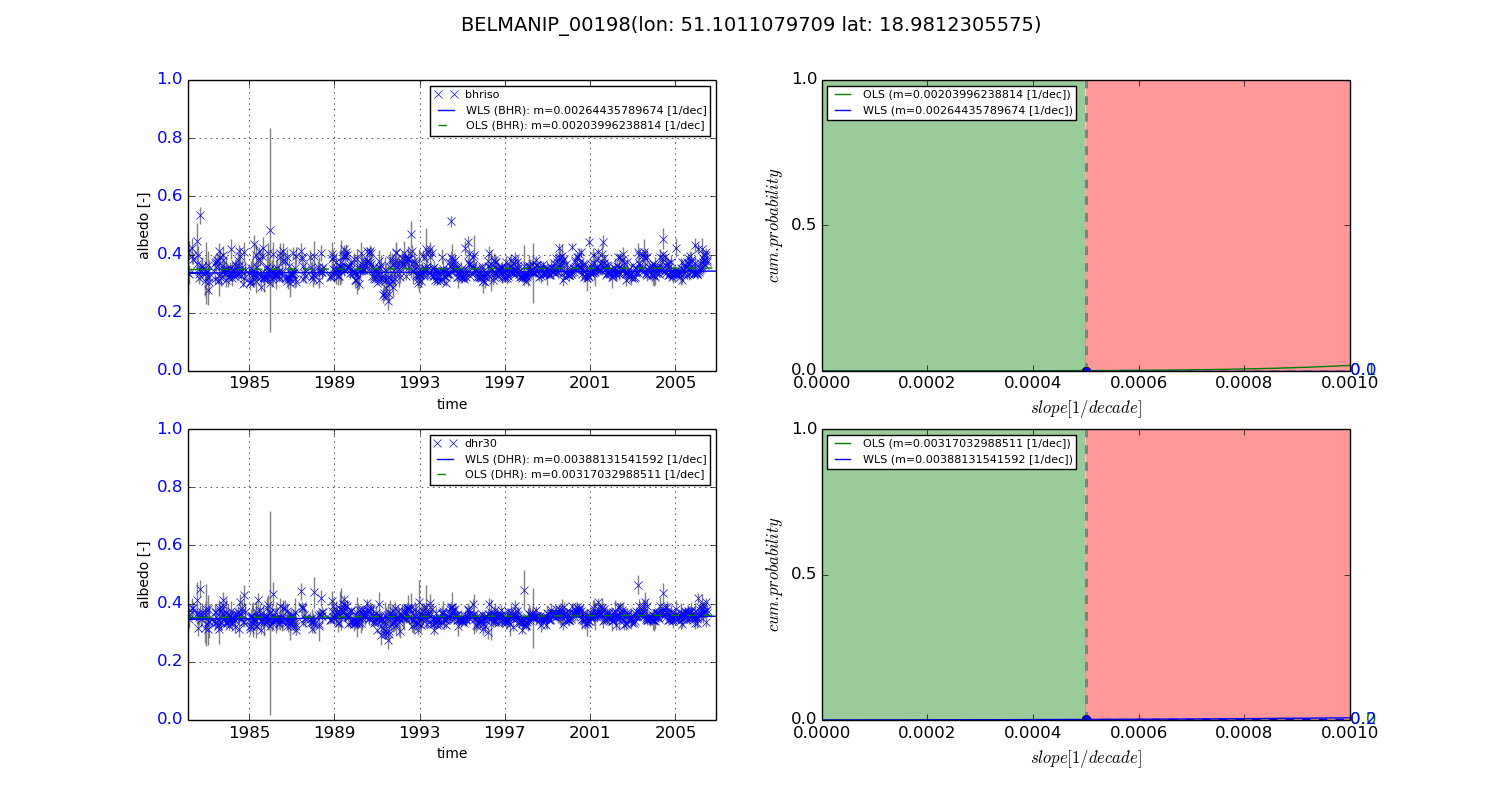
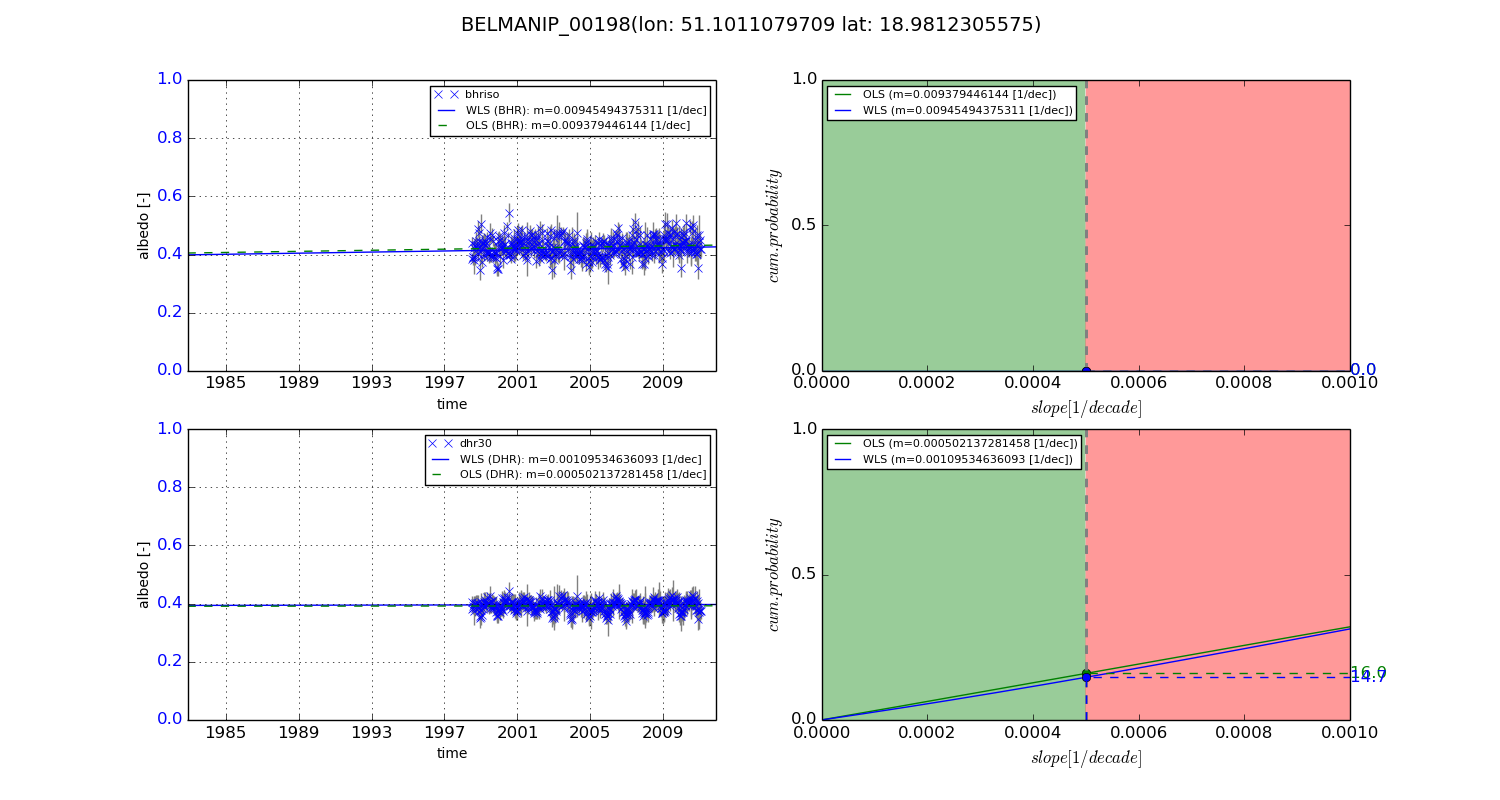
Temporal stability analysis

+000 deg (BHR)


BHR statistics

Temporal stability [1/decade]:


abs

rel


Weighted least square:

0.00264435789674


Ordinary least square:

0.00203996238814


Probabilities that GCOS criteria is met:

Weighted least square:

0.0 %

Ordinary least square:

0.1 %


DHR statistics

Temporal stability [1/decade]:


abs

rel


Weighted least square:

0.00388131541592


Ordinary least square:

0.00317032988511


Probabilities that GCOS criteria is met:

Weighted least square:

0.2 %

Ordinary least square:

0.0 %


+057/+063 deg (BHR)


BHR statistics

Temporal stability [1/decade]:


abs

rel


Weighted least square:

0.00945494375311


Ordinary least square:

0.009379446144


Probabilities that GCOS criteria is met:

Weighted least square:

0.0 %

Ordinary least square:

0.0 %


DHR statistics

Temporal stability [1/decade]:


abs

rel


Weighted least square:

0.00109534636093


Ordinary least square:

0.000502137281458


Probabilities that GCOS criteria is met:

Weighted least square:

14.7 %

Ordinary least square:

16.0 %


Temporal anomaly analyis

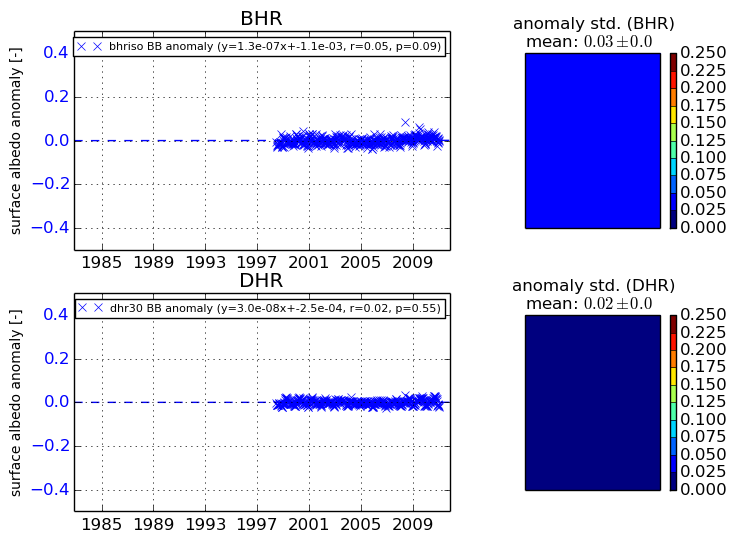
The variance of the temporal anomalies provides an additional measure about the stability of the signal AFTER removal of the mean seasonal cylce.
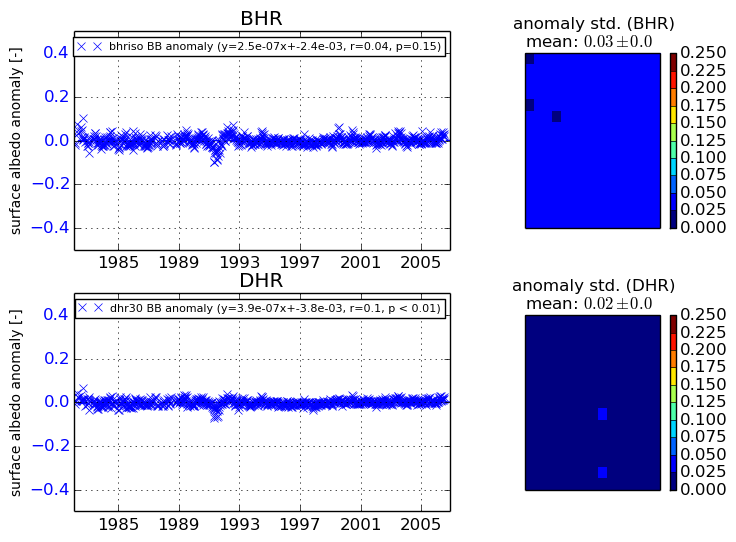
+000 deg


+057/+063 deg