BELMANIP_00202


Location

lon / lat [deg]: -5.0342 / 28.2771

Source network: BELMANIP


Geostationary surface albedo (GSA) data


“+000”


“+057/+063”


Landcover information (based on ESA CCI landcover data)


Landcover fractions @ 2km distance


Landcover fractions @ 20 km distance


Legend


Distance to open water bodies [km]:

none in region

Distance to urban areas [km]:

none in region


Radius: 1 km

Number of landcover classes:

1

Dominant landcover type:

200: bare areas

Fraction of dominant landcover type [%]:

100.0


Radius: 2 km

Number of landcover classes:

1

Dominant landcover type:

200: bare areas

Fraction of dominant landcover type [%]:

100.0


Radius: 5 km

Number of landcover classes:

1

Dominant landcover type:

200: bare areas

Fraction of dominant landcover type [%]:

100.0


Radius: 10 km

Number of landcover classes:

1

Dominant landcover type:

200: bare areas

Fraction of dominant landcover type [%]:

100.0


Radius: 20 km

Number of landcover classes:

1

Dominant landcover type:

200: bare areas

Fraction of dominant landcover type [%]:

100.0


Disturbances


Heterogeneity analysis

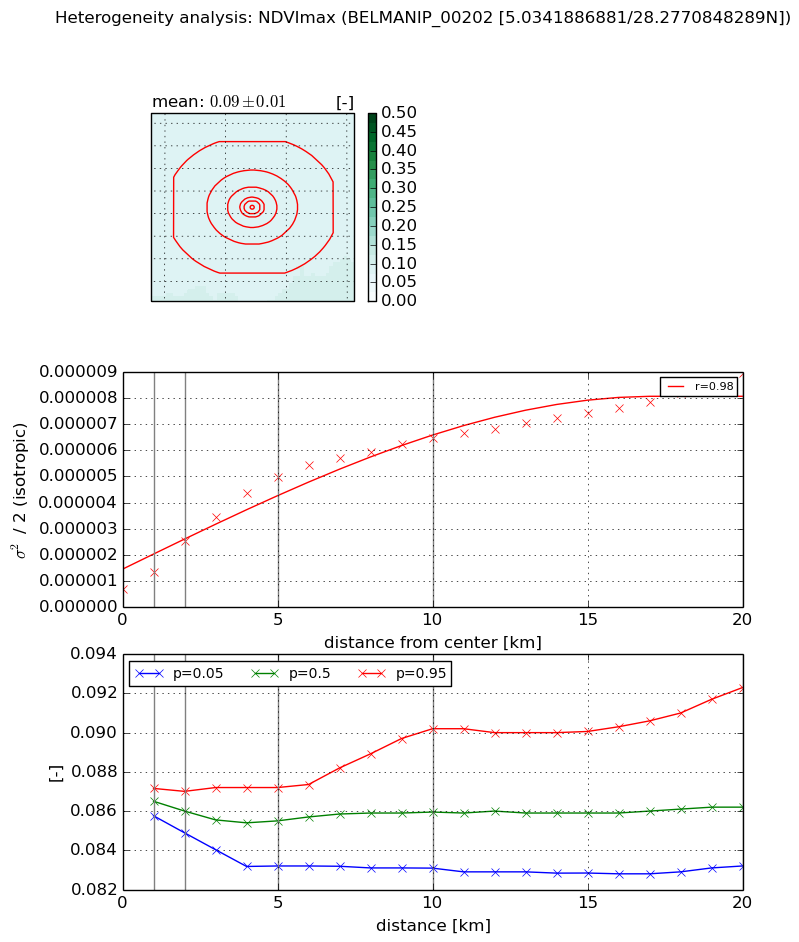
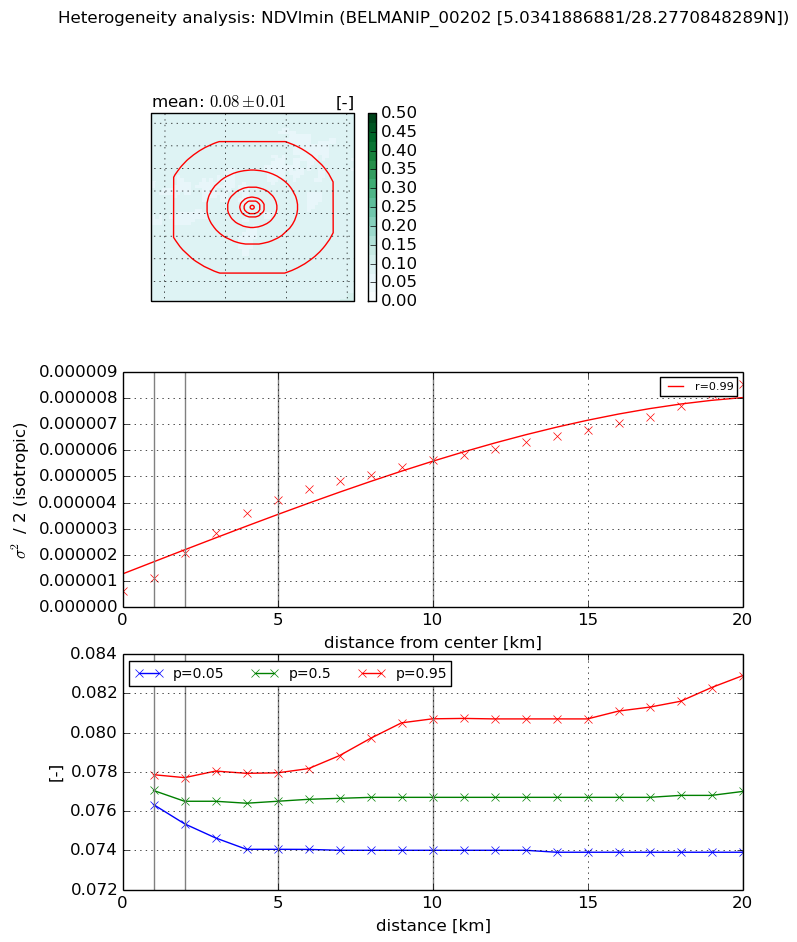
The heterogeneity analysis provides information about the spatial and temporal heterogeneity of the site.

Topography


Roman et al. (2009) index


St

1.1171889567e-07

Rcv

0.15654231518

Rse

0.0

Rst

-0.0148673678031

Rsv

26853111.668


Height range @ 1km [m]

12

Height range @ 2km [m]

34

Height range @ 5km [m]

39

Height range @ 10km [m]

-999

Height range @ 20km [m]

-999


Variance slope @ 1 km

55

Variance slope @ 2 km

50

Variance slope @ 5 km

37

Variance slope @ 10 km

-999

Variance slope @ 20 km

-999


NDVI (max. NDVI composite)


Roman et al. (2009) index


St

1.00119889081e-07

Rcv

0.182072505216

Rse

0.0

Rst

0.977979529692

Rsv

29964075.1841


NDVI range @ 1km [-]

0.0

NDVI range @ 2km [-]

0.0

NDVI range @ 5km [-]

0.0

NDVI range @ 10km [-]

0.01

NDVI range @ 20km [-]

0.01


Variance slope @ 1 km

6.25055384432e-07

Variance slope @ 2 km

9.09588319276e-07

Variance slope @ 5 km

8.98953597144e-07

Variance slope @ 10 km

5.82561667524e-07

Variance slope @ 20 km

3.48609146522e-07


NDVI (min. NDVI composite)I


Roman et al. (2009) index


St

7.0006259349e-07

Rcv

0.101929928822

Rse

0.0

Rst

1.04282669513

Rsv

4285329.94977


NDVI range @ 1km [-]

0.0

NDVI range @ 2km [-]

0.0

NDVI range @ 5km [-]

0.0

NDVI range @ 10km [-]

0.01

NDVI range @ 20km [-]

0.01


NDVI slope @ 1 km

5.14021738249e-07

NDVI slope @ 2 km

7.31641279627e-07

NDVI slope @ 5 km

7.2928868716e-07

NDVI slope @ 10 km

5.06483451426e-07

NDVI slope @ 20 km

3.47959206772e-07


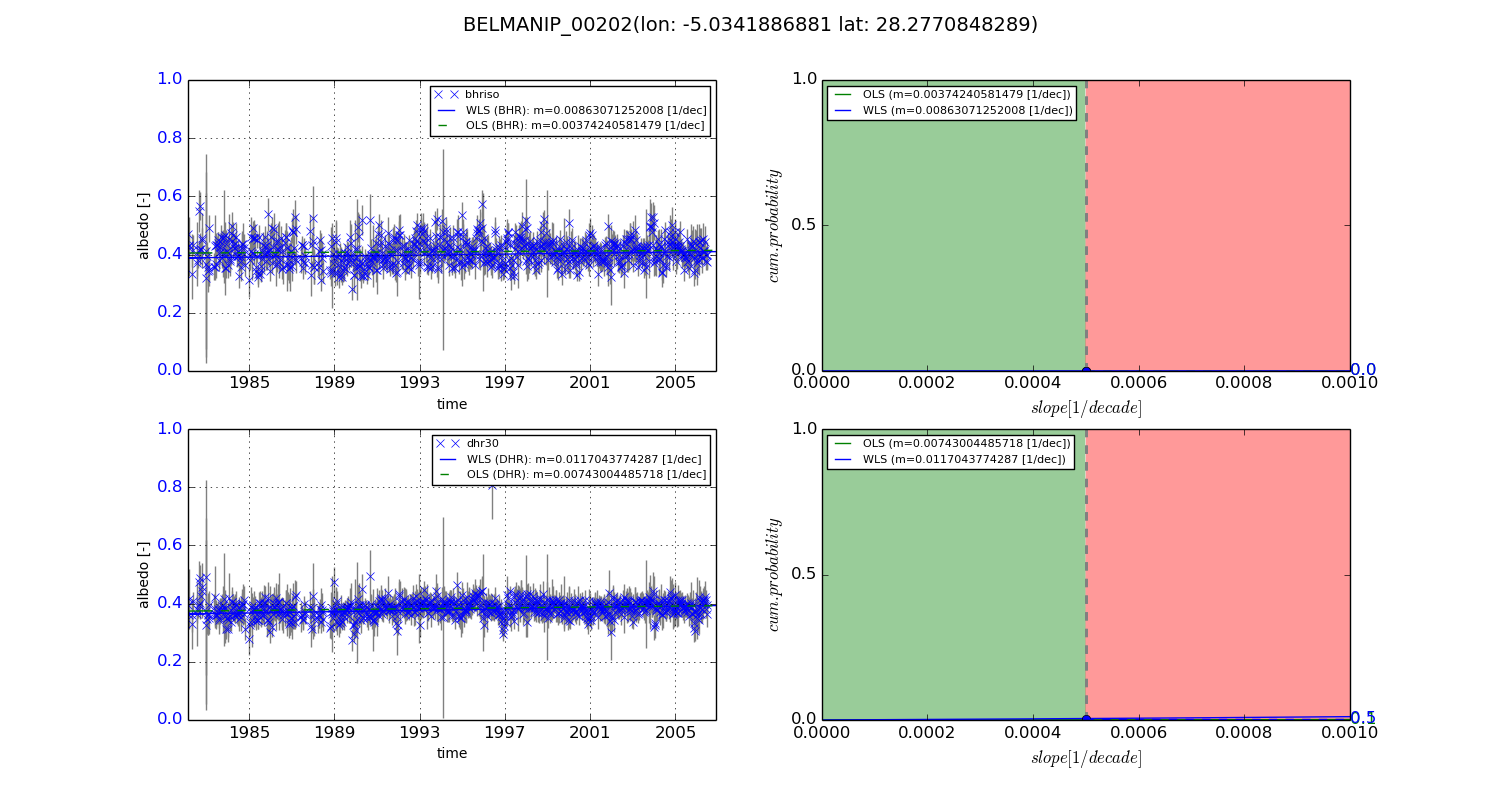
Temporal stability analysis

+000 deg (BHR)


BHR statistics

Temporal stability [1/decade]:


abs

rel


Weighted least square:

0.00863071252008


Ordinary least square:

0.00374240581479


Probabilities that GCOS criteria is met:

Weighted least square:

0.0 %

Ordinary least square:

0.0 %


DHR statistics

Temporal stability [1/decade]:


abs

rel


Weighted least square:

0.0117043774287


Ordinary least square:

0.00743004485718


Probabilities that GCOS criteria is met:

Weighted least square:

0.5 %

Ordinary least square:

0.1 %


+057/+063 deg (BHR)


BHR statistics

Temporal stability [1/decade]:


abs

rel


Weighted least square:

-99999.0


Ordinary least square:

-99999.0


Probabilities that GCOS criteria is met:

Weighted least square:

-99999.0 %

Ordinary least square:

-99999.0 %


DHR statistics

Temporal stability [1/decade]:


abs

rel


Weighted least square:

-99999.0


Ordinary least square:

-99999.0


Probabilities that GCOS criteria is met:

Weighted least square:

-99999.0 %

Ordinary least square:

-99999.0 %


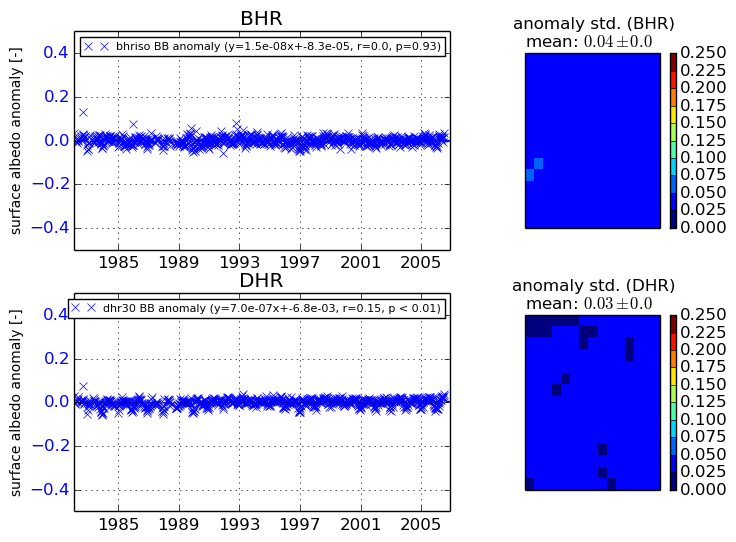
Temporal anomaly analyis

The variance of the temporal anomalies provides an additional measure about the stability of the signal AFTER removal of the mean seasonal cylce.
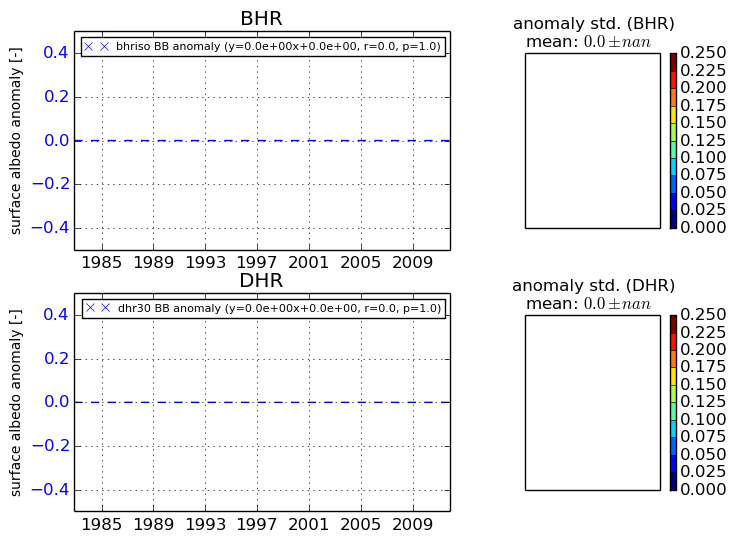
+000 deg


+057/+063 deg