BELMANIP_00203


Location

lon / lat [deg]: -13.7448 / 22.1242

Source network: BELMANIP


Geostationary surface albedo (GSA) data


“+000”


“+057/+063”


Landcover information (based on ESA CCI landcover data)


Landcover fractions @ 2km distance


Landcover fractions @ 20 km distance


Legend


Distance to open water bodies [km]:

62.1

Distance to urban areas [km]:

none in region


Radius: 1 km

Number of landcover classes:

1

Dominant landcover type:

200: bare areas

Fraction of dominant landcover type [%]:

100.0


Radius: 2 km

Number of landcover classes:

1

Dominant landcover type:

200: bare areas

Fraction of dominant landcover type [%]:

100.0


Radius: 5 km

Number of landcover classes:

1

Dominant landcover type:

200: bare areas

Fraction of dominant landcover type [%]:

100.0


Radius: 10 km

Number of landcover classes:

1

Dominant landcover type:

200: bare areas

Fraction of dominant landcover type [%]:

100.0


Radius: 20 km

Number of landcover classes:

1

Dominant landcover type:

200: bare areas

Fraction of dominant landcover type [%]:

100.0


Disturbances


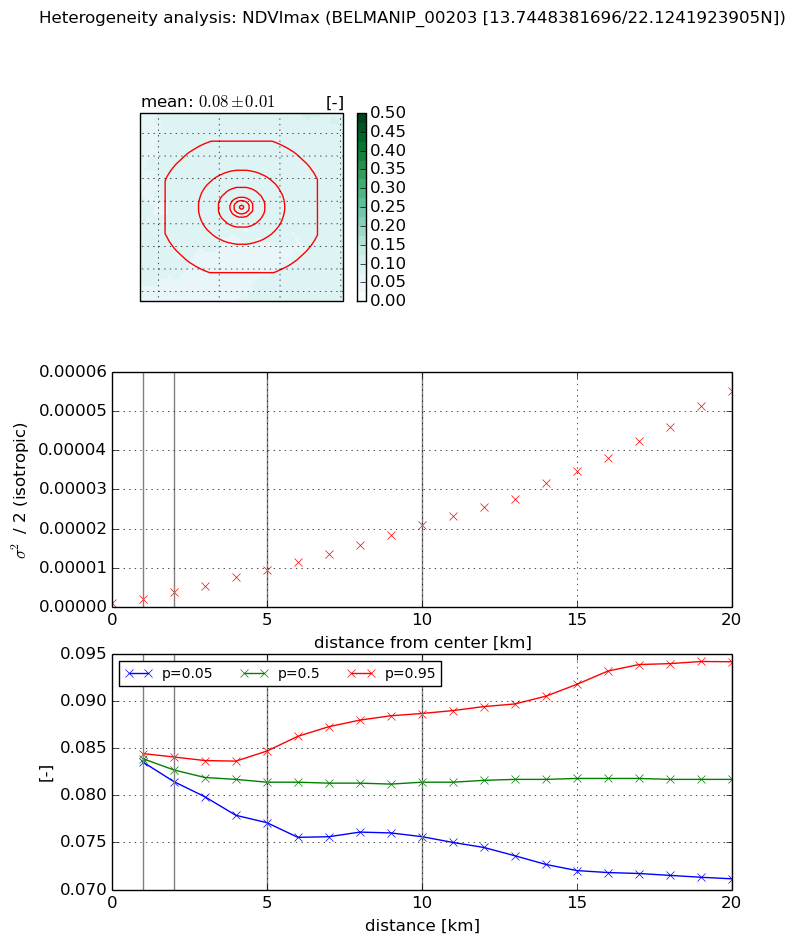
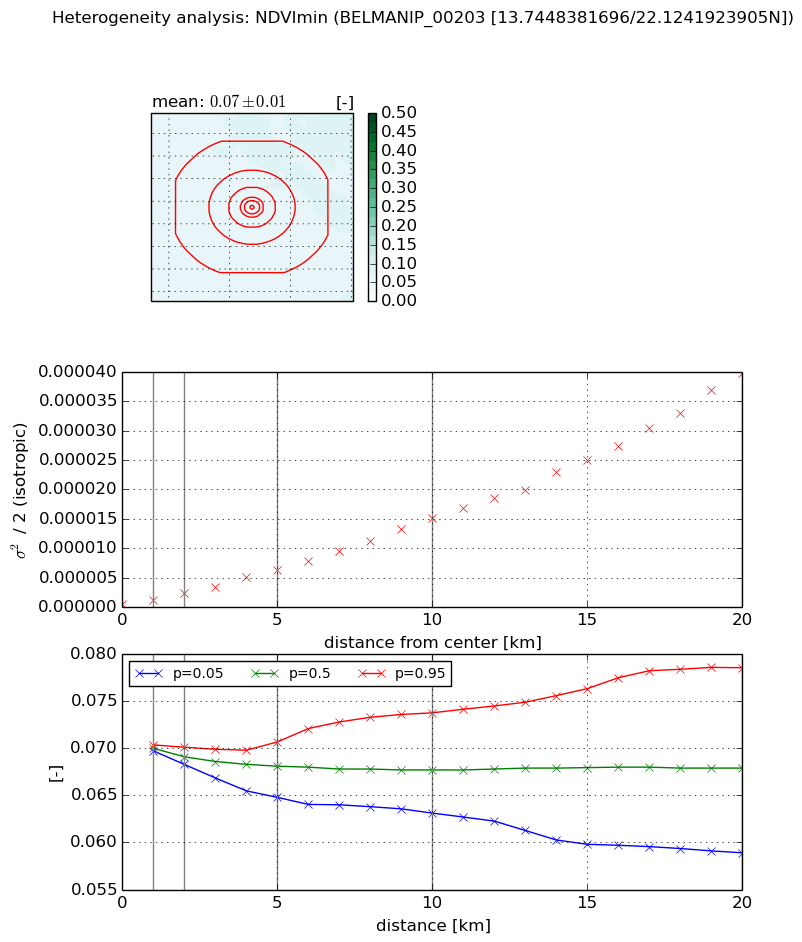
Heterogeneity analysis

The heterogeneity analysis provides information about the spatial and temporal heterogeneity of the site.

Topography


Roman et al. (2009) index


St

4.24141481564

Rcv

0.63583656065

Rse

0.0

Rst

-1.71629221304e-09

Rsv

-0.0714745897851


Height range @ 1km [m]

12

Height range @ 2km [m]

12

Height range @ 5km [m]

23

Height range @ 10km [m]

-999

Height range @ 20km [m]

-999


Variance slope @ 1 km

20

Variance slope @ 2 km

12

Variance slope @ 5 km

12

Variance slope @ 10 km

-999

Variance slope @ 20 km

-999


NDVI (max. NDVI composite)


Roman et al. (2009) index


St

1.30958797234

Rcv

0.877351852763

Rse

0.0

Rst

-0.413445333145

Rsv

-0.999999662684


NDVI range @ 1km [-]

0.0

NDVI range @ 2km [-]

0.0

NDVI range @ 5km [-]

0.01

NDVI range @ 10km [-]

0.01

NDVI range @ 20km [-]

0.02


Variance slope @ 1 km

9.96078944514e-07

Variance slope @ 2 km

1.42853810543e-06

Variance slope @ 5 km

1.72508177682e-06

Variance slope @ 10 km

1.99628094232e-06

Variance slope @ 20 km

2.64226364322e-06


NDVI (min. NDVI composite)I


Roman et al. (2009) index


St

1.29953387485

Rcv

0.877704376953

Rse

0.0

Rst

-0.431450535156

Rsv

-0.99936513347


NDVI range @ 1km [-]

0.0

NDVI range @ 2km [-]

0.0

NDVI range @ 5km [-]

0.01

NDVI range @ 10km [-]

0.01

NDVI range @ 20km [-]

0.02


NDVI slope @ 1 km

5.9882004781e-07

NDVI slope @ 2 km

8.95452700596e-07

NDVI slope @ 5 km

1.19134263096e-06

NDVI slope @ 10 km

1.47483734731e-06

NDVI slope @ 20 km

1.92928529072e-06


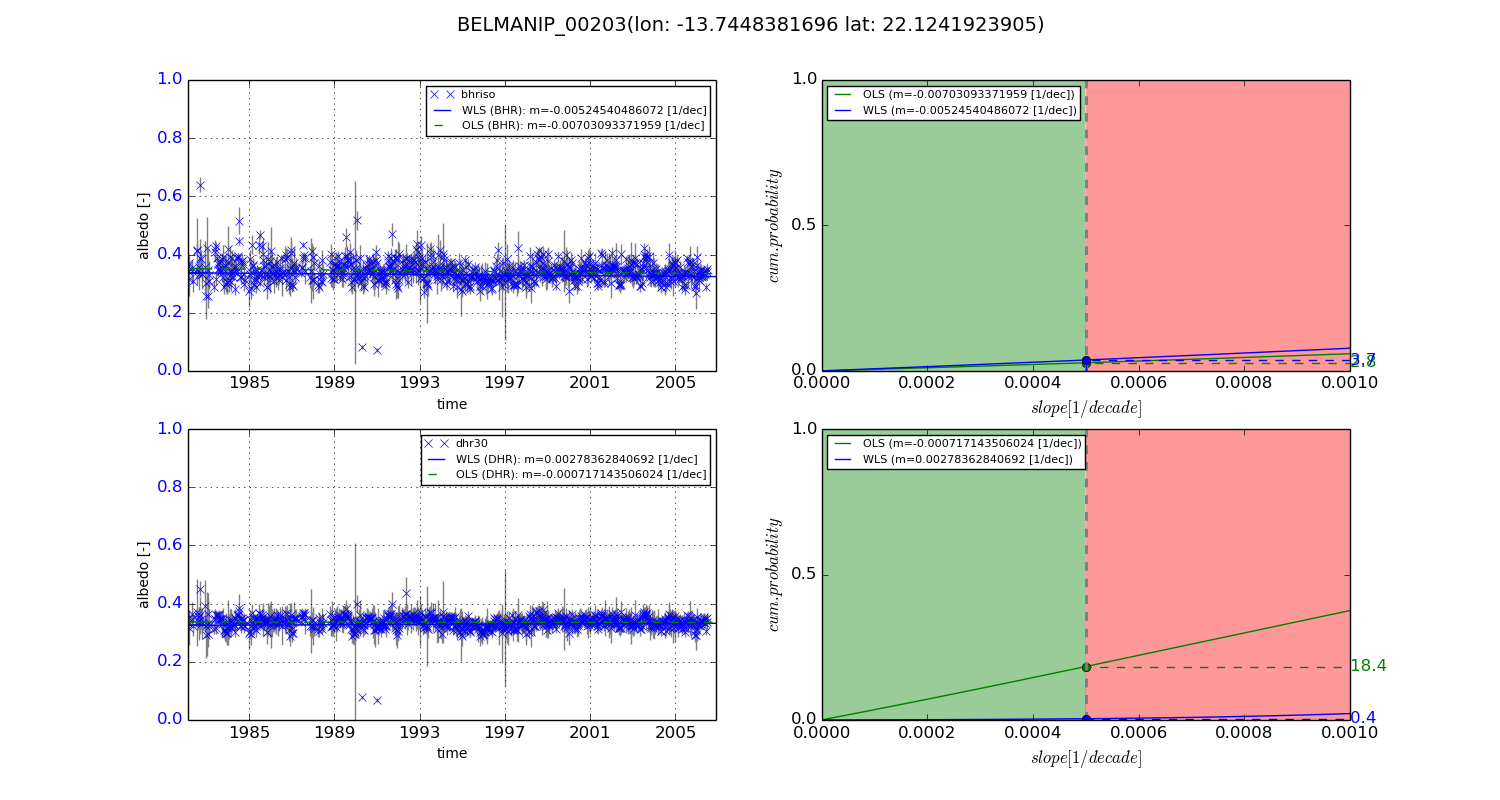
Temporal stability analysis

+000 deg (BHR)


BHR statistics

Temporal stability [1/decade]:


abs

rel


Weighted least square:

-0.00524540486072


Ordinary least square:

-0.00703093371959


Probabilities that GCOS criteria is met:

Weighted least square:

3.7 %

Ordinary least square:

2.8 %


DHR statistics

Temporal stability [1/decade]:


abs

rel


Weighted least square:

0.00278362840692


Ordinary least square:

-0.000717143506024


Probabilities that GCOS criteria is met:

Weighted least square:

0.4 %

Ordinary least square:

18.4 %


+057/+063 deg (BHR)


BHR statistics

Temporal stability [1/decade]:


abs

rel


Weighted least square:

-99999.0


Ordinary least square:

-99999.0


Probabilities that GCOS criteria is met:

Weighted least square:

-99999.0 %

Ordinary least square:

-99999.0 %


DHR statistics

Temporal stability [1/decade]:


abs

rel


Weighted least square:

-99999.0


Ordinary least square:

-99999.0


Probabilities that GCOS criteria is met:

Weighted least square:

-99999.0 %

Ordinary least square:

-99999.0 %


Temporal anomaly analyis

The variance of the temporal anomalies provides an additional measure about the stability of the signal AFTER removal of the mean seasonal cylce.
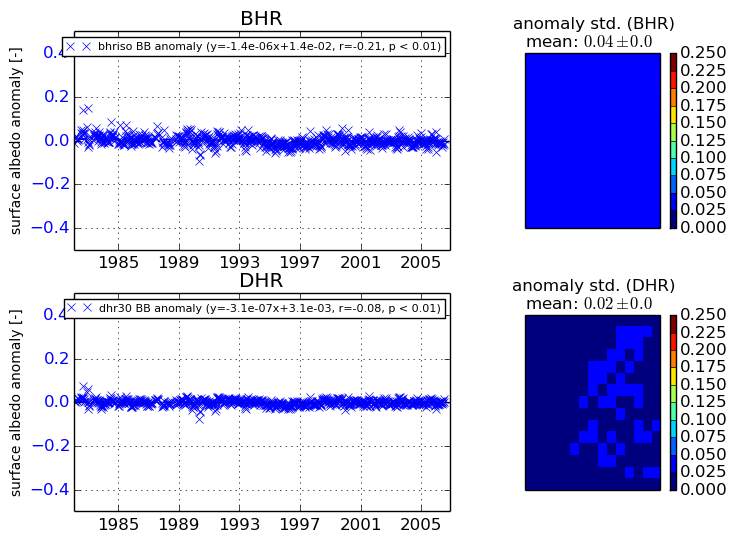
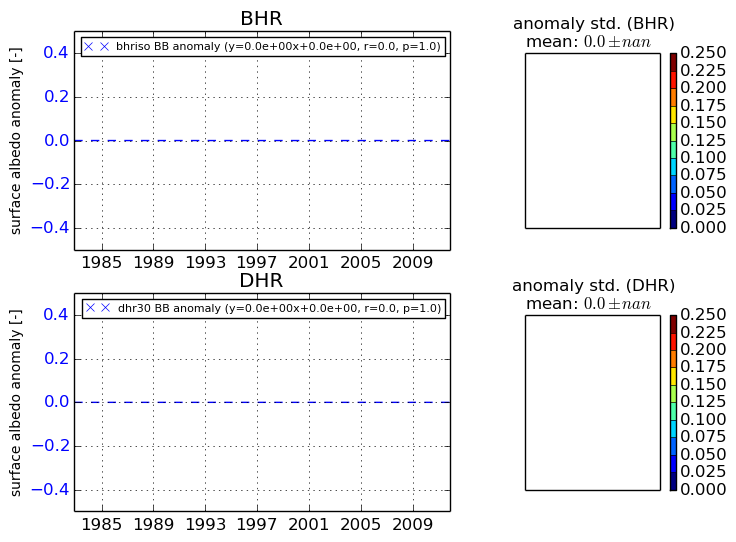
+000 deg


+057/+063 deg