BELMANIP_00204


Location

lon / lat [deg]: 8.919 / 23.1301

Source network: BELMANIP


Geostationary surface albedo (GSA) data


“+000”


“+057/+063”


Landcover information (based on ESA CCI landcover data)


Landcover fractions @ 2km distance


Landcover fractions @ 20 km distance


Legend


Distance to open water bodies [km]:

none in region

Distance to urban areas [km]:

none in region


Radius: 1 km

Number of landcover classes:

1

Dominant landcover type:

200: bare areas

Fraction of dominant landcover type [%]:

100.0


Radius: 2 km

Number of landcover classes:

1

Dominant landcover type:

200: bare areas

Fraction of dominant landcover type [%]:

100.0


Radius: 5 km

Number of landcover classes:

1

Dominant landcover type:

200: bare areas

Fraction of dominant landcover type [%]:

100.0


Radius: 10 km

Number of landcover classes:

1

Dominant landcover type:

200: bare areas

Fraction of dominant landcover type [%]:

100.0


Radius: 20 km

Number of landcover classes:

1

Dominant landcover type:

200: bare areas

Fraction of dominant landcover type [%]:

100.0


Disturbances


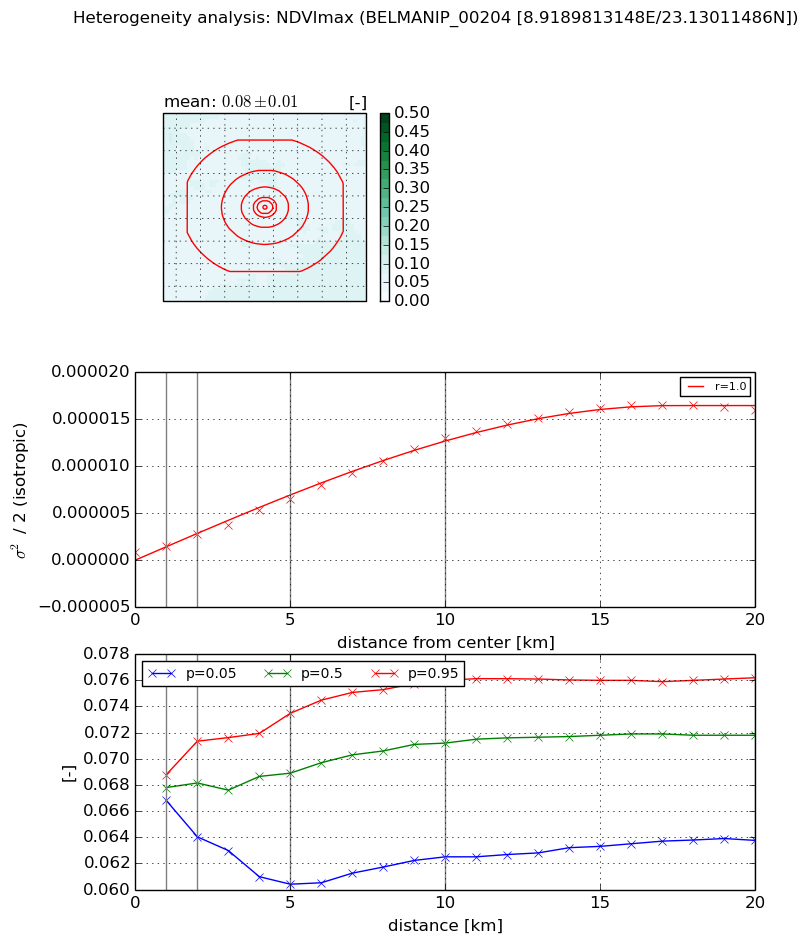
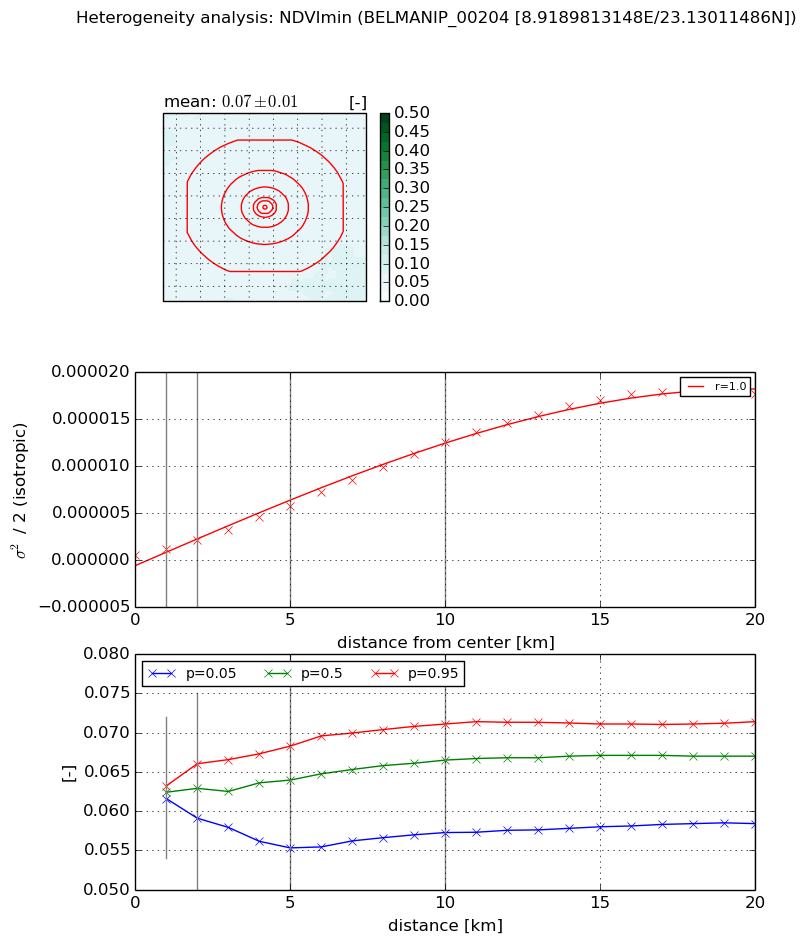
Heterogeneity analysis

The heterogeneity analysis provides information about the spatial and temporal heterogeneity of the site.

Topography


Roman et al. (2009) index


St

2.9288522576

Rcv

0.318303881571

Rse

0.0

Rst

-3.40151462737e-05

Rsv

-0.705954124915


Height range @ 1km [m]

16

Height range @ 2km [m]

29

Height range @ 5km [m]

47

Height range @ 10km [m]

-999

Height range @ 20km [m]

-999


Variance slope @ 1 km

32

Variance slope @ 2 km

33

Variance slope @ 5 km

46

Variance slope @ 10 km

-999

Variance slope @ 20 km

-999


NDVI (max. NDVI composite)


Roman et al. (2009) index


St

2.38351097559

Rcv

0.382601241985

Rse

0.0

Rst

-0.0490236483168

Rsv

0.827022554885


NDVI range @ 1km [-]

0.0

NDVI range @ 2km [-]

0.01

NDVI range @ 5km [-]

0.01

NDVI range @ 10km [-]

0.01

NDVI range @ 20km [-]

0.01


Variance slope @ 1 km

7.09770276132e-07

Variance slope @ 2 km

9.57547178973e-07

Variance slope @ 5 km

1.15928735154e-06

Variance slope @ 10 km

1.26316867135e-06

Variance slope @ 20 km

8.53288363857e-07


NDVI (min. NDVI composite)I


Roman et al. (2009) index


St

2.61600758787

Rcv

0.389552060801

Rse

0.0

Rst

-0.097177585712

Rsv

0.660056017988


NDVI range @ 1km [-]

0.0

NDVI range @ 2km [-]

0.01

NDVI range @ 5km [-]

0.01

NDVI range @ 10km [-]

0.01

NDVI range @ 20km [-]

0.01


NDVI slope @ 1 km

5.51542510201e-07

NDVI slope @ 2 km

7.93995665752e-07

NDVI slope @ 5 km

1.06498656227e-06

NDVI slope @ 10 km

1.24894890802e-06

NDVI slope @ 20 km

9.79676024161e-07


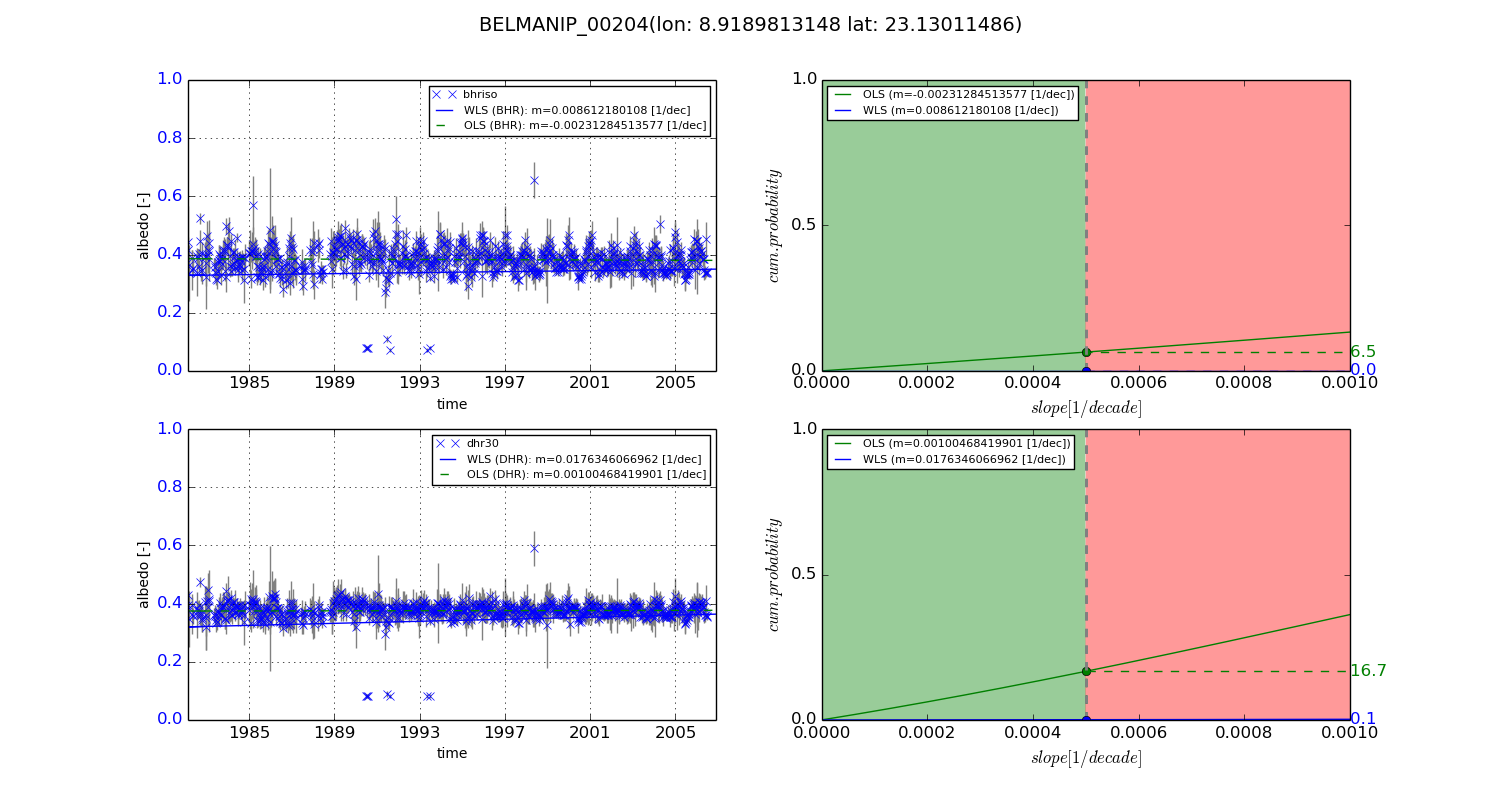
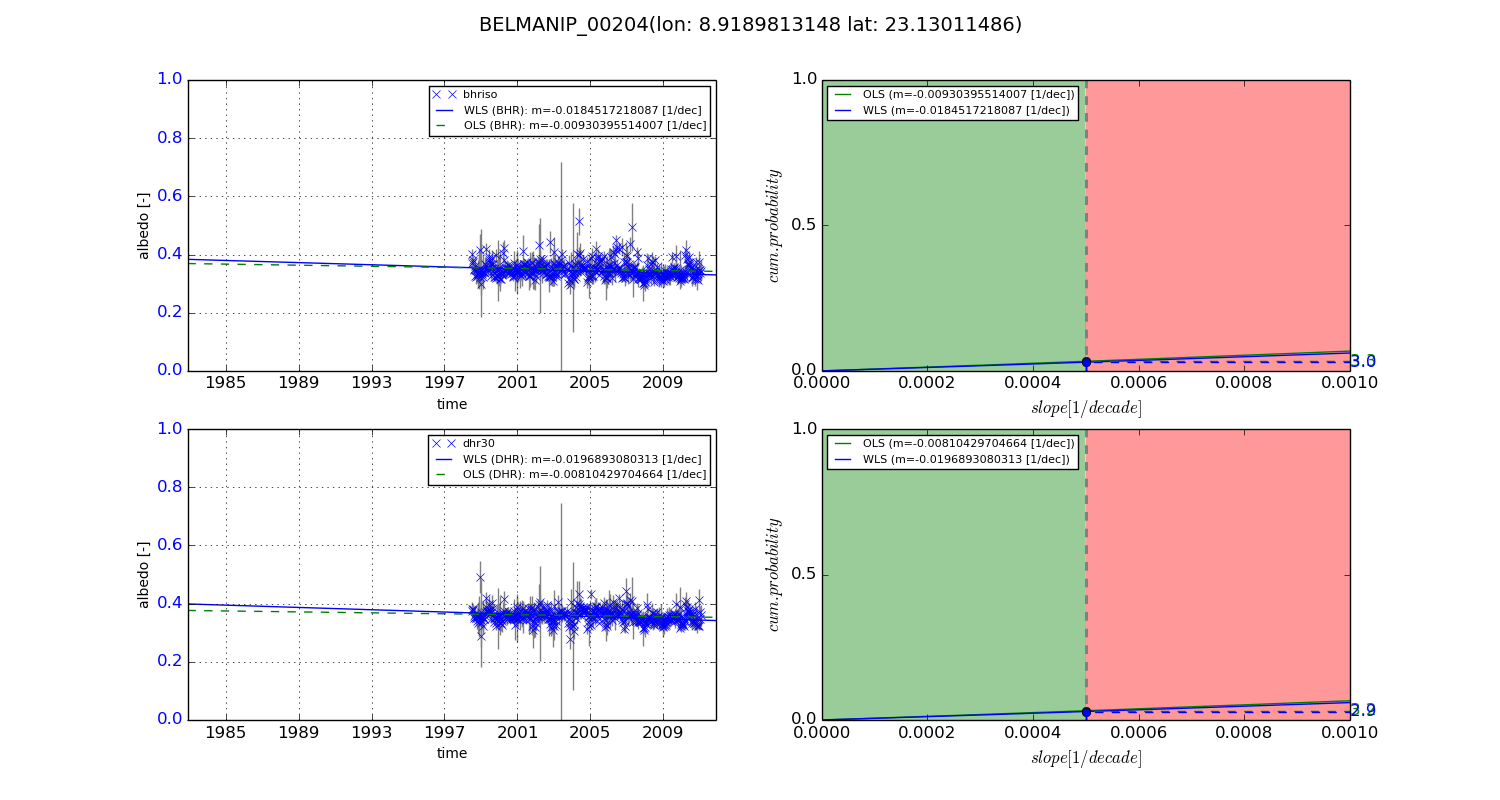
Temporal stability analysis

+000 deg (BHR)


BHR statistics

Temporal stability [1/decade]:


abs

rel


Weighted least square:

0.008612180108


Ordinary least square:

-0.00231284513577


Probabilities that GCOS criteria is met:

Weighted least square:

0.0 %

Ordinary least square:

6.5 %


DHR statistics

Temporal stability [1/decade]:


abs

rel


Weighted least square:

0.0176346066962


Ordinary least square:

0.00100468419901


Probabilities that GCOS criteria is met:

Weighted least square:

0.1 %

Ordinary least square:

16.7 %


+057/+063 deg (BHR)


BHR statistics

Temporal stability [1/decade]:


abs

rel


Weighted least square:

-0.0184517218087


Ordinary least square:

-0.00930395514007


Probabilities that GCOS criteria is met:

Weighted least square:

3.0 %

Ordinary least square:

3.3 %


DHR statistics

Temporal stability [1/decade]:


abs

rel


Weighted least square:

-0.0196893080313


Ordinary least square:

-0.00810429704664


Probabilities that GCOS criteria is met:

Weighted least square:

2.9 %

Ordinary least square:

3.2 %


Temporal anomaly analyis

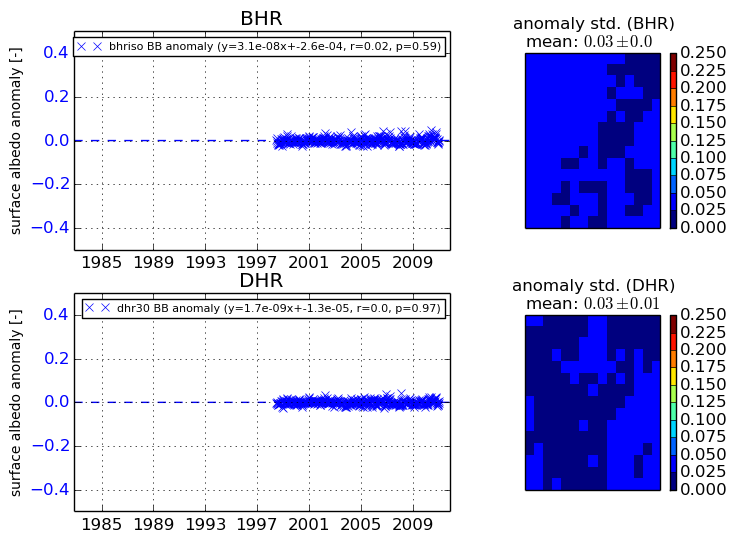
The variance of the temporal anomalies provides an additional measure about the stability of the signal AFTER removal of the mean seasonal cylce.
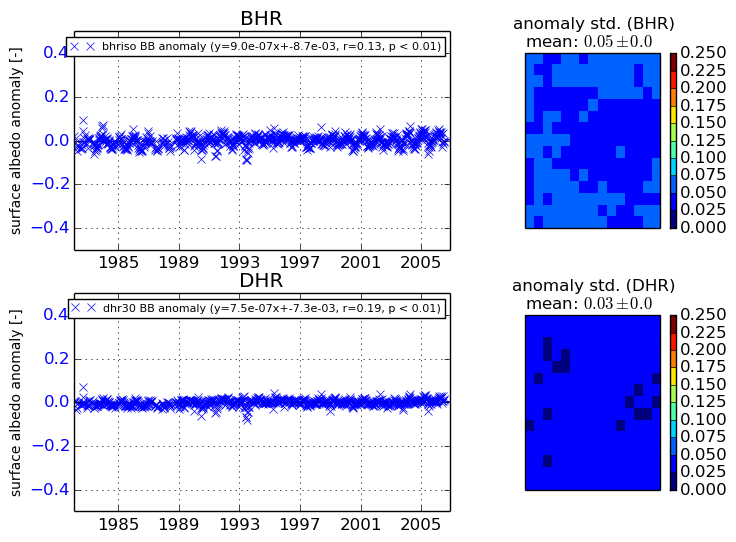
+000 deg


+057/+063 deg