BELMANIP_00205


Location

lon / lat [deg]: 14.7261 / 28.3944

Source network: BELMANIP


Geostationary surface albedo (GSA) data


“+000”


“+057/+063”


Landcover information (based on ESA CCI landcover data)


Landcover fractions @ 2km distance


Landcover fractions @ 20 km distance


Legend


Distance to open water bodies [km]:

none in region

Distance to urban areas [km]:

12.82


Radius: 1 km

Number of landcover classes:

1

Dominant landcover type:

200: bare areas

Fraction of dominant landcover type [%]:

100.0


Radius: 2 km

Number of landcover classes:

1

Dominant landcover type:

200: bare areas

Fraction of dominant landcover type [%]:

100.0


Radius: 5 km

Number of landcover classes:

1

Dominant landcover type:

200: bare areas

Fraction of dominant landcover type [%]:

100.0


Radius: 10 km

Number of landcover classes:

1

Dominant landcover type:

200: bare areas

Fraction of dominant landcover type [%]:

100.0


Radius: 20 km

Number of landcover classes:

1

Dominant landcover type:

200: bare areas

Fraction of dominant landcover type [%]:

100.0


Disturbances


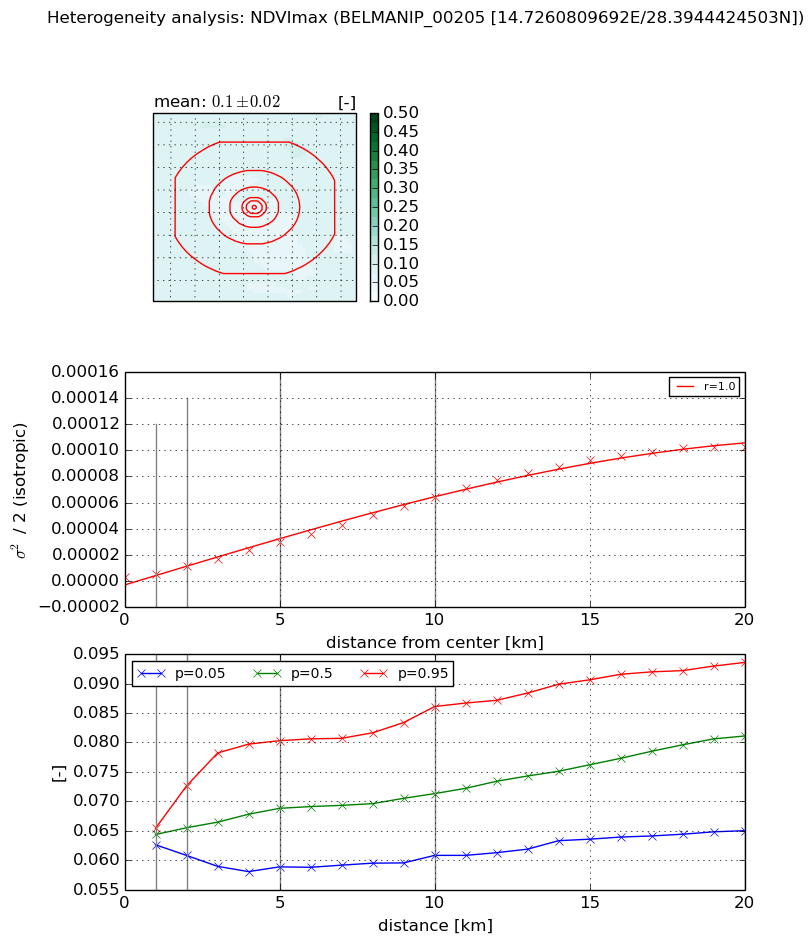
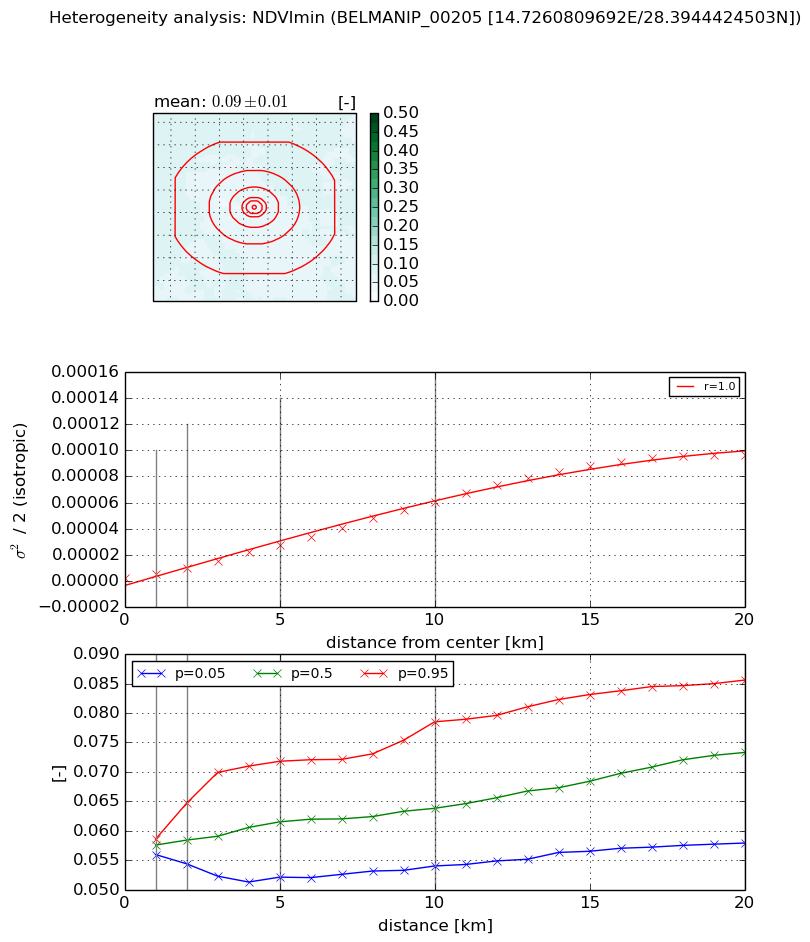
Heterogeneity analysis

The heterogeneity analysis provides information about the spatial and temporal heterogeneity of the site.

Topography


Roman et al. (2009) index


St

2.56080657372

Rcv

0.171845716155

Rse

0.0

Rst

-1.1313497923e-05

Rsv

-0.999648866493


Height range @ 1km [m]

10

Height range @ 2km [m]

25

Height range @ 5km [m]

54

Height range @ 10km [m]

-999

Height range @ 20km [m]

-999


Variance slope @ 1 km

73

Variance slope @ 2 km

65

Variance slope @ 5 km

59

Variance slope @ 10 km

-999

Variance slope @ 20 km

-999


NDVI (max. NDVI composite)


Roman et al. (2009) index


St

5.20480178386

Rcv

0.129217239317

Rse

0.0

Rst

-0.086936538092

Rsv

0.360237048713


NDVI range @ 1km [-]

0.0

NDVI range @ 2km [-]

0.01

NDVI range @ 5km [-]

0.02

NDVI range @ 10km [-]

0.03

NDVI range @ 20km [-]

0.03


Variance slope @ 1 km

2.77744762223e-06

Variance slope @ 2 km

4.2364170868e-06

Variance slope @ 5 km

5.54960228388e-06

Variance slope @ 10 km

6.31720054265e-06

Variance slope @ 20 km

5.58461580162e-06


NDVI (min. NDVI composite)I


Roman et al. (2009) index


St

4.26125594238

Rcv

0.153967631546

Rse

0.0

Rst

-0.0882152203413

Rsv

0.461834940183


NDVI range @ 1km [-]

0.0

NDVI range @ 2km [-]

0.01

NDVI range @ 5km [-]

0.02

NDVI range @ 10km [-]

0.02

NDVI range @ 20km [-]

0.03


NDVI slope @ 1 km

2.51724614489e-06

NDVI slope @ 2 km

3.8818438848e-06

NDVI slope @ 5 km

5.18567404864e-06

NDVI slope @ 10 km

6.02494265671e-06

NDVI slope @ 20 km

5.30178059295e-06


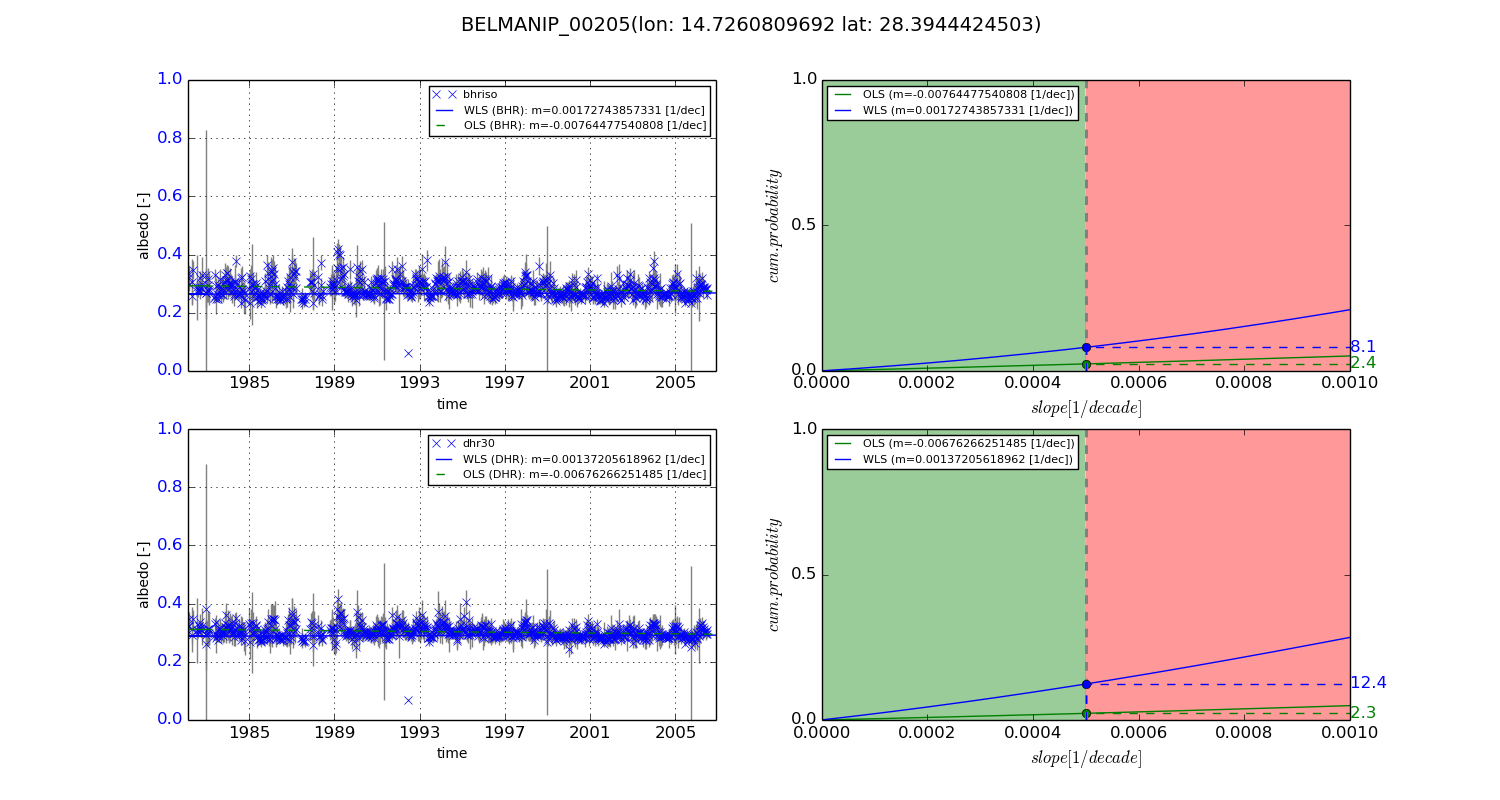
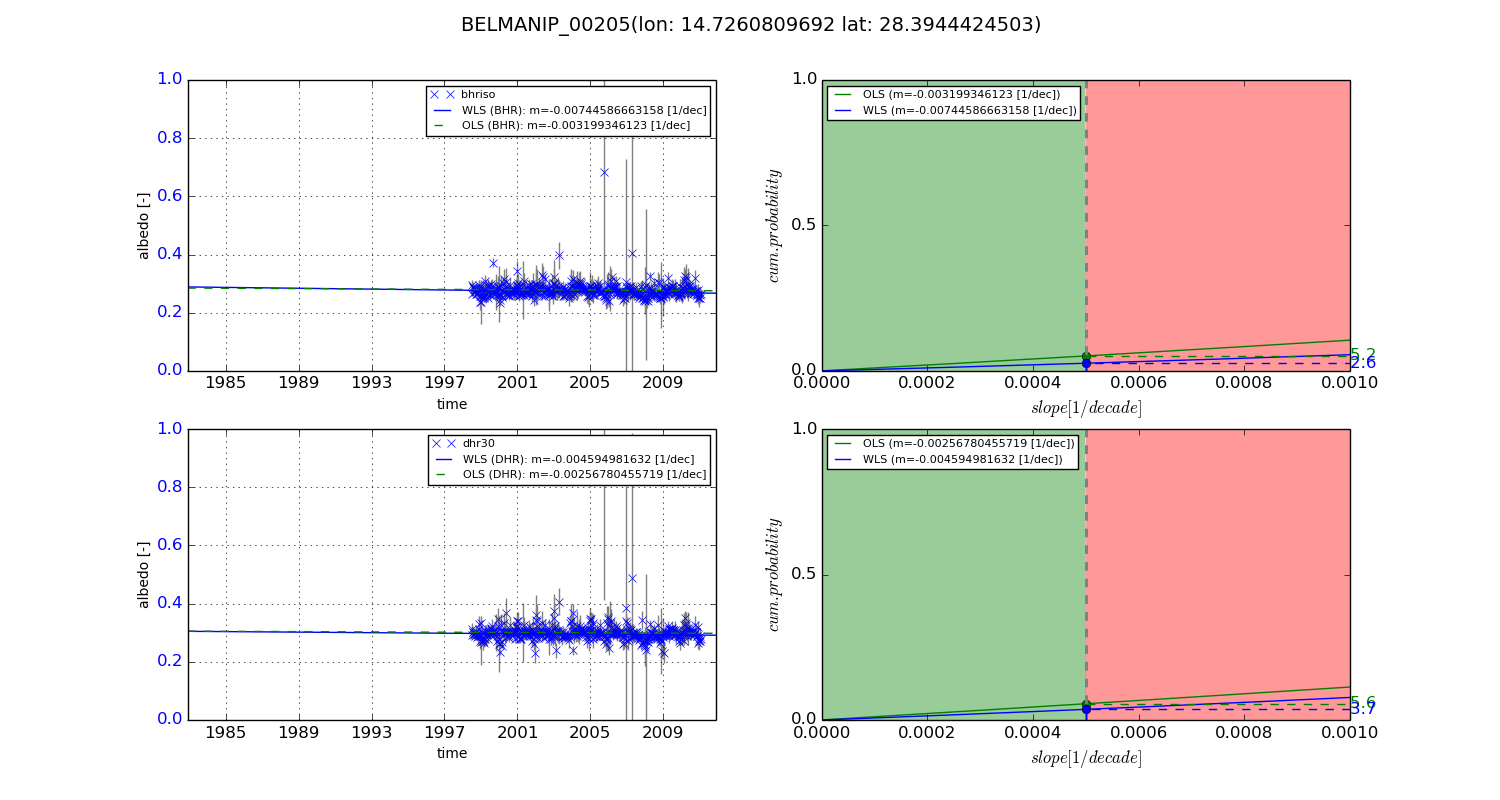
Temporal stability analysis

+000 deg (BHR)


BHR statistics

Temporal stability [1/decade]:


abs

rel


Weighted least square:

0.00172743857331


Ordinary least square:

-0.00764477540808


Probabilities that GCOS criteria is met:

Weighted least square:

8.1 %

Ordinary least square:

2.4 %


DHR statistics

Temporal stability [1/decade]:


abs

rel


Weighted least square:

0.00137205618962


Ordinary least square:

-0.00676266251485


Probabilities that GCOS criteria is met:

Weighted least square:

12.4 %

Ordinary least square:

2.3 %


+057/+063 deg (BHR)


BHR statistics

Temporal stability [1/decade]:


abs

rel


Weighted least square:

-0.00744586663158


Ordinary least square:

-0.003199346123


Probabilities that GCOS criteria is met:

Weighted least square:

2.6 %

Ordinary least square:

5.2 %


DHR statistics

Temporal stability [1/decade]:


abs

rel


Weighted least square:

-0.004594981632


Ordinary least square:

-0.00256780455719


Probabilities that GCOS criteria is met:

Weighted least square:

3.7 %

Ordinary least square:

5.6 %


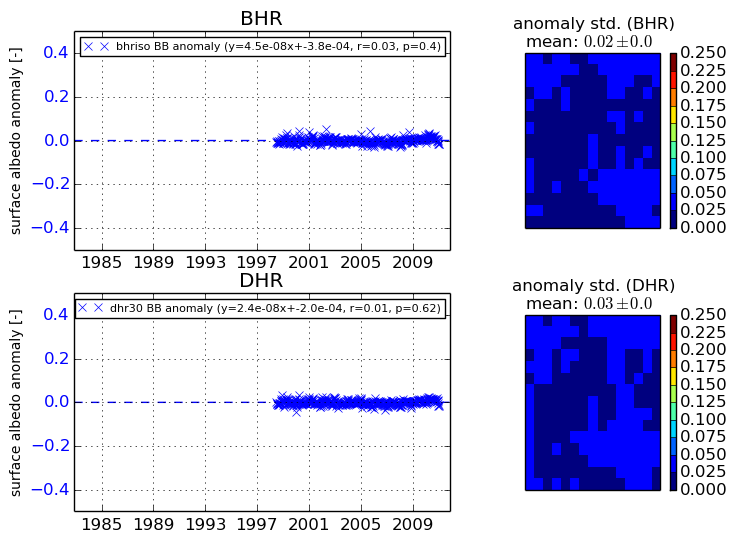
Temporal anomaly analyis

The variance of the temporal anomalies provides an additional measure about the stability of the signal AFTER removal of the mean seasonal cylce.
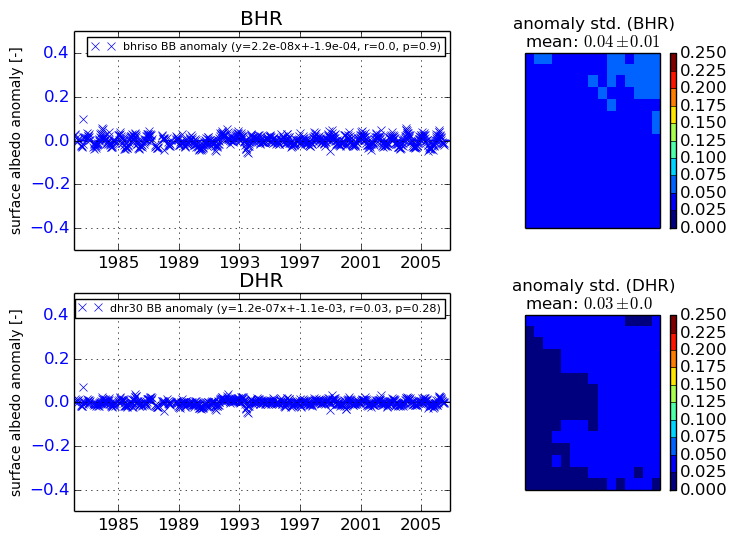
+000 deg


+057/+063 deg