BELMANIP_00207


Location

lon / lat [deg]: 28.8718 / 27.87

Source network: BELMANIP


Geostationary surface albedo (GSA) data


“+000”


“+057/+063”


Landcover information (based on ESA CCI landcover data)


Landcover fractions @ 2km distance


Landcover fractions @ 20 km distance


Legend


Distance to open water bodies [km]:

22.29

Distance to urban areas [km]:

52.75


Radius: 1 km

Number of landcover classes:

1

Dominant landcover type:

200: bare areas

Fraction of dominant landcover type [%]:

100.0


Radius: 2 km

Number of landcover classes:

1

Dominant landcover type:

200: bare areas

Fraction of dominant landcover type [%]:

100.0


Radius: 5 km

Number of landcover classes:

1

Dominant landcover type:

200: bare areas

Fraction of dominant landcover type [%]:

100.0


Radius: 10 km

Number of landcover classes:

1

Dominant landcover type:

200: bare areas

Fraction of dominant landcover type [%]:

100.0


Radius: 20 km

Number of landcover classes:

1

Dominant landcover type:

200: bare areas

Fraction of dominant landcover type [%]:

100.0


Disturbances


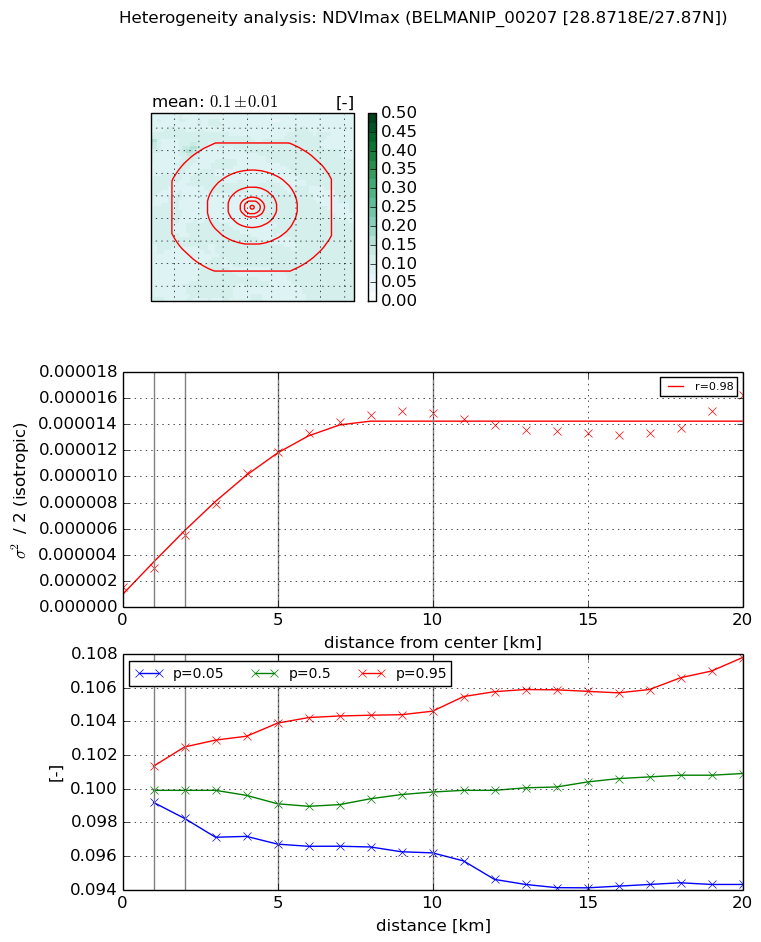
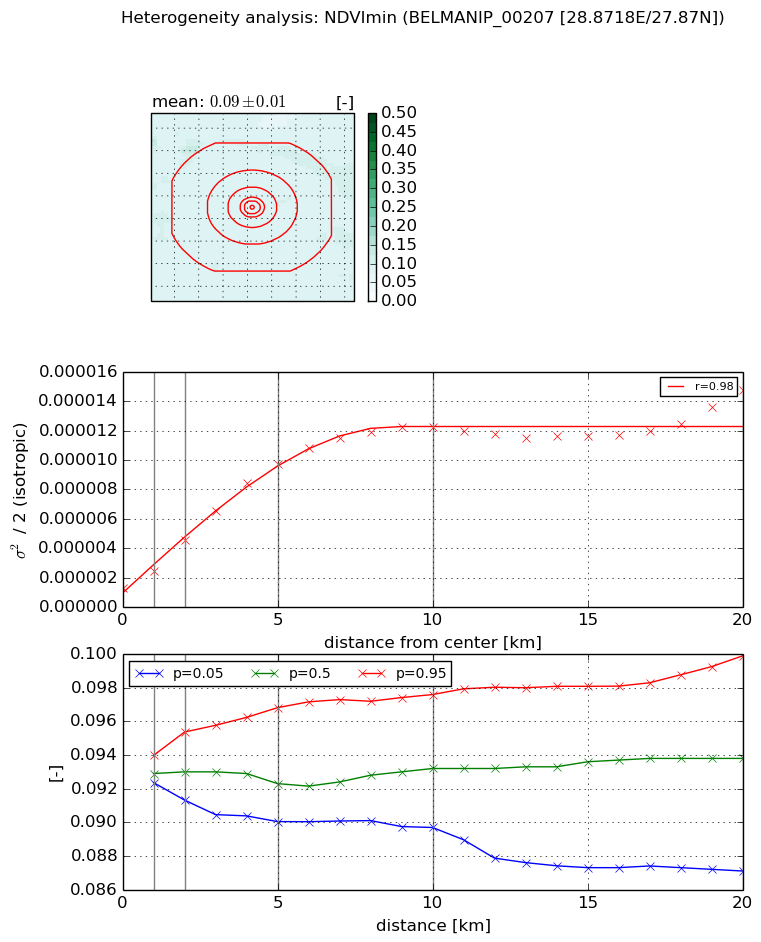
Heterogeneity analysis

The heterogeneity analysis provides information about the spatial and temporal heterogeneity of the site.

Topography


Roman et al. (2009) index


St

5.94031130469

Rcv

-0.0754697937124

Rse

0.0

Rst

-0.0688199762967

Rsv

0.360734267642


Height range @ 1km [m]

17

Height range @ 2km [m]

29

Height range @ 5km [m]

27

Height range @ 10km [m]

-999

Height range @ 20km [m]

-999


Variance slope @ 1 km

27

Variance slope @ 2 km

26

Variance slope @ 5 km

15

Variance slope @ 10 km

-999

Variance slope @ 20 km

-999


NDVI (max. NDVI composite)


Roman et al. (2009) index


St

0.408033388186

Rcv

0.290295347782

Rse

0.0

Rst

1.29974732182e-08

Rsv

7.06204414589


NDVI range @ 1km [-]

0.0

NDVI range @ 2km [-]

0.0

NDVI range @ 5km [-]

0.01

NDVI range @ 10km [-]

0.01

NDVI range @ 20km [-]

0.01


Variance slope @ 1 km

1.44110991949e-06

Variance slope @ 2 km

1.97186568409e-06

Variance slope @ 5 km

2.16559687422e-06

Variance slope @ 10 km

1.4319855874e-06

Variance slope @ 20 km

4.93731385574e-07


NDVI (min. NDVI composite)I


Roman et al. (2009) index


St

3.20278812239

Rcv

0.295539870163

Rse

0.0

Rst

-5.32159550907e-08

Rsv

-0.641143954968


NDVI range @ 1km [-]

0.0

NDVI range @ 2km [-]

0.0

NDVI range @ 5km [-]

0.01

NDVI range @ 10km [-]

0.01

NDVI range @ 20km [-]

0.01


NDVI slope @ 1 km

1.19135856633e-06

NDVI slope @ 2 km

1.63814725206e-06

NDVI slope @ 5 km

1.77130545787e-06

NDVI slope @ 10 km

1.16659377073e-06

NDVI slope @ 20 km

4.77720727596e-07


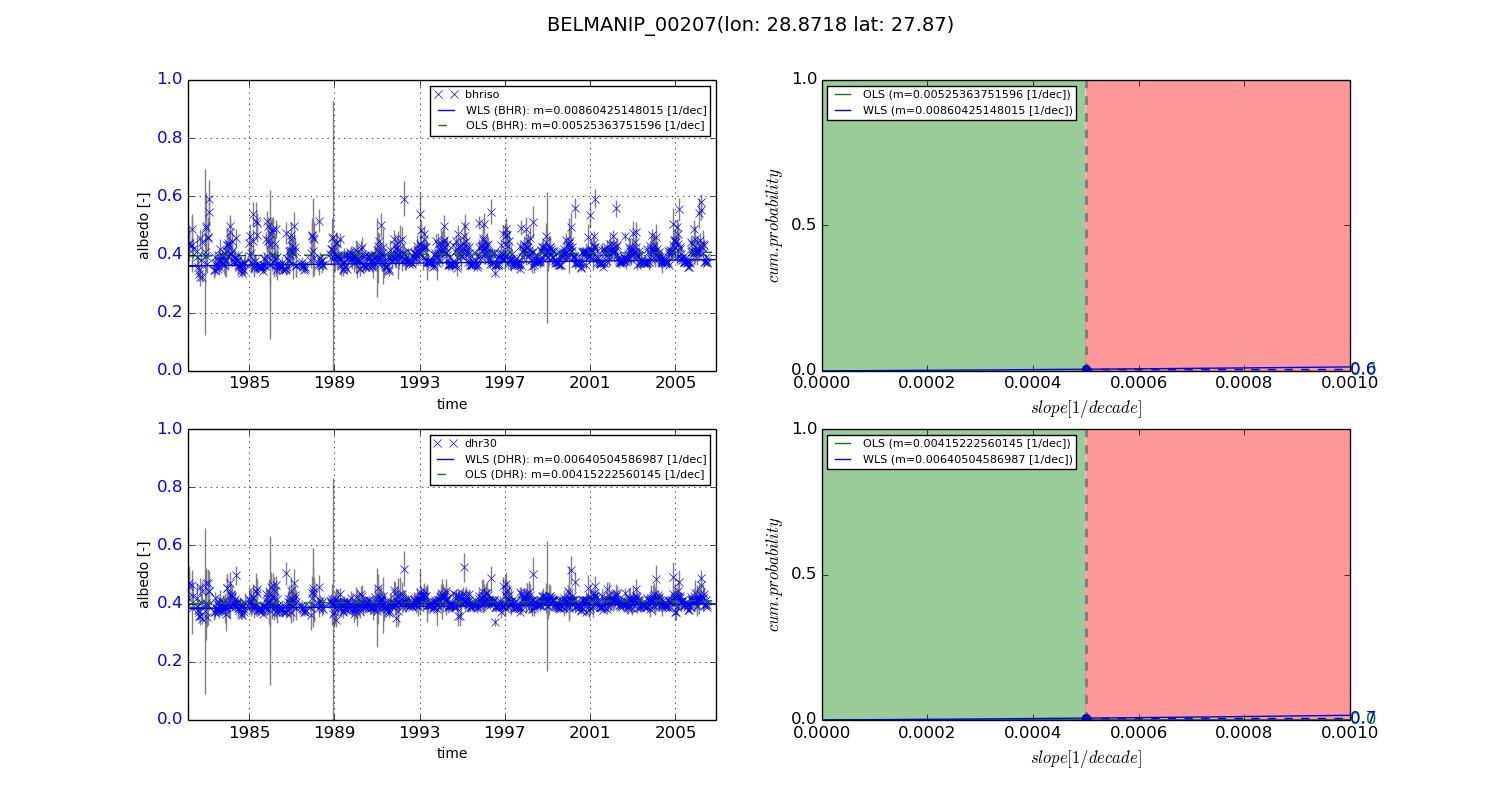
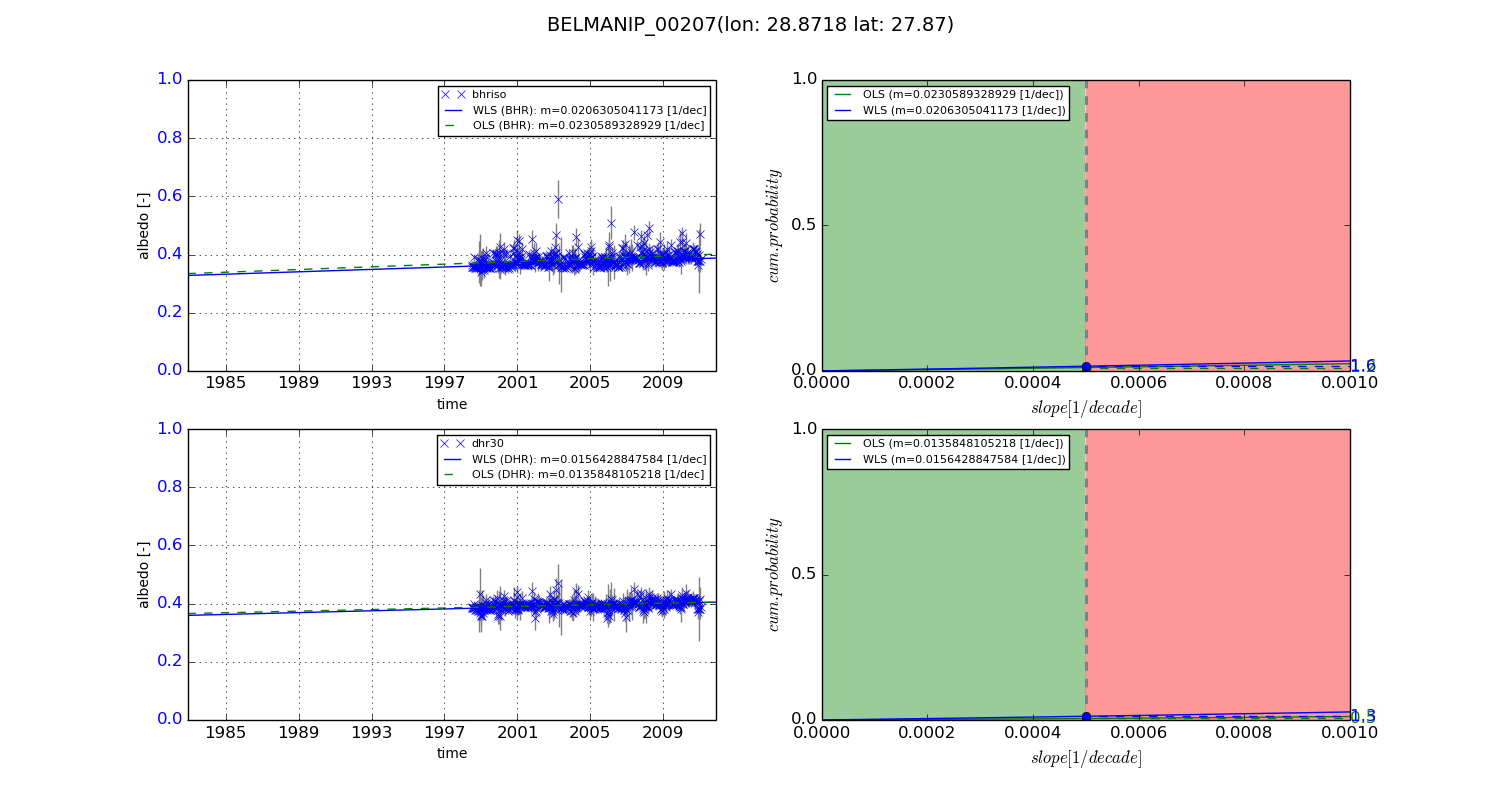
Temporal stability analysis

+000 deg (BHR)


BHR statistics

Temporal stability [1/decade]:


abs

rel


Weighted least square:

0.00860425148015


Ordinary least square:

0.00525363751596


Probabilities that GCOS criteria is met:

Weighted least square:

0.6 %

Ordinary least square:

0.0 %


DHR statistics

Temporal stability [1/decade]:


abs

rel


Weighted least square:

0.00640504586987


Ordinary least square:

0.00415222560145


Probabilities that GCOS criteria is met:

Weighted least square:

0.7 %

Ordinary least square:

0.0 %


+057/+063 deg (BHR)


BHR statistics

Temporal stability [1/decade]:


abs

rel


Weighted least square:

0.0206305041173


Ordinary least square:

0.0230589328929


Probabilities that GCOS criteria is met:

Weighted least square:

1.6 %

Ordinary least square:

1.2 %


DHR statistics

Temporal stability [1/decade]:


abs

rel


Weighted least square:

0.0156428847584


Ordinary least square:

0.0135848105218


Probabilities that GCOS criteria is met:

Weighted least square:

1.3 %

Ordinary least square:

0.5 %


Temporal anomaly analyis

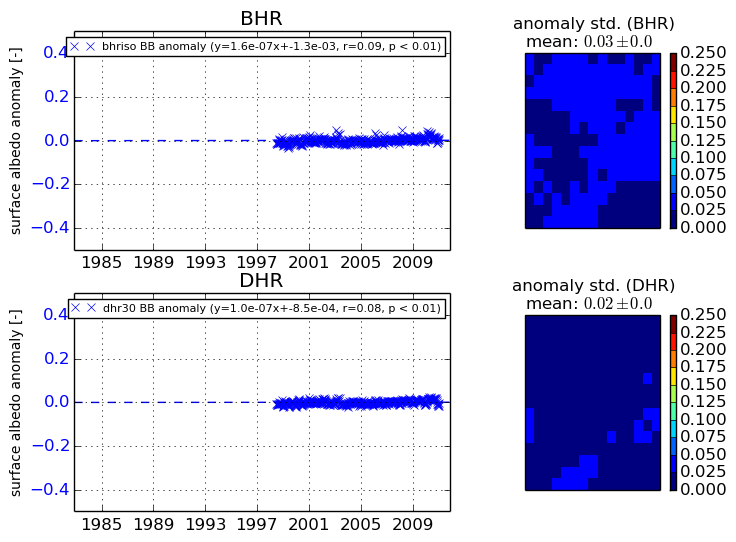
The variance of the temporal anomalies provides an additional measure about the stability of the signal AFTER removal of the mean seasonal cylce.
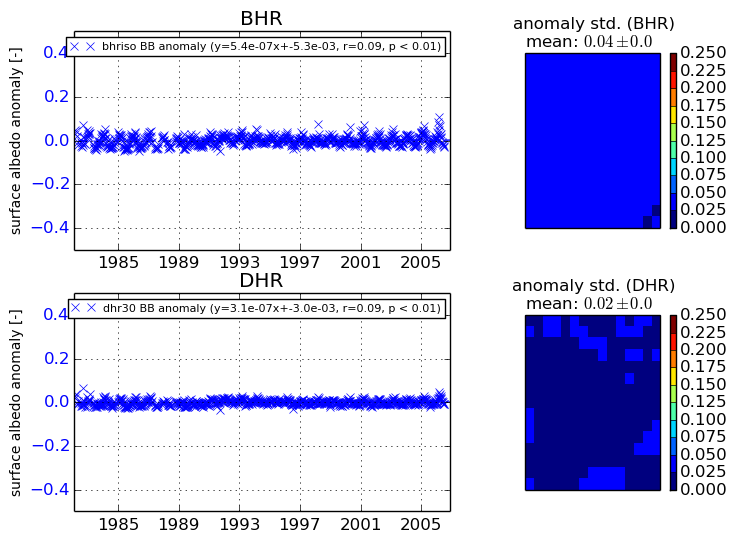
+000 deg


+057/+063 deg