BELMANIP_00209


Location

lon / lat [deg]: 33.7605 / 21.0344

Source network: BELMANIP


Geostationary surface albedo (GSA) data


“+000”


“+057/+063”


Landcover information (based on ESA CCI landcover data)


Landcover fractions @ 2km distance


Landcover fractions @ 20 km distance


Legend


Distance to open water bodies [km]:

none in region

Distance to urban areas [km]:

none in region


Radius: 1 km

Number of landcover classes:

1

Dominant landcover type:

200: bare areas

Fraction of dominant landcover type [%]:

100.0


Radius: 2 km

Number of landcover classes:

1

Dominant landcover type:

200: bare areas

Fraction of dominant landcover type [%]:

100.0


Radius: 5 km

Number of landcover classes:

1

Dominant landcover type:

200: bare areas

Fraction of dominant landcover type [%]:

100.0


Radius: 10 km

Number of landcover classes:

1

Dominant landcover type:

200: bare areas

Fraction of dominant landcover type [%]:

100.0


Radius: 20 km

Number of landcover classes:

1

Dominant landcover type:

200: bare areas

Fraction of dominant landcover type [%]:

100.0


Disturbances


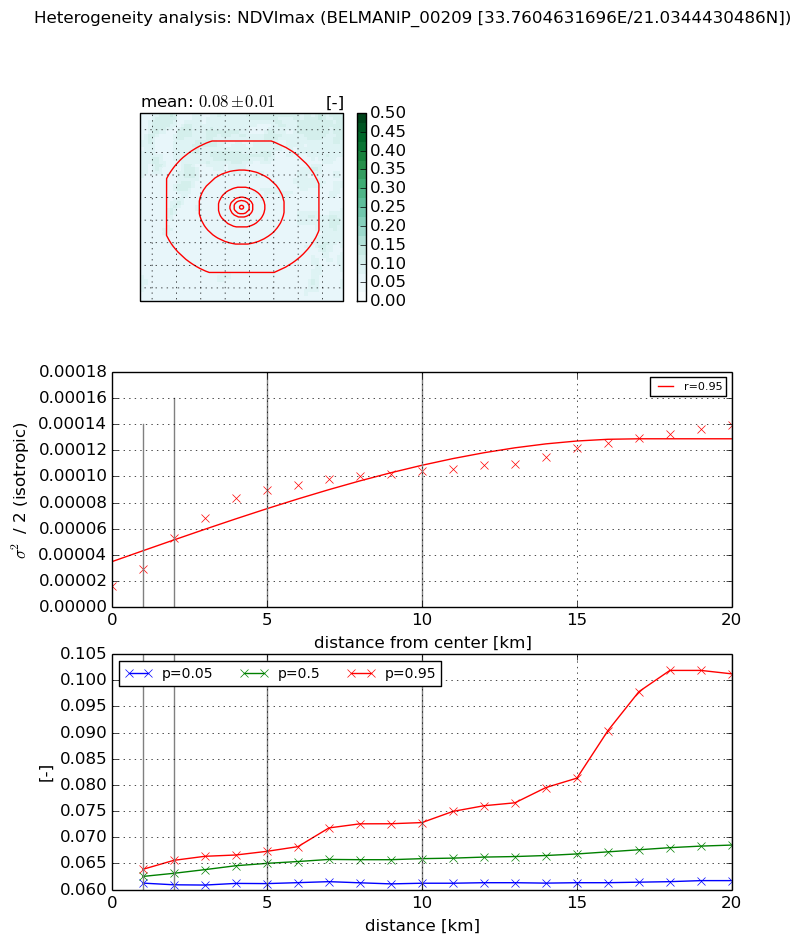
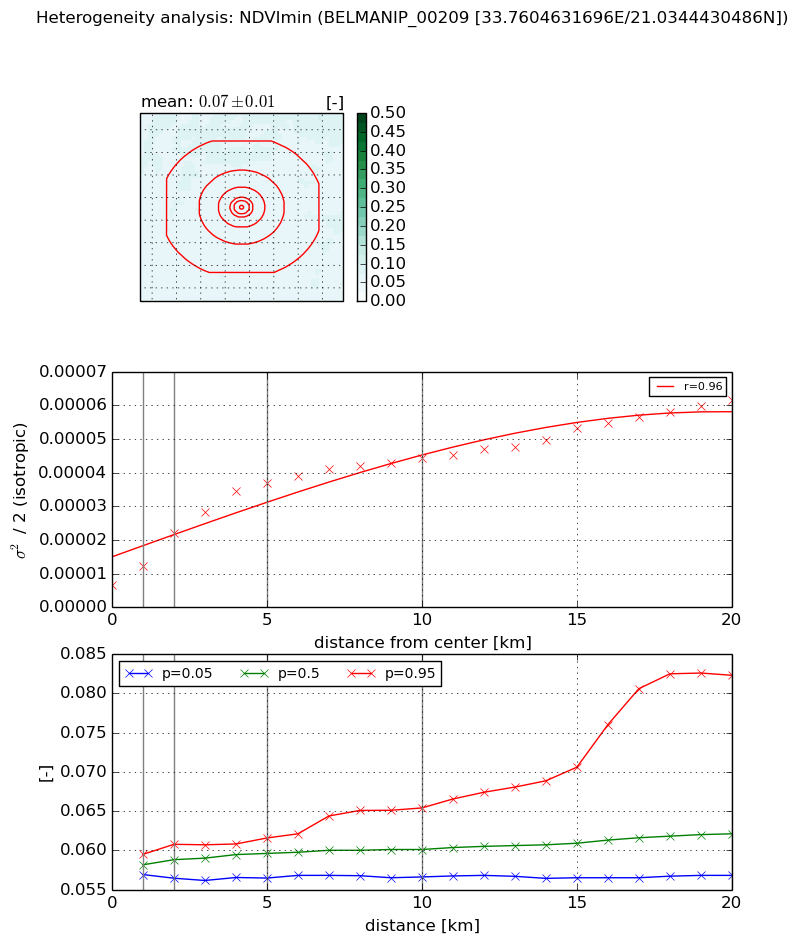
Heterogeneity analysis

The heterogeneity analysis provides information about the spatial and temporal heterogeneity of the site.

Topography


Roman et al. (2009) index


St

2.06592194743

Rcv

0.488382705533

Rse

0.0

Rst

-1.60455638393e-07

Rsv

-0.963753311631


Height range @ 1km [m]

8

Height range @ 2km [m]

12

Height range @ 5km [m]

26

Height range @ 10km [m]

-999

Height range @ 20km [m]

-999


Variance slope @ 1 km

12

Variance slope @ 2 km

13

Variance slope @ 5 km

13

Variance slope @ 10 km

-999

Variance slope @ 20 km

-999


NDVI (max. NDVI composite)


Roman et al. (2009) index


St

1.84684496877

Rcv

0.227677443445

Rse

0.0

Rst

-0.396714455857

Rsv

-0.999999996459


NDVI range @ 1km [-]

0.0

NDVI range @ 2km [-]

0.0

NDVI range @ 5km [-]

0.01

NDVI range @ 10km [-]

0.01

NDVI range @ 20km [-]

0.04


Variance slope @ 1 km

1.35630649e-05

Variance slope @ 2 km

1.85763891858e-05

Variance slope @ 5 km

1.56078332863e-05

Variance slope @ 10 km

8.59467411529e-06

Variance slope @ 20 km

4.94717758669e-06


NDVI (min. NDVI composite)I


Roman et al. (2009) index


St

1.99610934713

Rcv

0.143141724721

Rse

0.0

Rst

-0.359782030374

Rsv

-0.999999922063


NDVI range @ 1km [-]

0.0

NDVI range @ 2km [-]

0.0

NDVI range @ 5km [-]

0.01

NDVI range @ 10km [-]

0.01

NDVI range @ 20km [-]

0.03


NDVI slope @ 1 km

5.67363799862e-06

NDVI slope @ 2 km

7.72480944487e-06

NDVI slope @ 5 km

6.450378255e-06

NDVI slope @ 10 km

3.64002285862e-06

NDVI slope @ 20 km

2.25921429034e-06


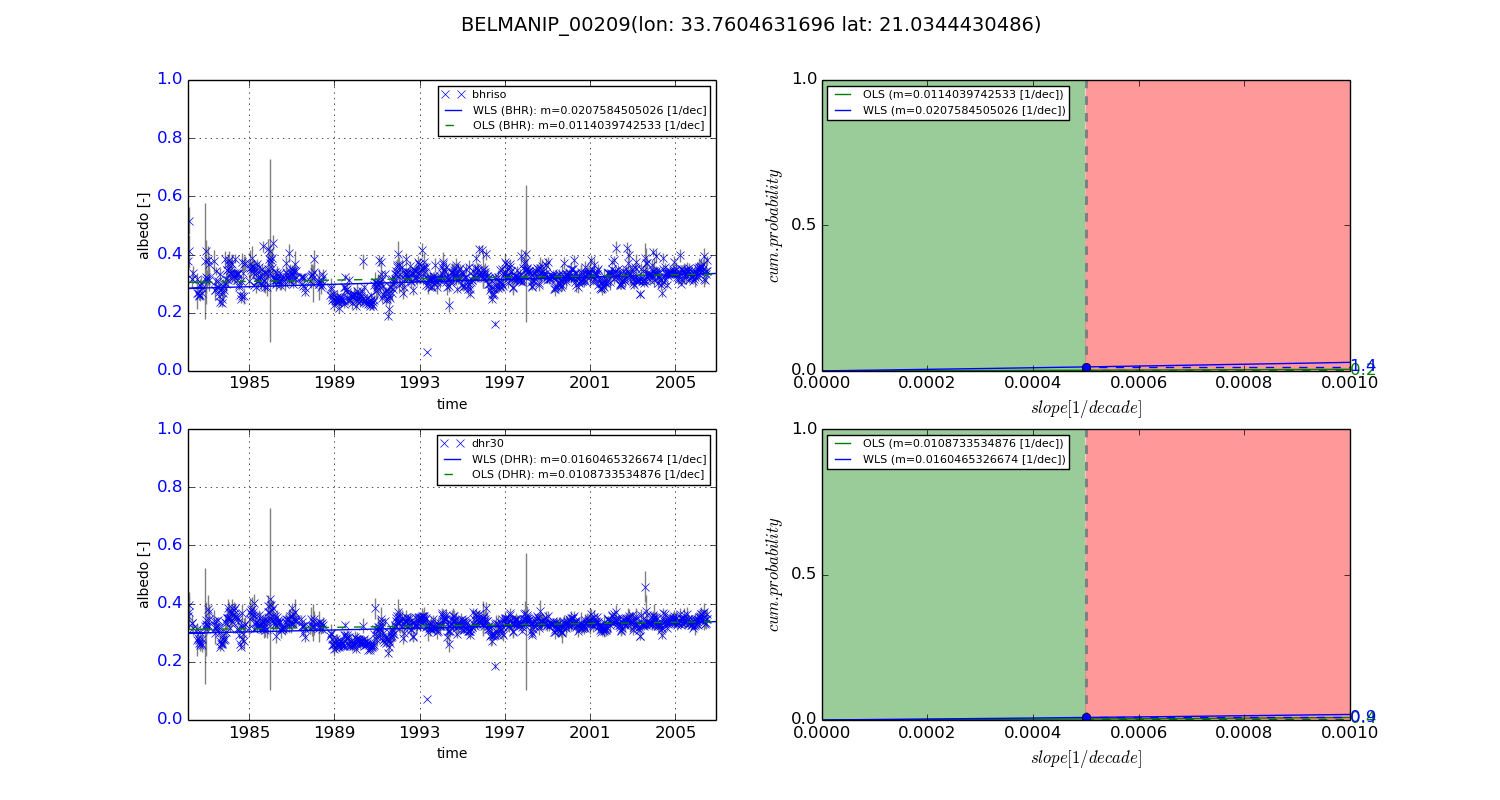
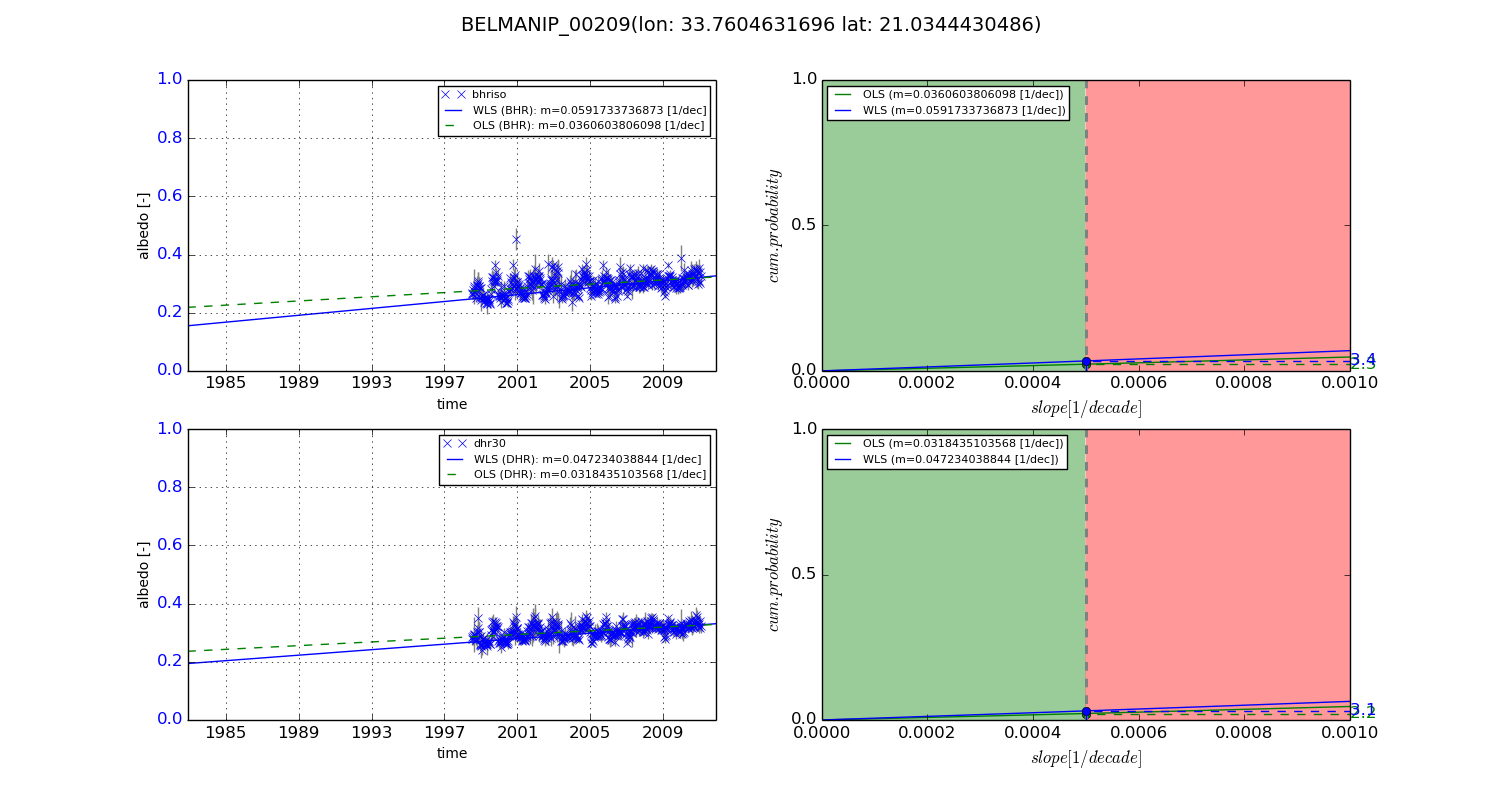
Temporal stability analysis

+000 deg (BHR)


BHR statistics

Temporal stability [1/decade]:


abs

rel


Weighted least square:

0.0207584505026


Ordinary least square:

0.0114039742533


Probabilities that GCOS criteria is met:

Weighted least square:

1.4 %

Ordinary least square:

0.2 %


DHR statistics

Temporal stability [1/decade]:


abs

rel


Weighted least square:

0.0160465326674


Ordinary least square:

0.0108733534876


Probabilities that GCOS criteria is met:

Weighted least square:

0.9 %

Ordinary least square:

0.4 %


+057/+063 deg (BHR)


BHR statistics

Temporal stability [1/decade]:


abs

rel


Weighted least square:

0.0591733736873


Ordinary least square:

0.0360603806098


Probabilities that GCOS criteria is met:

Weighted least square:

3.4 %

Ordinary least square:

2.3 %


DHR statistics

Temporal stability [1/decade]:


abs

rel


Weighted least square:

0.047234038844


Ordinary least square:

0.0318435103568


Probabilities that GCOS criteria is met:

Weighted least square:

3.1 %

Ordinary least square:

2.2 %


Temporal anomaly analyis

The variance of the temporal anomalies provides an additional measure about the stability of the signal AFTER removal of the mean seasonal cylce.
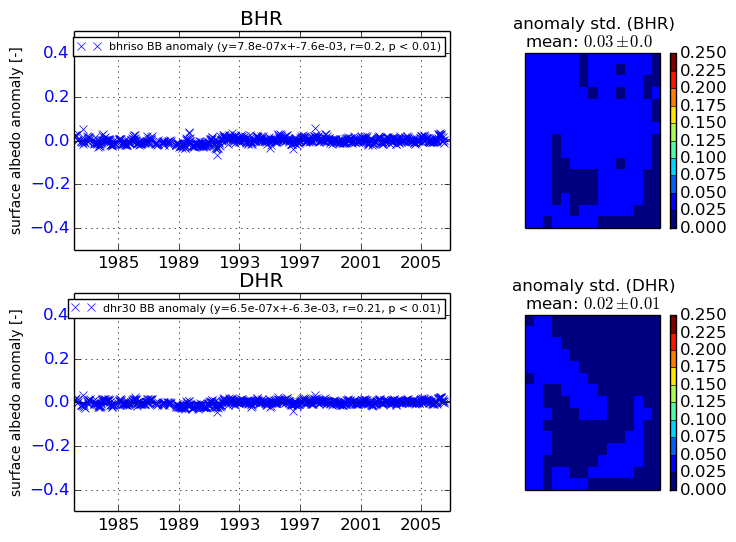
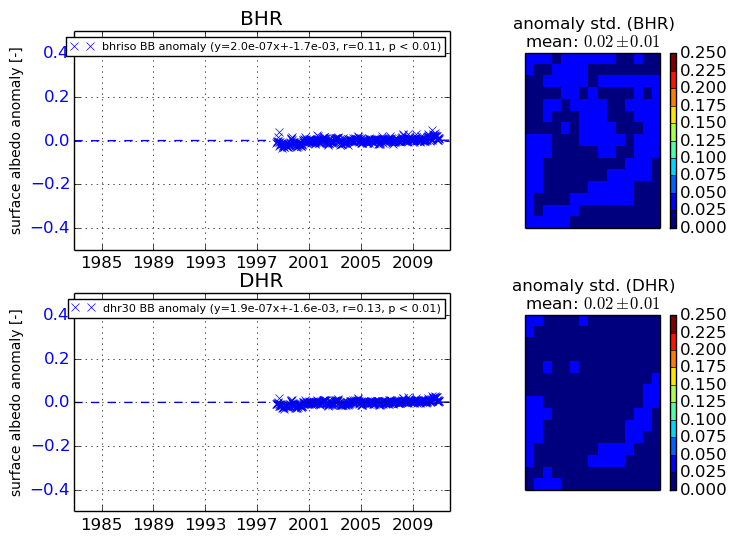
+000 deg


+057/+063 deg