BELMANIP_00211


Location

lon / lat [deg]: 45.7944 / 26.7713

Source network: BELMANIP


Geostationary surface albedo (GSA) data


“+000”


“+057/+063”


Landcover information (based on ESA CCI landcover data)


Landcover fractions @ 2km distance


Landcover fractions @ 20 km distance


Legend


Distance to open water bodies [km]:

none in region

Distance to urban areas [km]:

41.61


Radius: 1 km

Number of landcover classes:

1

Dominant landcover type:

200: bare areas

Fraction of dominant landcover type [%]:

100.0


Radius: 2 km

Number of landcover classes:

1

Dominant landcover type:

200: bare areas

Fraction of dominant landcover type [%]:

100.0


Radius: 5 km

Number of landcover classes:

1

Dominant landcover type:

200: bare areas

Fraction of dominant landcover type [%]:

100.0


Radius: 10 km

Number of landcover classes:

1

Dominant landcover type:

200: bare areas

Fraction of dominant landcover type [%]:

100.0


Radius: 20 km

Number of landcover classes:

1

Dominant landcover type:

200: bare areas

Fraction of dominant landcover type [%]:

100.0


Disturbances


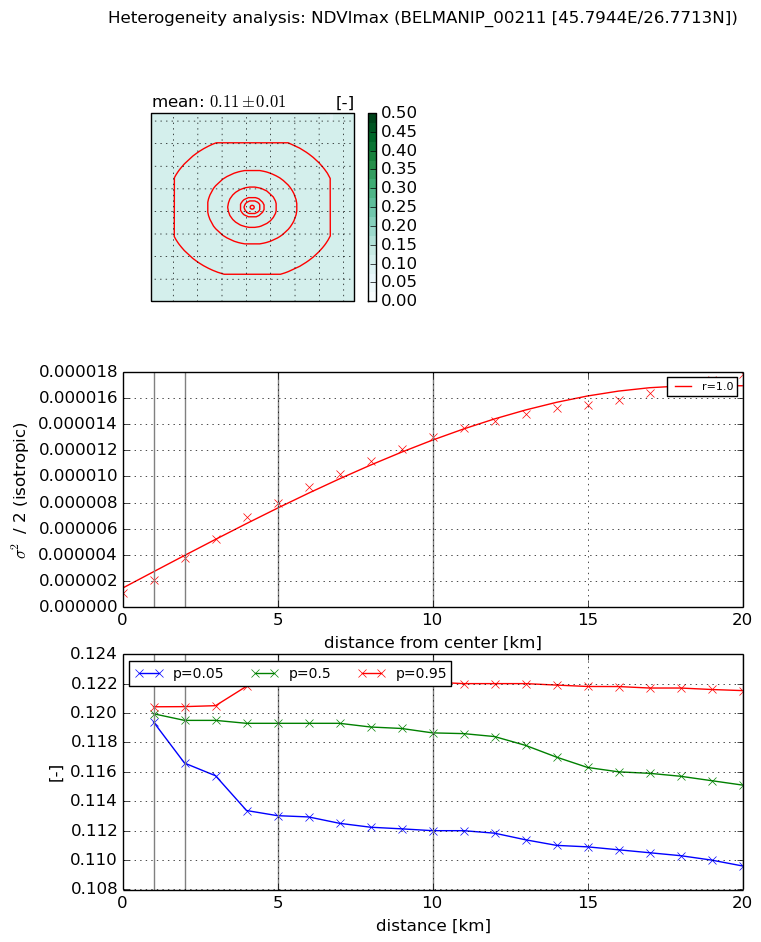
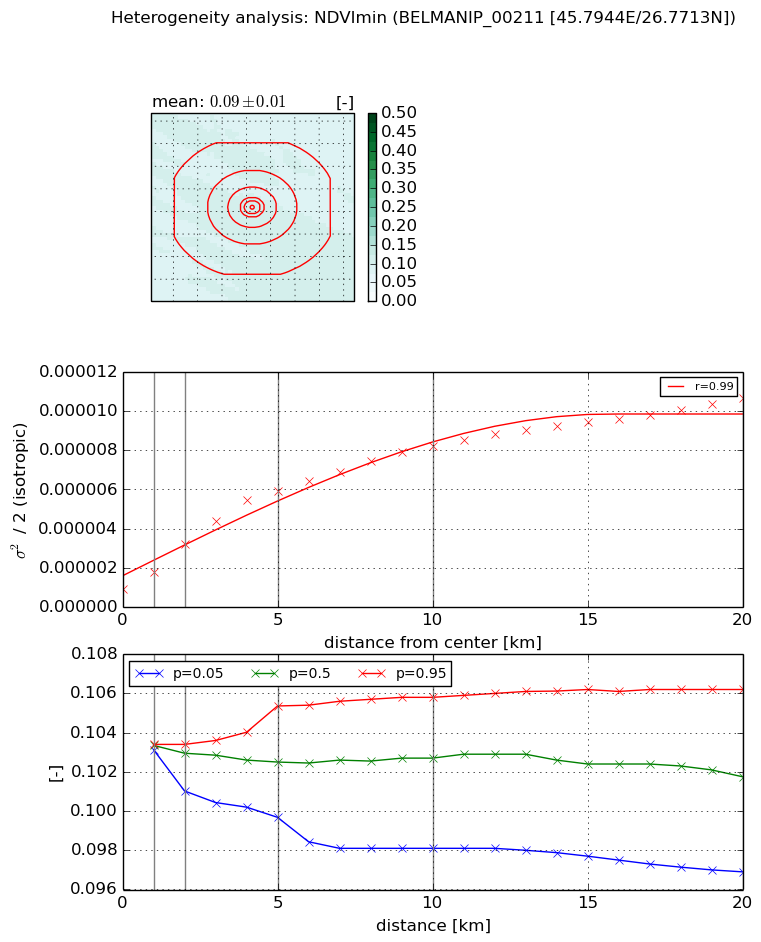
Heterogeneity analysis

The heterogeneity analysis provides information about the spatial and temporal heterogeneity of the site.

Topography


Roman et al. (2009) index


St

3.03676233777

Rcv

0.551536147022

Rse

0.0

Rst

0.00551148128174

Rsv

0.430846604541


Height range @ 1km [m]

14

Height range @ 2km [m]

16

Height range @ 5km [m]

27

Height range @ 10km [m]

-999

Height range @ 20km [m]

-999


Variance slope @ 1 km

32

Variance slope @ 2 km

30

Variance slope @ 5 km

19

Variance slope @ 10 km

-999

Variance slope @ 20 km

-999


NDVI (max. NDVI composite)


Roman et al. (2009) index


St

1.54455863544

Rcv

0.792705897201

Rse

0.0

Rst

0.0333234368155

Rsv

1.11627310188


NDVI range @ 1km [-]

0.0

NDVI range @ 2km [-]

0.0

NDVI range @ 5km [-]

0.01

NDVI range @ 10km [-]

0.01

NDVI range @ 20km [-]

0.01


Variance slope @ 1 km

9.93096602548e-07

Variance slope @ 2 km

1.34076159722e-06

Variance slope @ 5 km

1.44348519548e-06

Variance slope @ 10 km

1.22142907847e-06

Variance slope @ 20 km

8.1225698928e-07


NDVI (min. NDVI composite)I


Roman et al. (2009) index


St

1.32781053041

Rcv

0.602483821138

Rse

0.0

Rst

0.611902433956

Rsv

1.04497223867


NDVI range @ 1km [-]

0.0

NDVI range @ 2km [-]

0.0

NDVI range @ 5km [-]

0.01

NDVI range @ 10km [-]

0.01

NDVI range @ 20km [-]

0.01


NDVI slope @ 1 km

8.60937512226e-07

NDVI slope @ 2 km

1.15173359616e-06

NDVI slope @ 5 km

1.06556020159e-06

NDVI slope @ 10 km

7.23906755701e-07

NDVI slope @ 20 km

4.29130453142e-07


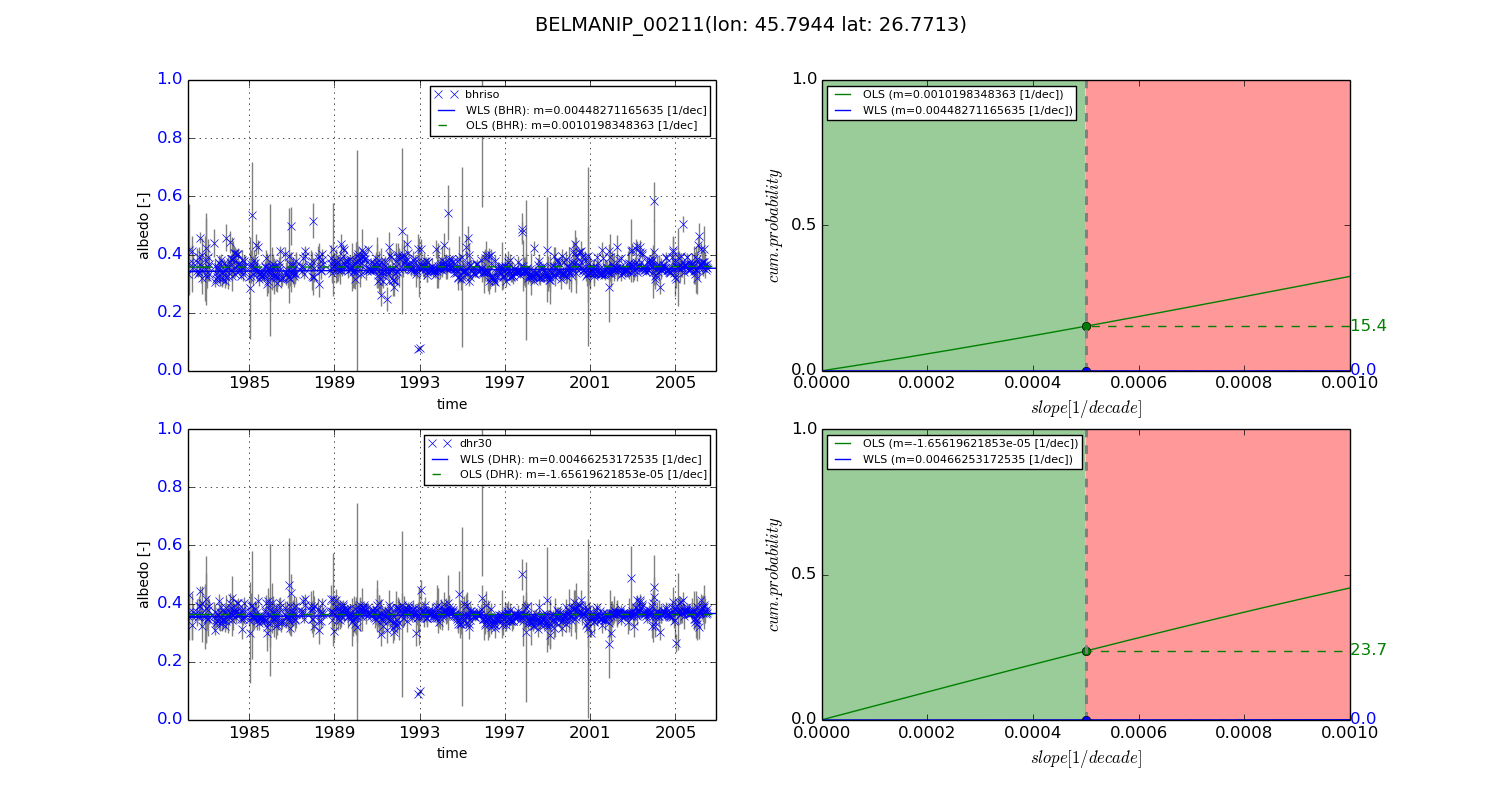
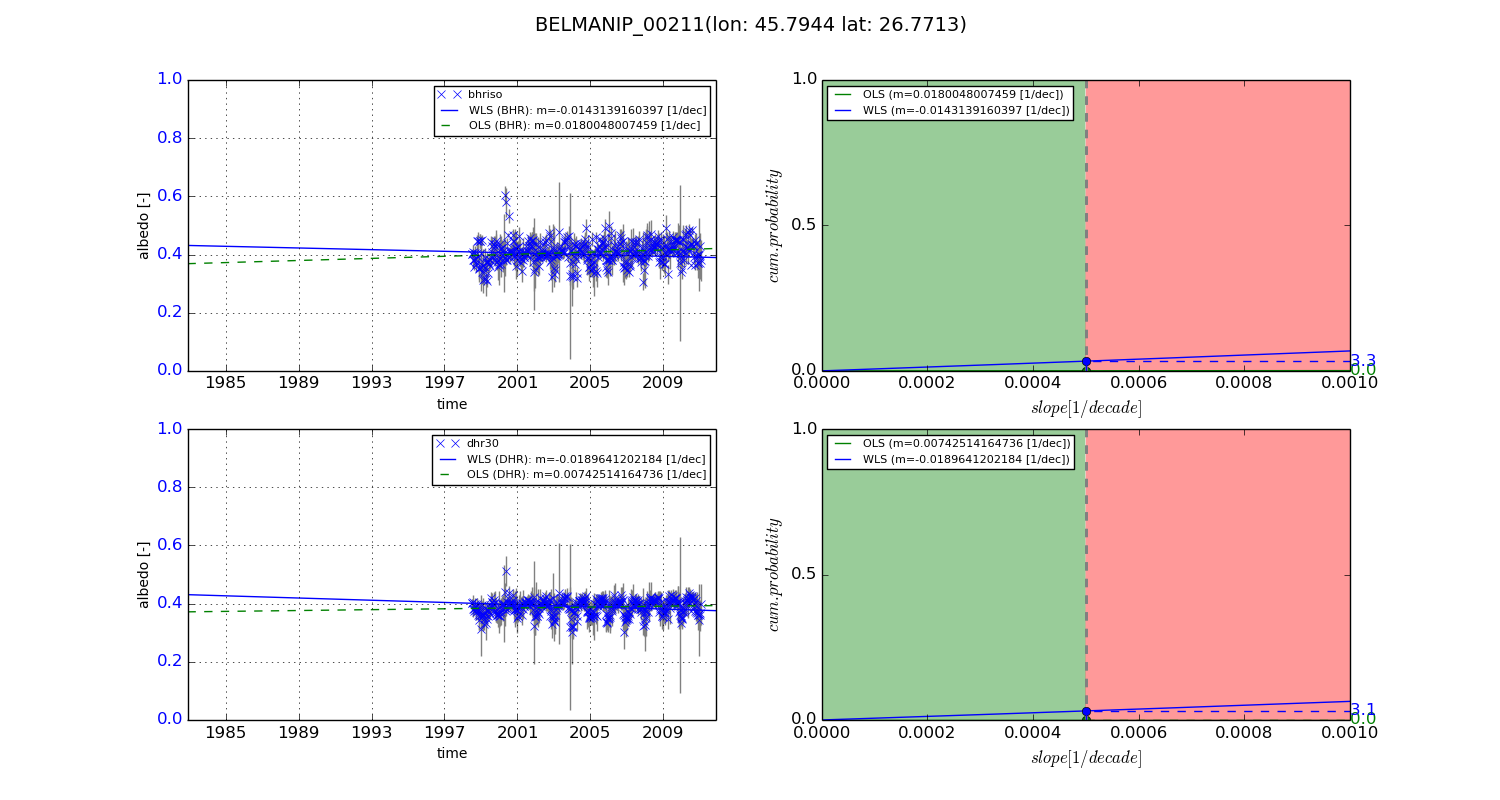
Temporal stability analysis

+000 deg (BHR)


BHR statistics

Temporal stability [1/decade]:


abs

rel


Weighted least square:

0.00448271165635


Ordinary least square:

0.0010198348363


Probabilities that GCOS criteria is met:

Weighted least square:

0.0 %

Ordinary least square:

15.4 %


DHR statistics

Temporal stability [1/decade]:


abs

rel


Weighted least square:

0.00466253172535


Ordinary least square:

-1.65619621853e-05


Probabilities that GCOS criteria is met:

Weighted least square:

0.0 %

Ordinary least square:

23.7 %


+057/+063 deg (BHR)


BHR statistics

Temporal stability [1/decade]:


abs

rel


Weighted least square:

-0.0143139160397


Ordinary least square:

0.0180048007459


Probabilities that GCOS criteria is met:

Weighted least square:

3.3 %

Ordinary least square:

0.0 %


DHR statistics

Temporal stability [1/decade]:


abs

rel


Weighted least square:

-0.0189641202184


Ordinary least square:

0.00742514164736


Probabilities that GCOS criteria is met:

Weighted least square:

3.1 %

Ordinary least square:

0.0 %


Temporal anomaly analyis

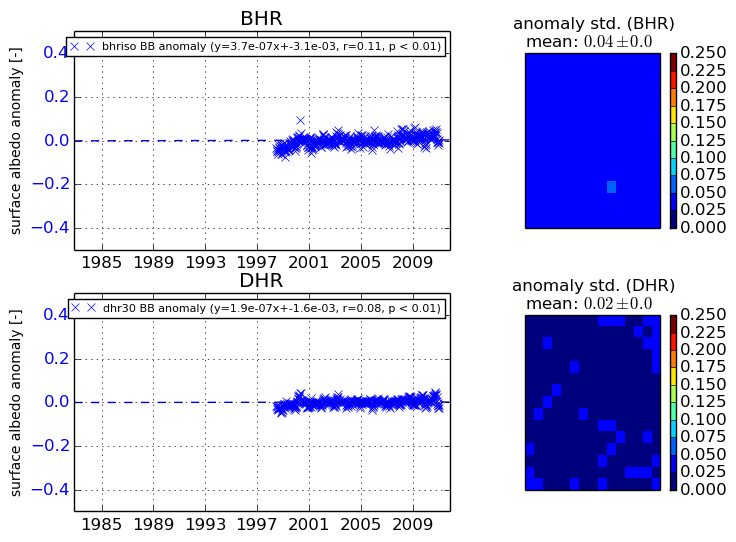
The variance of the temporal anomalies provides an additional measure about the stability of the signal AFTER removal of the mean seasonal cylce.
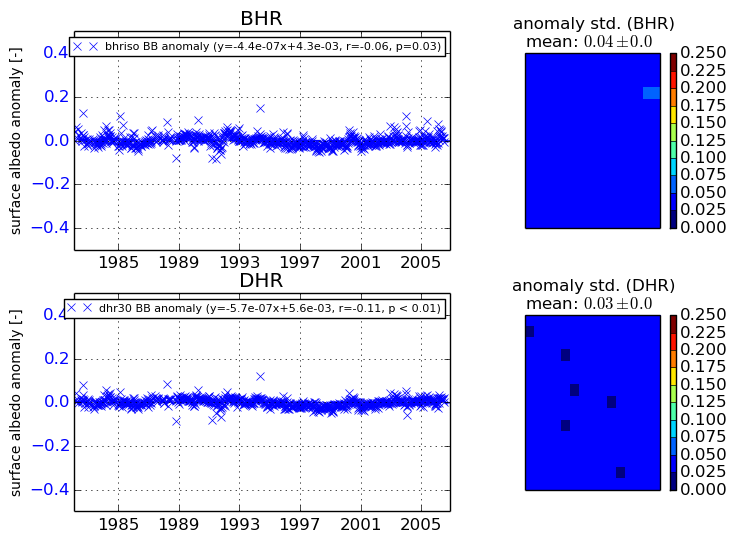
+000 deg


+057/+063 deg