BELMANIP_00212


Location

lon / lat [deg]: 48.1976 / 22.8619

Source network: BELMANIP


Geostationary surface albedo (GSA) data


“+000”


“+057/+063”


Landcover information (based on ESA CCI landcover data)


Landcover fractions @ 2km distance


Landcover fractions @ 20 km distance


Legend


Distance to open water bodies [km]:

none in region

Distance to urban areas [km]:

none in region


Radius: 1 km

Number of landcover classes:

1

Dominant landcover type:

200: bare areas

Fraction of dominant landcover type [%]:

100.0


Radius: 2 km

Number of landcover classes:

1

Dominant landcover type:

200: bare areas

Fraction of dominant landcover type [%]:

100.0


Radius: 5 km

Number of landcover classes:

1

Dominant landcover type:

200: bare areas

Fraction of dominant landcover type [%]:

100.0


Radius: 10 km

Number of landcover classes:

1

Dominant landcover type:

200: bare areas

Fraction of dominant landcover type [%]:

100.0


Radius: 20 km

Number of landcover classes:

1

Dominant landcover type:

200: bare areas

Fraction of dominant landcover type [%]:

100.0


Disturbances


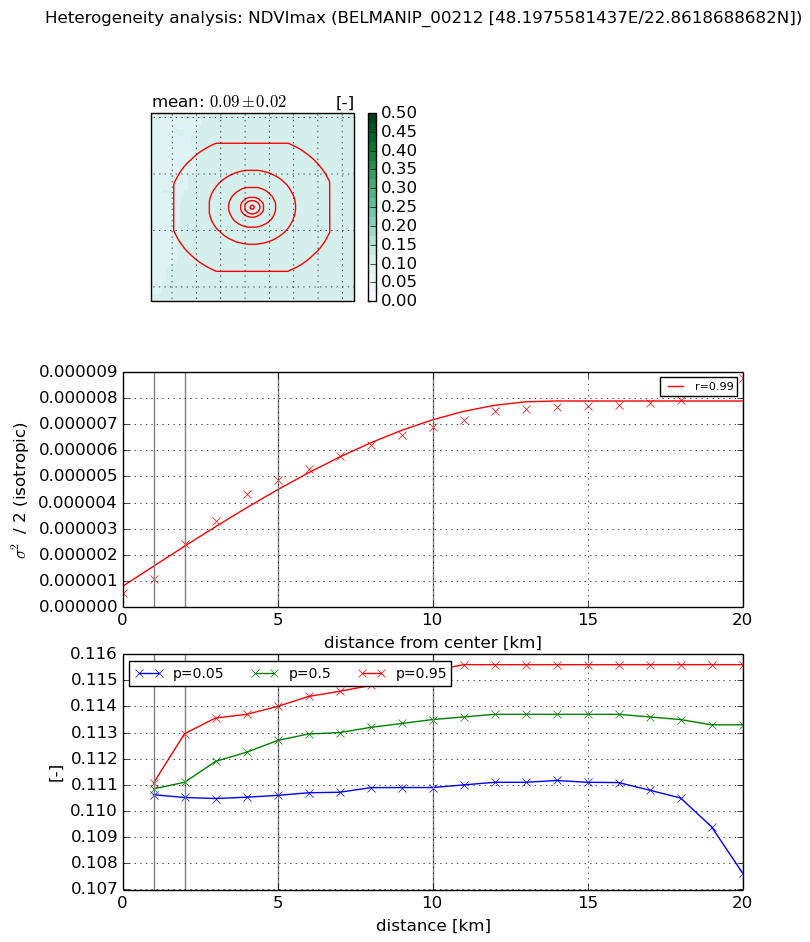
Heterogeneity analysis

The heterogeneity analysis provides information about the spatial and temporal heterogeneity of the site.

Topography


Roman et al. (2009) index


St

5.03761976739

Rcv

0.141821704092

Rse

0.0

Rst

-0.0370788070126

Rsv

0.416618829084


Height range @ 1km [m]

16

Height range @ 2km [m]

17

Height range @ 5km [m]

20

Height range @ 10km [m]

-999

Height range @ 20km [m]

-999


Variance slope @ 1 km

9

Variance slope @ 2 km

7

Variance slope @ 5 km

6

Variance slope @ 10 km

-999

Variance slope @ 20 km

-999


NDVI (max. NDVI composite)


Roman et al. (2009) index


St

24.7866273123

Rcv

0.0296887460649

Rse

0.0

Rst

-0.044031746008

Rsv

0.0473125134344


NDVI range @ 1km [-]

0.0

NDVI range @ 2km [-]

0.0

NDVI range @ 5km [-]

0.0

NDVI range @ 10km [-]

0.0

NDVI range @ 20km [-]

0.01


Variance slope @ 1 km

5.4061882258e-07

Variance slope @ 2 km

9.43090303491e-07

Variance slope @ 5 km

9.20046630458e-07

Variance slope @ 10 km

6.45447562214e-07

Variance slope @ 20 km

3.5724179747e-07


NDVI (min. NDVI composite)I


Roman et al. (2009) index


St

8.53991038662

Rcv

0.128643382805

Rse

0.0

Rst

0.10997570734

Rsv

0.112672652295


NDVI range @ 1km [-]

0.0

NDVI range @ 2km [-]

0.0

NDVI range @ 5km [-]

0.0

NDVI range @ 10km [-]

0.01

NDVI range @ 20km [-]

0.01


NDVI slope @ 1 km

5.34729729689e-07

NDVI slope @ 2 km

9.34065327991e-07

NDVI slope @ 5 km

9.6206440666e-07

NDVI slope @ 10 km

7.67625893015e-07

NDVI slope @ 20 km

4.14166400568e-07


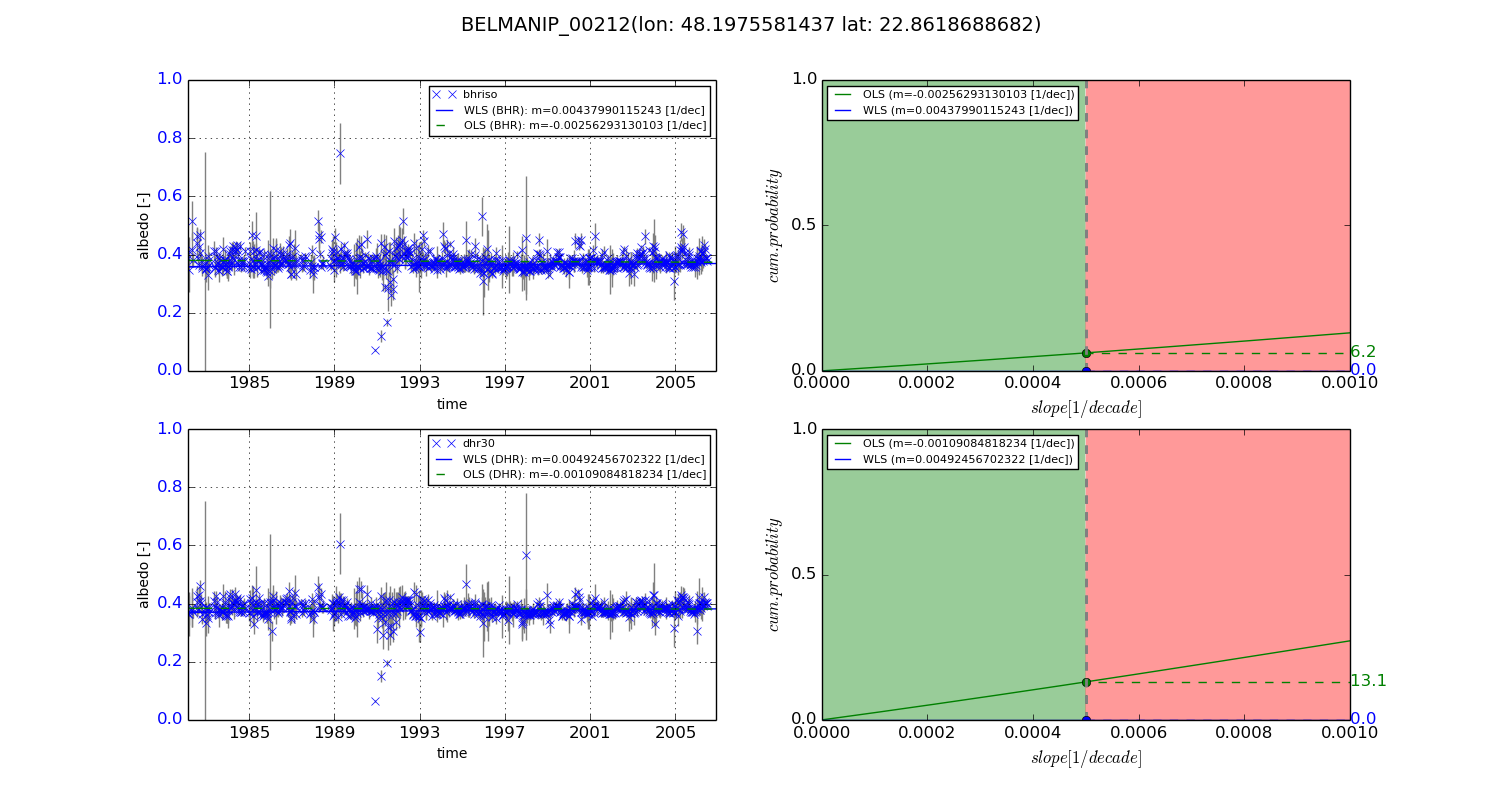
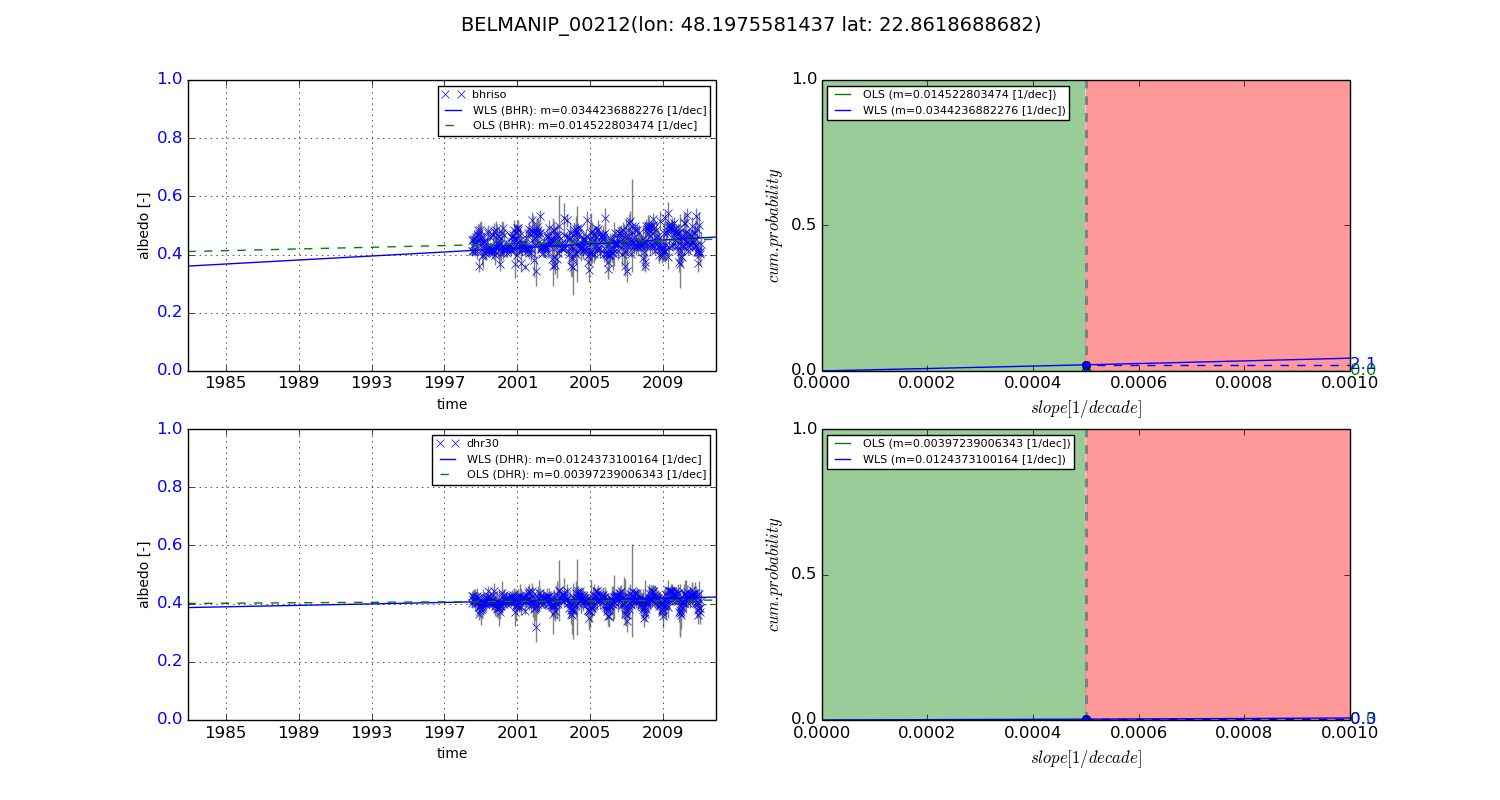
Temporal stability analysis

+000 deg (BHR)


BHR statistics

Temporal stability [1/decade]:


abs

rel


Weighted least square:

0.00437990115243


Ordinary least square:

-0.00256293130103


Probabilities that GCOS criteria is met:

Weighted least square:

0.0 %

Ordinary least square:

6.2 %


DHR statistics

Temporal stability [1/decade]:


abs

rel


Weighted least square:

0.00492456702322


Ordinary least square:

-0.00109084818234


Probabilities that GCOS criteria is met:

Weighted least square:

0.0 %

Ordinary least square:

13.1 %


+057/+063 deg (BHR)


BHR statistics

Temporal stability [1/decade]:


abs

rel


Weighted least square:

0.0344236882276


Ordinary least square:

0.014522803474


Probabilities that GCOS criteria is met:

Weighted least square:

2.1 %

Ordinary least square:

0.0 %


DHR statistics

Temporal stability [1/decade]:


abs

rel


Weighted least square:

0.0124373100164


Ordinary least square:

0.00397239006343


Probabilities that GCOS criteria is met:

Weighted least square:

0.3 %

Ordinary least square:

0.0 %


Temporal anomaly analyis

The variance of the temporal anomalies provides an additional measure about the stability of the signal AFTER removal of the mean seasonal cylce.
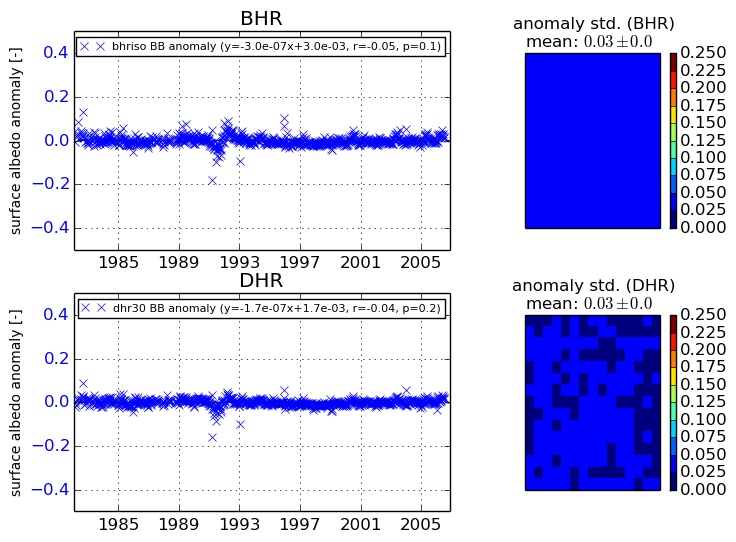
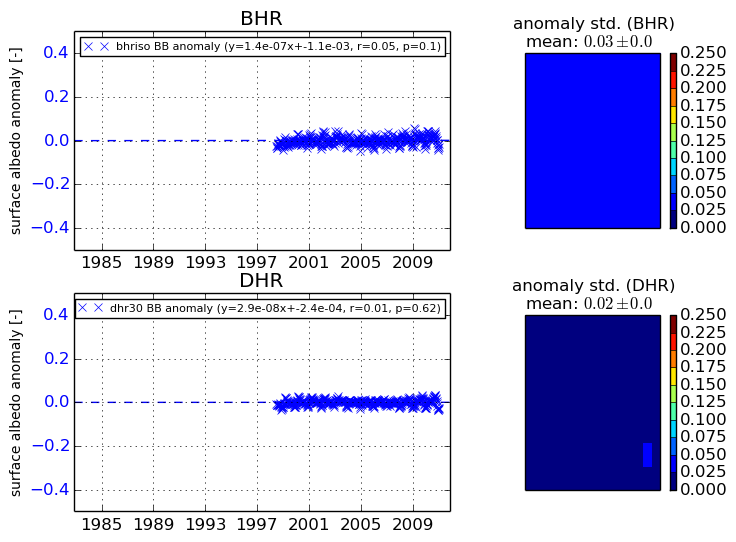
+000 deg


+057/+063 deg