BELMANIP_00213


Location

lon / lat [deg]: 47.4717 / 20.4644

Source network: BELMANIP


Geostationary surface albedo (GSA) data


“+000”


“+057/+063”


Landcover information (based on ESA CCI landcover data)


Landcover fractions @ 2km distance


Landcover fractions @ 20 km distance


Legend


Distance to open water bodies [km]:

none in region

Distance to urban areas [km]:

none in region


Radius: 1 km

Number of landcover classes:

1

Dominant landcover type:

200: bare areas

Fraction of dominant landcover type [%]:

100.0


Radius: 2 km

Number of landcover classes:

1

Dominant landcover type:

200: bare areas

Fraction of dominant landcover type [%]:

100.0


Radius: 5 km

Number of landcover classes:

1

Dominant landcover type:

200: bare areas

Fraction of dominant landcover type [%]:

100.0


Radius: 10 km

Number of landcover classes:

1

Dominant landcover type:

200: bare areas

Fraction of dominant landcover type [%]:

100.0


Radius: 20 km

Number of landcover classes:

1

Dominant landcover type:

200: bare areas

Fraction of dominant landcover type [%]:

100.0


Disturbances


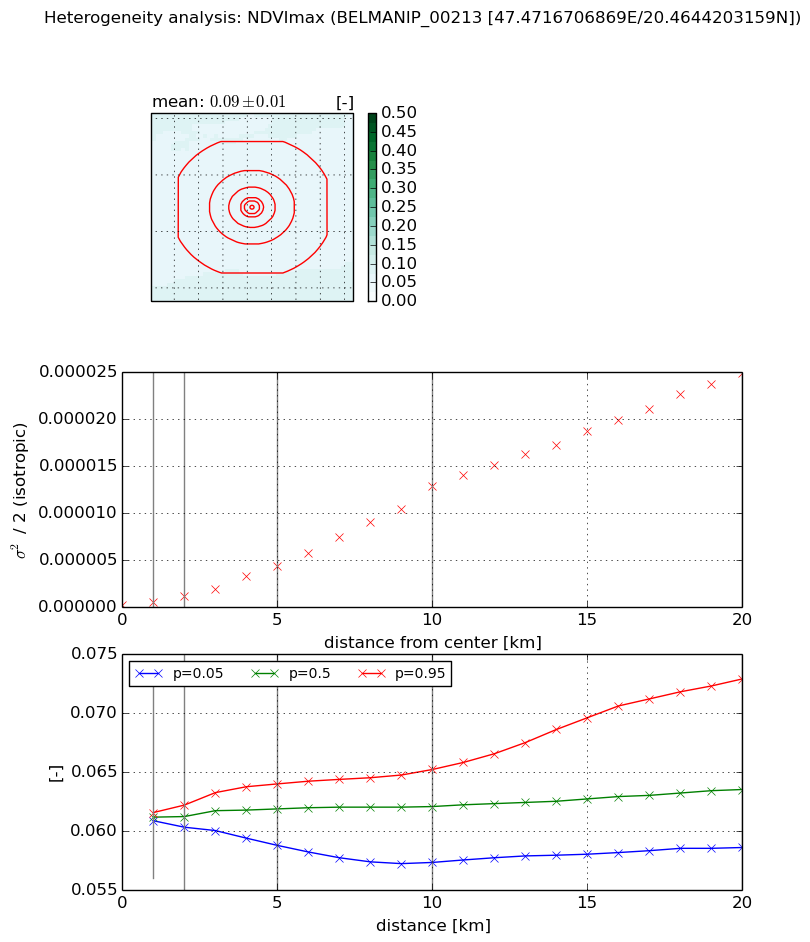
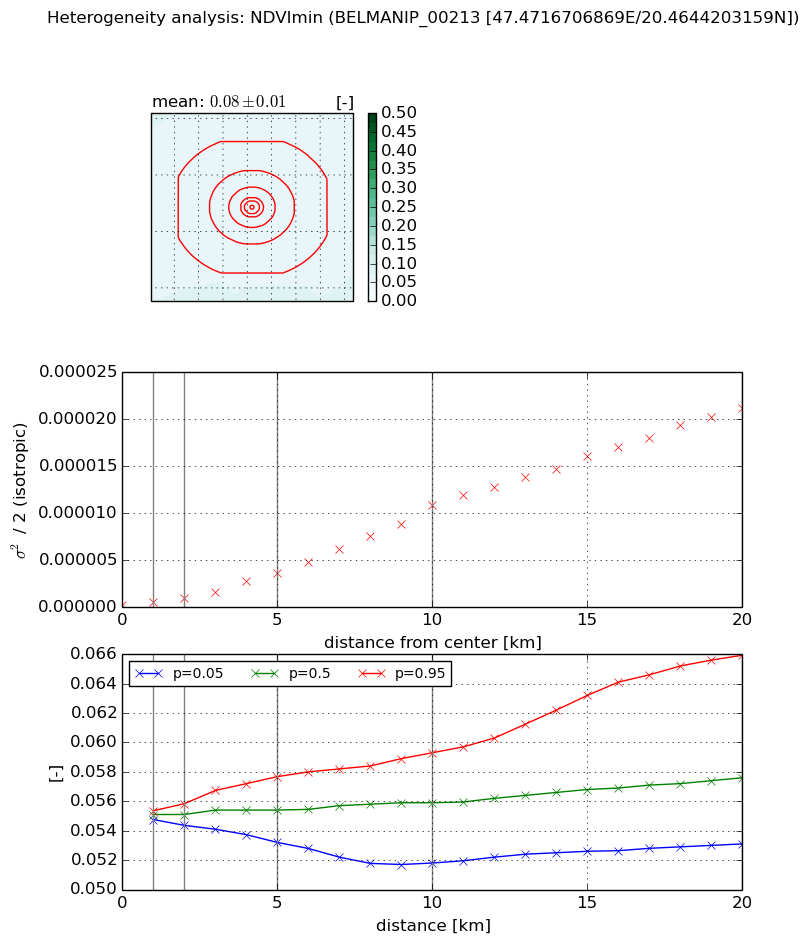
Heterogeneity analysis

The heterogeneity analysis provides information about the spatial and temporal heterogeneity of the site.

Topography


Roman et al. (2009) index


St

5.42707374334

Rcv

0.424995212154

Rse

0.0

Rst

1.25885967611e-09

Rsv

0.127788872796


Height range @ 1km [m]

4

Height range @ 2km [m]

5

Height range @ 5km [m]

8

Height range @ 10km [m]

-999

Height range @ 20km [m]

-999


Variance slope @ 1 km

0

Variance slope @ 2 km

0

Variance slope @ 5 km

1

Variance slope @ 10 km

-999

Variance slope @ 20 km

-999


NDVI (max. NDVI composite)


Roman et al. (2009) index


St

0.537167958027

Rcv

0.605223401936

Rse

0.0

Rst

2.22160309817e-08

Rsv

4.97962197693


NDVI range @ 1km [-]

0.0

NDVI range @ 2km [-]

0.0

NDVI range @ 5km [-]

0.01

NDVI range @ 10km [-]

0.01

NDVI range @ 20km [-]

0.01


Variance slope @ 1 km

3.06234234557e-07

Variance slope @ 2 km

4.57103868488e-07

Variance slope @ 5 km

8.30647933697e-07

Variance slope @ 10 km

1.26634287266e-06

Variance slope @ 20 km

1.32253863522e-06


NDVI (min. NDVI composite)I


Roman et al. (2009) index


St

1.74699949327

Rcv

0.713387590701

Rse

0.0

Rst

-2.26946406341e-09

Rsv

1.00384244148


NDVI range @ 1km [-]

0.0

NDVI range @ 2km [-]

0.0

NDVI range @ 5km [-]

0.0

NDVI range @ 10km [-]

0.01

NDVI range @ 20km [-]

0.01


NDVI slope @ 1 km

2.60052227753e-07

NDVI slope @ 2 km

3.82783046471e-07

NDVI slope @ 5 km

6.88761170145e-07

NDVI slope @ 10 km

1.0654561392e-06

NDVI slope @ 20 km

1.13190237745e-06


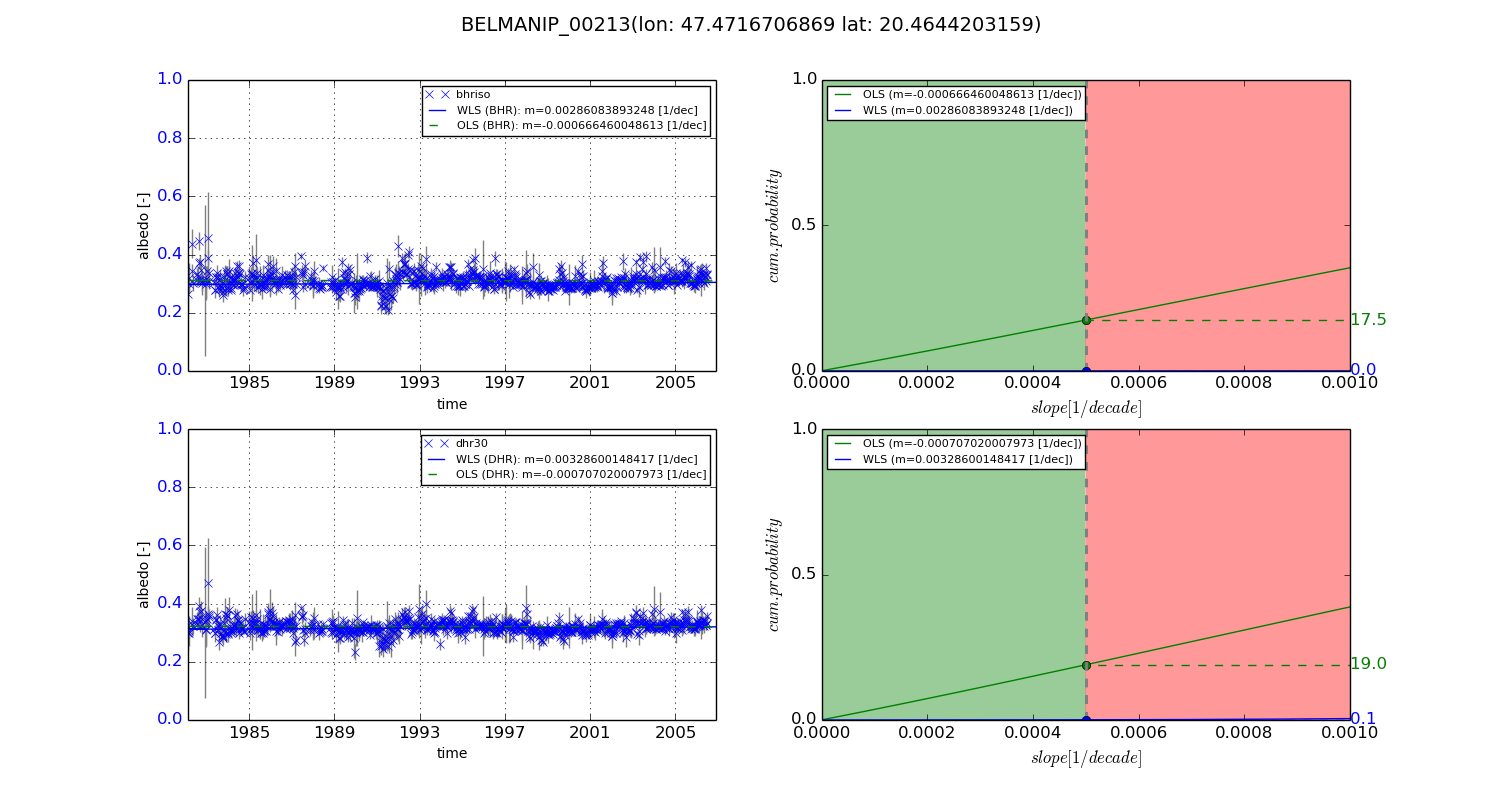
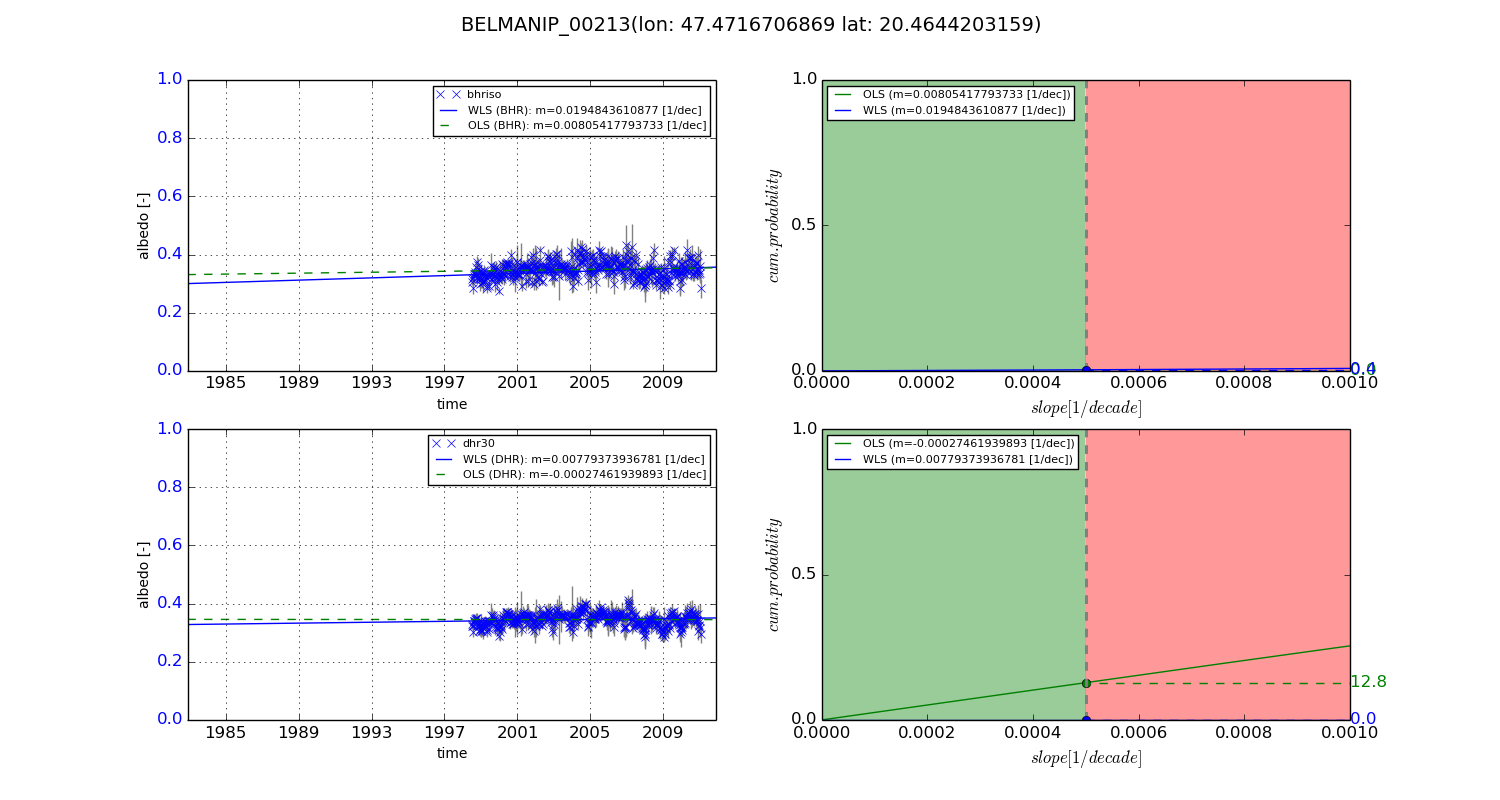
Temporal stability analysis

+000 deg (BHR)


BHR statistics

Temporal stability [1/decade]:


abs

rel


Weighted least square:

0.00286083893248


Ordinary least square:

-0.000666460048613


Probabilities that GCOS criteria is met:

Weighted least square:

0.0 %

Ordinary least square:

17.5 %


DHR statistics

Temporal stability [1/decade]:


abs

rel


Weighted least square:

0.00328600148417


Ordinary least square:

-0.000707020007973


Probabilities that GCOS criteria is met:

Weighted least square:

0.1 %

Ordinary least square:

19.0 %


+057/+063 deg (BHR)


BHR statistics

Temporal stability [1/decade]:


abs

rel


Weighted least square:

0.0194843610877


Ordinary least square:

0.00805417793733


Probabilities that GCOS criteria is met:

Weighted least square:

0.4 %

Ordinary least square:

0.0 %


DHR statistics

Temporal stability [1/decade]:


abs

rel


Weighted least square:

0.00779373936781


Ordinary least square:

-0.00027461939893


Probabilities that GCOS criteria is met:

Weighted least square:

0.0 %

Ordinary least square:

12.8 %


Temporal anomaly analyis

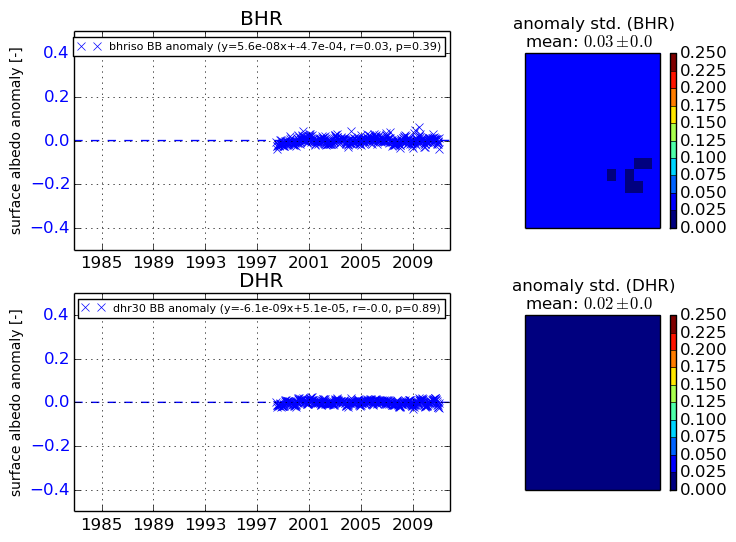
The variance of the temporal anomalies provides an additional measure about the stability of the signal AFTER removal of the mean seasonal cylce.
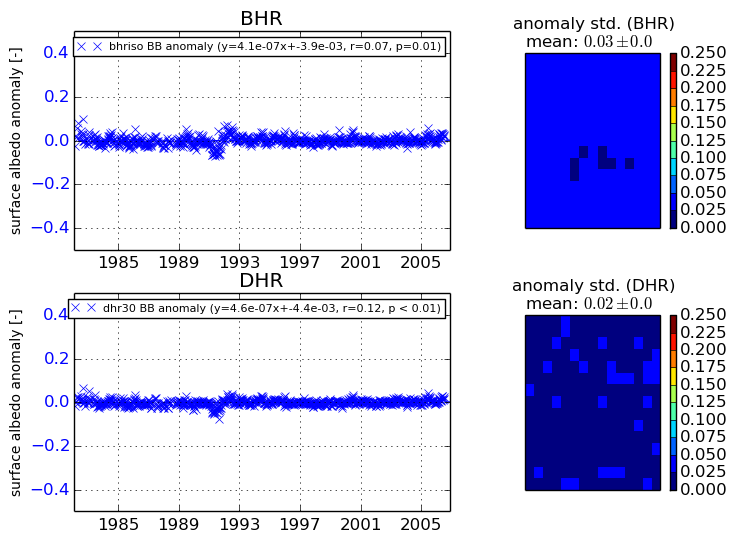
+000 deg


+057/+063 deg