BELMANIP_00214


Location

lon / lat [deg]: 58.0374 / 21.6045

Source network: BELMANIP


Geostationary surface albedo (GSA) data


“+000”


“+057/+063”


Landcover information (based on ESA CCI landcover data)


Landcover fractions @ 2km distance


Landcover fractions @ 20 km distance


Legend


Distance to open water bodies [km]:

51.67

Distance to urban areas [km]:

none in region


Radius: 1 km

Number of landcover classes:

1

Dominant landcover type:

200: bare areas

Fraction of dominant landcover type [%]:

100.0


Radius: 2 km

Number of landcover classes:

1

Dominant landcover type:

200: bare areas

Fraction of dominant landcover type [%]:

100.0


Radius: 5 km

Number of landcover classes:

1

Dominant landcover type:

200: bare areas

Fraction of dominant landcover type [%]:

100.0


Radius: 10 km

Number of landcover classes:

1

Dominant landcover type:

200: bare areas

Fraction of dominant landcover type [%]:

100.0


Radius: 20 km

Number of landcover classes:

1

Dominant landcover type:

200: bare areas

Fraction of dominant landcover type [%]:

100.0


Disturbances


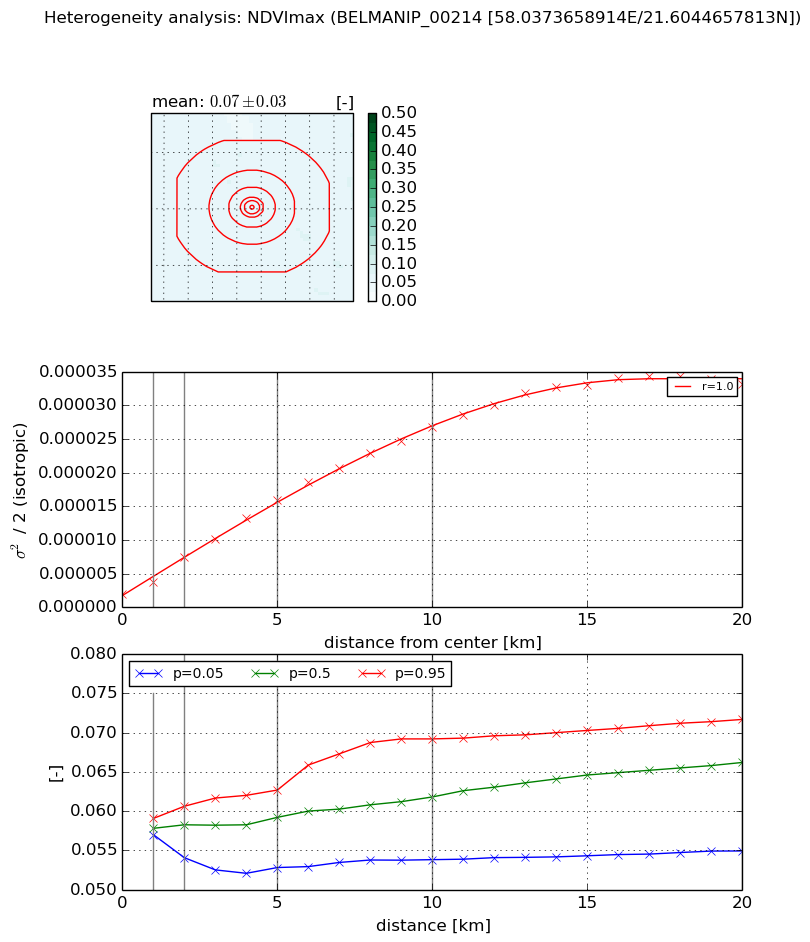
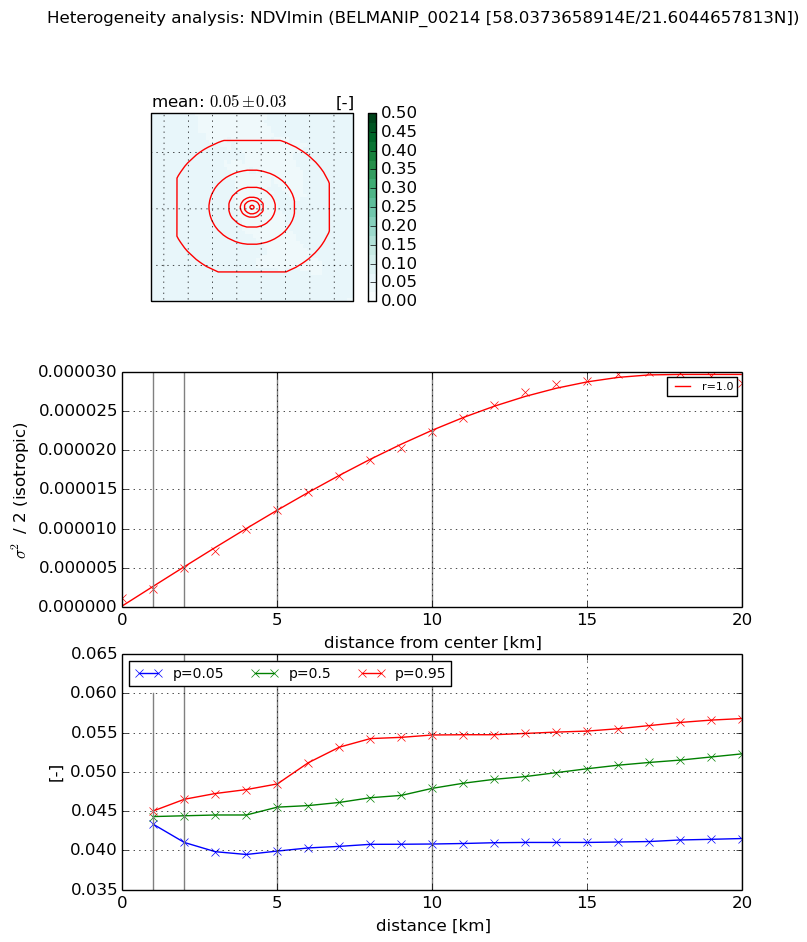
Heterogeneity analysis

The heterogeneity analysis provides information about the spatial and temporal heterogeneity of the site.

Topography


Roman et al. (2009) index


St

1.72587951667

Rcv

0.346722278424

Rse

0.0

Rst

4.18098265917e-09

Rsv

1.39152188277


Height range @ 1km [m]

7

Height range @ 2km [m]

7

Height range @ 5km [m]

11

Height range @ 10km [m]

-999

Height range @ 20km [m]

-999


Variance slope @ 1 km

1

Variance slope @ 2 km

1

Variance slope @ 5 km

1

Variance slope @ 10 km

-999

Variance slope @ 20 km

-999


NDVI (max. NDVI composite)


Roman et al. (2009) index


St

8.24021073213e-08

Rcv

0.180784742956

Rse

0.0

Rst

0.290235186976

Rsv

36406835.4404


NDVI range @ 1km [-]

0.0

NDVI range @ 2km [-]

0.01

NDVI range @ 5km [-]

0.01

NDVI range @ 10km [-]

0.02

NDVI range @ 20km [-]

0.02


Variance slope @ 1 km

1.77874260358e-06

Variance slope @ 2 km

2.74629135067e-06

Variance slope @ 5 km

2.89654601373e-06

Variance slope @ 10 km

2.55107751953e-06

Variance slope @ 20 km

1.67221182997e-06


NDVI (min. NDVI composite)I


Roman et al. (2009) index


St

2.10988074011e-07

Rcv

0.192795398333

Rse

0.0

Rst

0.283634668788

Rsv

14218812.6677


NDVI range @ 1km [-]

0.0

NDVI range @ 2km [-]

0.01

NDVI range @ 5km [-]

0.01

NDVI range @ 10km [-]

0.01

NDVI range @ 20km [-]

0.02


NDVI slope @ 1 km

1.16564618075e-06

NDVI slope @ 2 km

1.93167011182e-06

NDVI slope @ 5 km

2.30871581209e-06

NDVI slope @ 10 km

2.20447970102e-06

NDVI slope @ 20 km

1.53650456028e-06


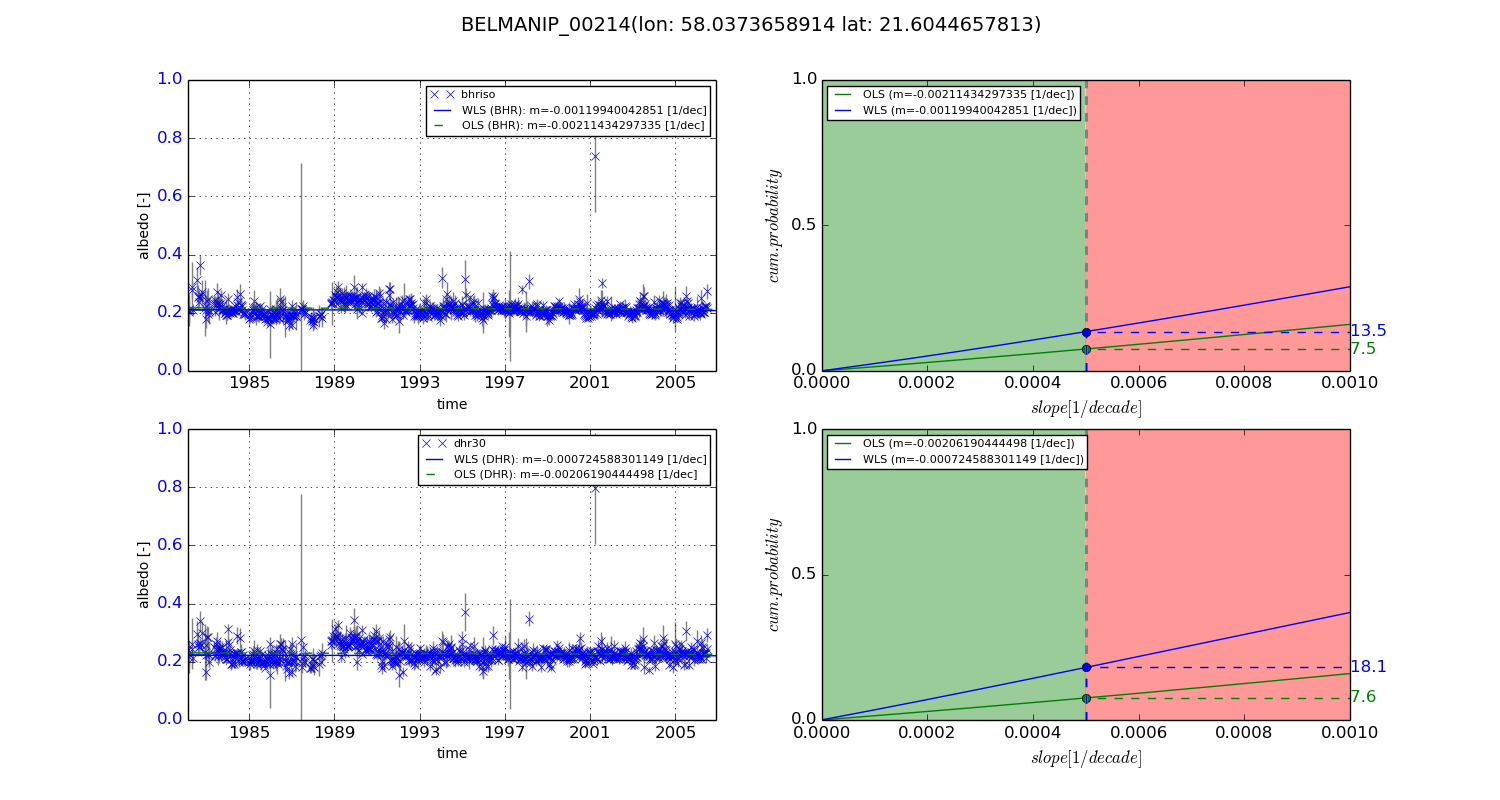
Temporal stability analysis

+000 deg (BHR)


BHR statistics

Temporal stability [1/decade]:


abs

rel


Weighted least square:

-0.00119940042851


Ordinary least square:

-0.00211434297335


Probabilities that GCOS criteria is met:

Weighted least square:

13.5 %

Ordinary least square:

7.5 %


DHR statistics

Temporal stability [1/decade]:


abs

rel


Weighted least square:

-0.000724588301149


Ordinary least square:

-0.00206190444498


Probabilities that GCOS criteria is met:

Weighted least square:

18.1 %

Ordinary least square:

7.6 %


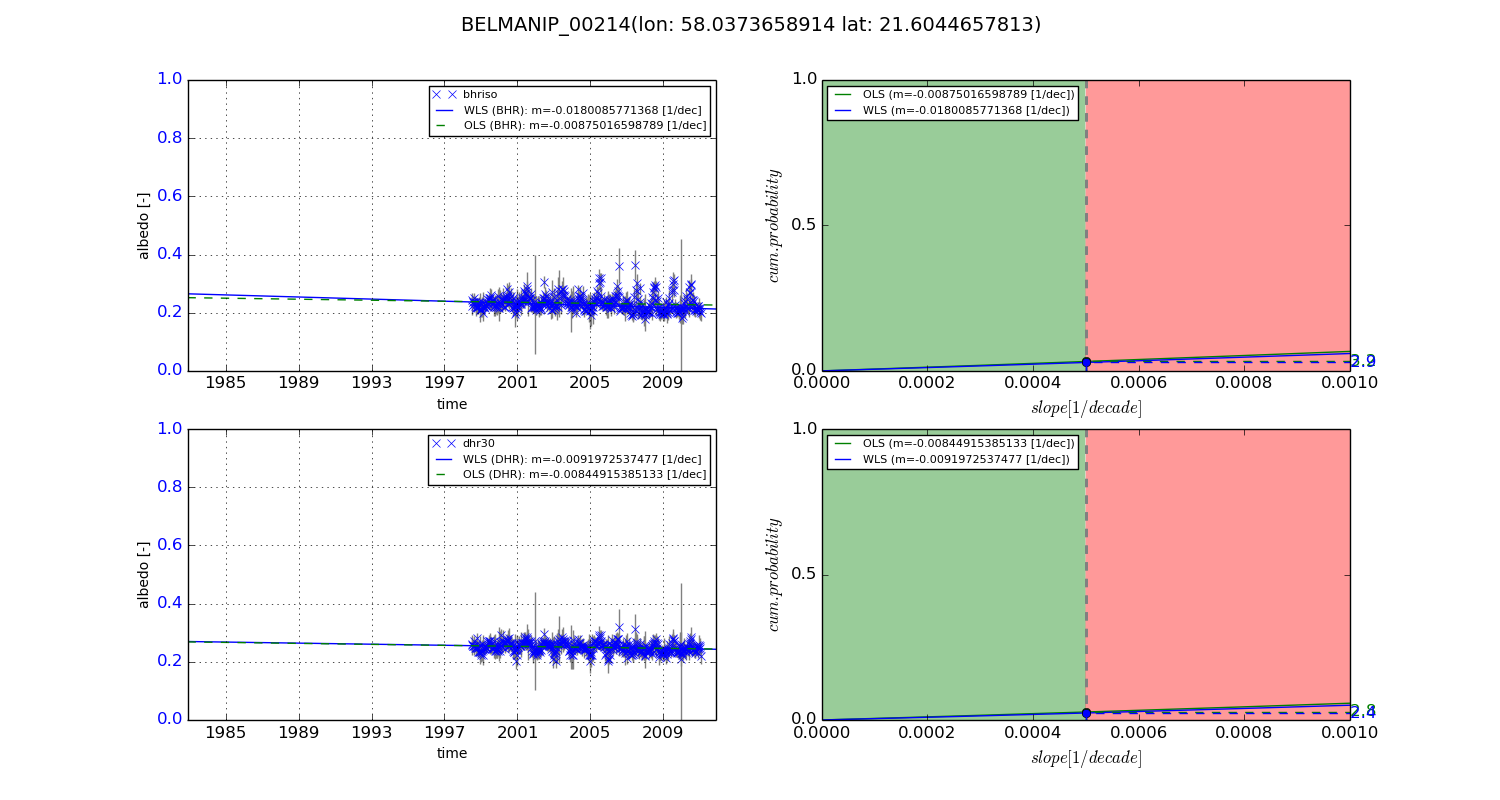
+057/+063 deg (BHR)


BHR statistics

Temporal stability [1/decade]:


abs

rel


Weighted least square:

-0.0180085771368


Ordinary least square:

-0.00875016598789


Probabilities that GCOS criteria is met:

Weighted least square:

2.9 %

Ordinary least square:

3.2 %


DHR statistics

Temporal stability [1/decade]:


abs

rel


Weighted least square:

-0.0091972537477


Ordinary least square:

-0.00844915385133


Probabilities that GCOS criteria is met:

Weighted least square:

2.4 %

Ordinary least square:

2.8 %


Temporal anomaly analyis

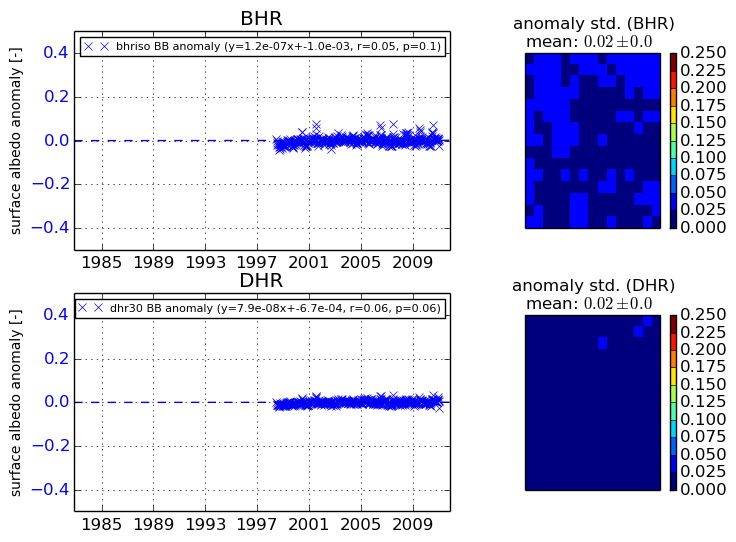
The variance of the temporal anomalies provides an additional measure about the stability of the signal AFTER removal of the mean seasonal cylce.
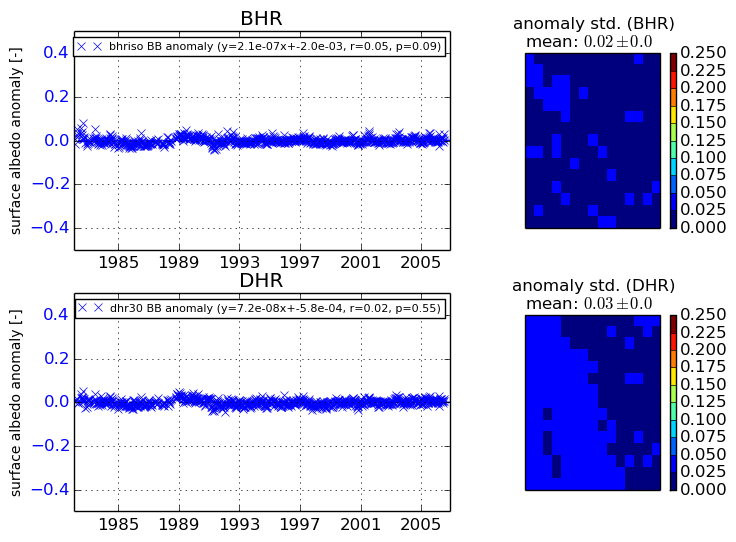
+000 deg


+057/+063 deg