BELMANIP_00217


Location

lon / lat [deg]: 18.8153 / 26.9185

Source network: BELMANIP


Geostationary surface albedo (GSA) data


“+000”


“+057/+063”


Landcover information (based on ESA CCI landcover data)


Landcover fractions @ 2km distance


Landcover fractions @ 20 km distance


Legend


Distance to open water bodies [km]:

none in region

Distance to urban areas [km]:

none in region


Radius: 1 km

Number of landcover classes:

1

Dominant landcover type:

200: bare areas

Fraction of dominant landcover type [%]:

100.0


Radius: 2 km

Number of landcover classes:

1

Dominant landcover type:

200: bare areas

Fraction of dominant landcover type [%]:

100.0


Radius: 5 km

Number of landcover classes:

1

Dominant landcover type:

200: bare areas

Fraction of dominant landcover type [%]:

100.0


Radius: 10 km

Number of landcover classes:

1

Dominant landcover type:

200: bare areas

Fraction of dominant landcover type [%]:

100.0


Radius: 20 km

Number of landcover classes:

1

Dominant landcover type:

200: bare areas

Fraction of dominant landcover type [%]:

100.0


Disturbances


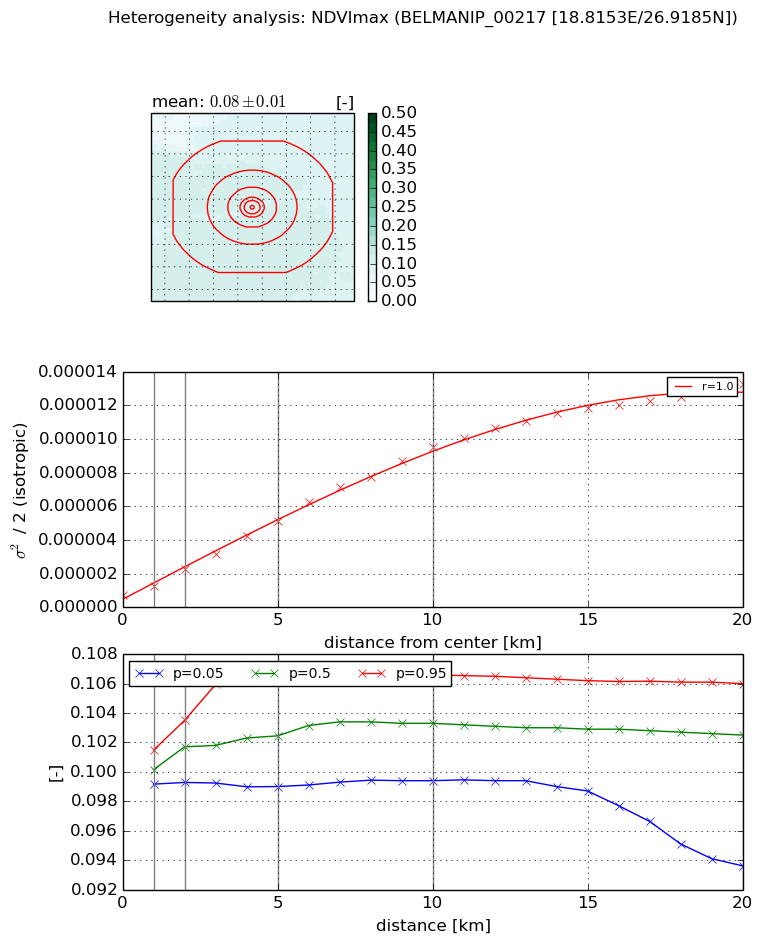
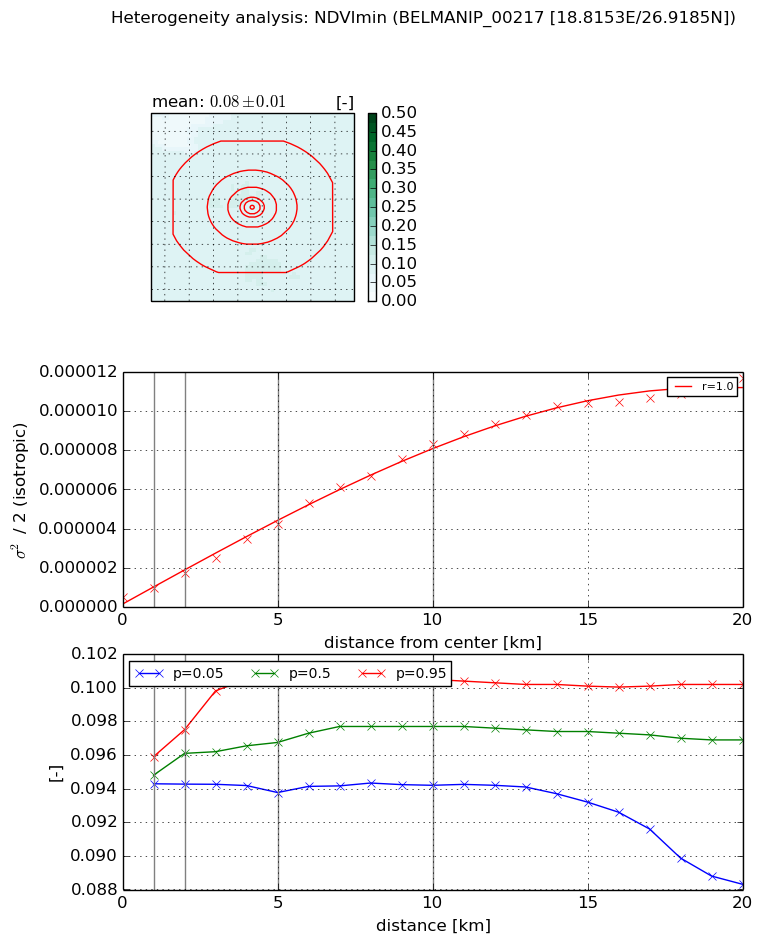
Heterogeneity analysis

The heterogeneity analysis provides information about the spatial and temporal heterogeneity of the site.

Topography


Roman et al. (2009) index


St

5.87433455819

Rcv

0.141048775983

Rse

0.0

Rst

0.000900201221728

Rsv

0.36874716553


Height range @ 1km [m]

6

Height range @ 2km [m]

7

Height range @ 5km [m]

9

Height range @ 10km [m]

-999

Height range @ 20km [m]

-999


Variance slope @ 1 km

2

Variance slope @ 2 km

2

Variance slope @ 5 km

1

Variance slope @ 10 km

-999

Variance slope @ 20 km

-999


NDVI (max. NDVI composite)


Roman et al. (2009) index


St

2.12285289941

Rcv

0.266529080511

Rse

0.0

Rst

-0.247837960027

Rsv

0.898825555536


NDVI range @ 1km [-]

0.0

NDVI range @ 2km [-]

0.0

NDVI range @ 5km [-]

0.01

NDVI range @ 10km [-]

0.01

NDVI range @ 20km [-]

0.01


Variance slope @ 1 km

5.87520249826e-07

Variance slope @ 2 km

7.73625024916e-07

Variance slope @ 5 km

9.07805454341e-07

Variance slope @ 10 km

9.10398928089e-07

Variance slope @ 20 km

6.45564333198e-07


NDVI (min. NDVI composite)I


Roman et al. (2009) index


St

2.3841716998

Rcv

0.308460671955

Rse

0.0

Rst

-0.289374124931

Rsv

0.660463840017


NDVI range @ 1km [-]

0.0

NDVI range @ 2km [-]

0.0

NDVI range @ 5km [-]

0.01

NDVI range @ 10km [-]

0.01

NDVI range @ 20km [-]

0.01


NDVI slope @ 1 km

4.53528273677e-07

NDVI slope @ 2 km

6.09424105567e-07

NDVI slope @ 5 km

7.6955466276e-07

NDVI slope @ 10 km

8.12859820048e-07

NDVI slope @ 20 km

5.78599262572e-07


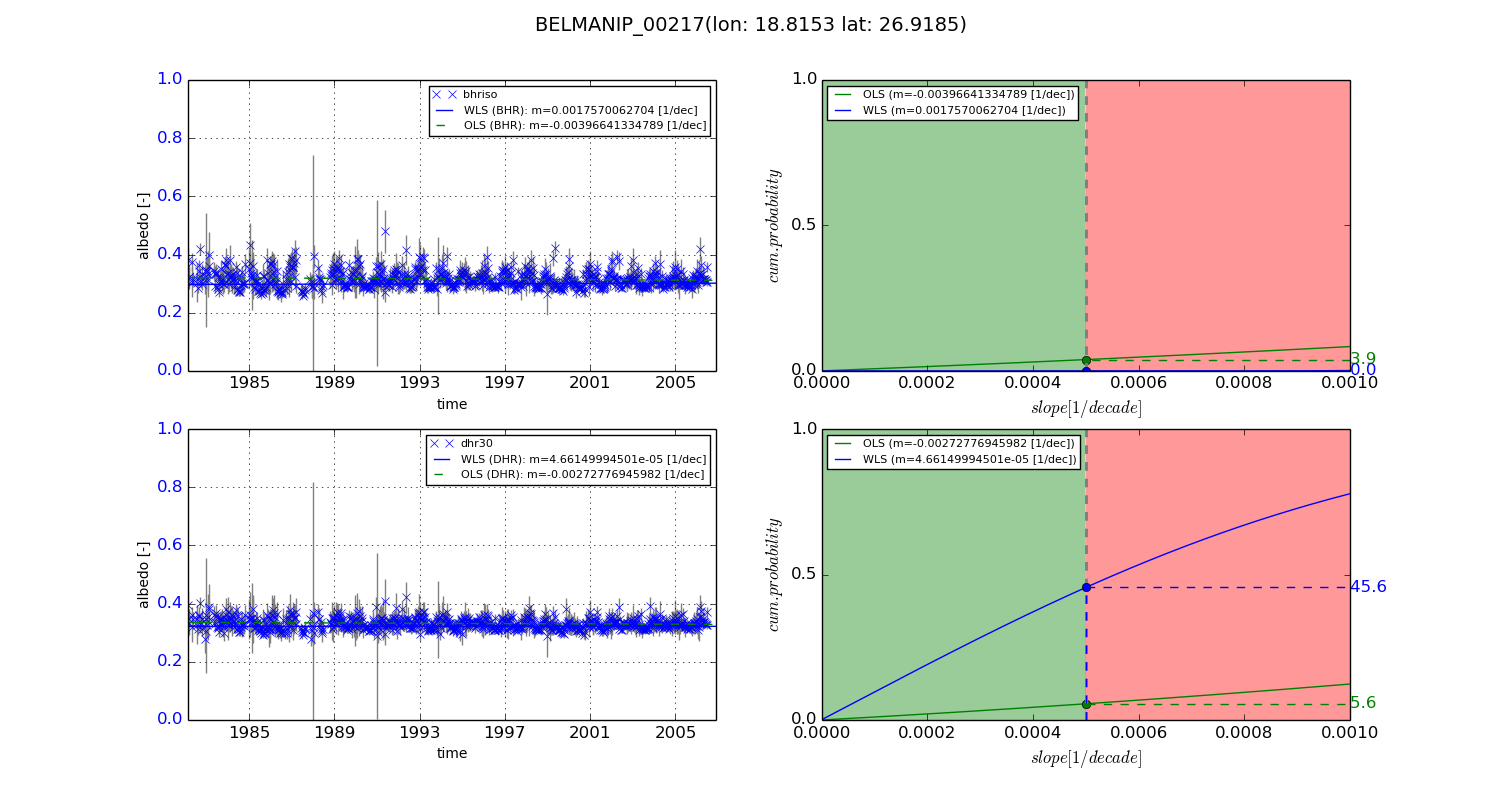
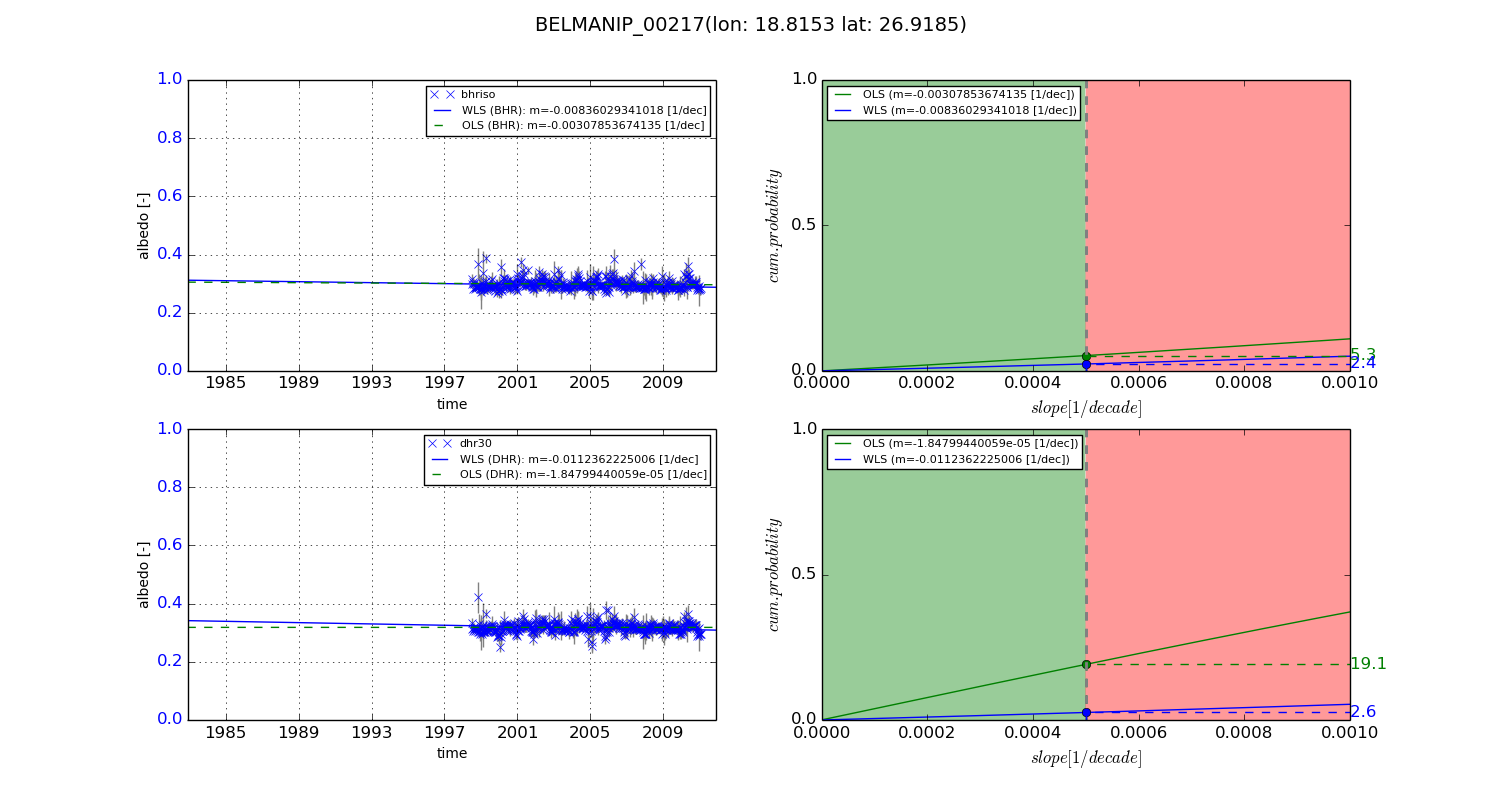
Temporal stability analysis

+000 deg (BHR)


BHR statistics

Temporal stability [1/decade]:


abs

rel


Weighted least square:

0.0017570062704


Ordinary least square:

-0.00396641334789


Probabilities that GCOS criteria is met:

Weighted least square:

0.0 %

Ordinary least square:

3.9 %


DHR statistics

Temporal stability [1/decade]:


abs

rel


Weighted least square:

4.66149994501e-05


Ordinary least square:

-0.00272776945982


Probabilities that GCOS criteria is met:

Weighted least square:

45.6 %

Ordinary least square:

5.6 %


+057/+063 deg (BHR)


BHR statistics

Temporal stability [1/decade]:


abs

rel


Weighted least square:

-0.00836029341018


Ordinary least square:

-0.00307853674135


Probabilities that GCOS criteria is met:

Weighted least square:

2.4 %

Ordinary least square:

5.3 %


DHR statistics

Temporal stability [1/decade]:


abs

rel


Weighted least square:

-0.0112362225006


Ordinary least square:

-1.84799440059e-05


Probabilities that GCOS criteria is met:

Weighted least square:

2.6 %

Ordinary least square:

19.1 %


Temporal anomaly analyis

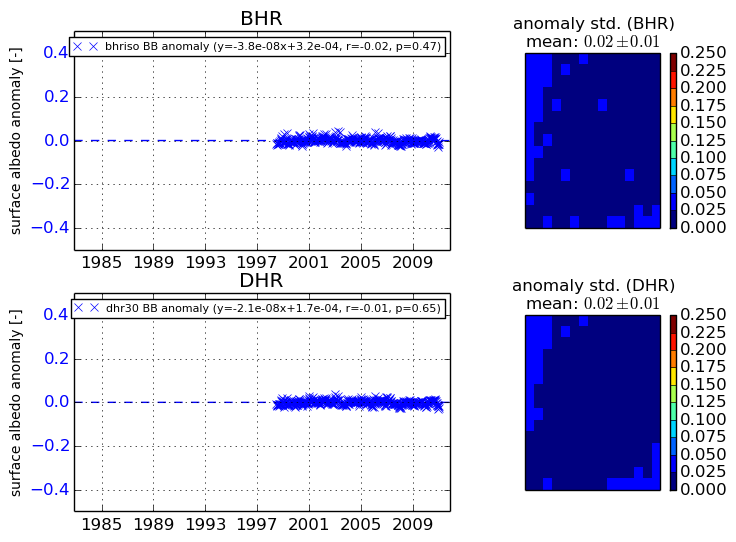
The variance of the temporal anomalies provides an additional measure about the stability of the signal AFTER removal of the mean seasonal cylce.
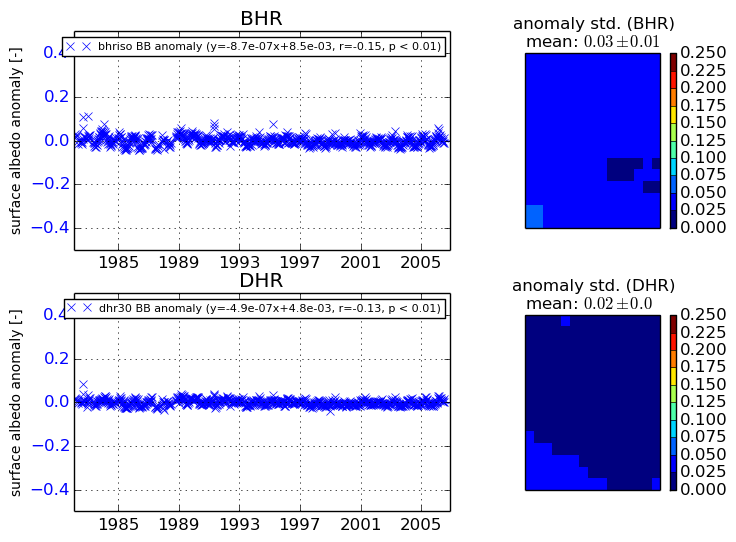
+000 deg


+057/+063 deg