BELMANIP_00218


Location

lon / lat [deg]: 8.7577 / 20.8836

Source network: BELMANIP


Geostationary surface albedo (GSA) data


“+000”


“+057/+063”


Landcover information (based on ESA CCI landcover data)


Landcover fractions @ 2km distance


Landcover fractions @ 20 km distance


Legend


Distance to open water bodies [km]:

none in region

Distance to urban areas [km]:

none in region


Radius: 1 km

Number of landcover classes:

1

Dominant landcover type:

200: bare areas

Fraction of dominant landcover type [%]:

100.0


Radius: 2 km

Number of landcover classes:

1

Dominant landcover type:

200: bare areas

Fraction of dominant landcover type [%]:

100.0


Radius: 5 km

Number of landcover classes:

1

Dominant landcover type:

200: bare areas

Fraction of dominant landcover type [%]:

100.0


Radius: 10 km

Number of landcover classes:

1

Dominant landcover type:

200: bare areas

Fraction of dominant landcover type [%]:

100.0


Radius: 20 km

Number of landcover classes:

1

Dominant landcover type:

200: bare areas

Fraction of dominant landcover type [%]:

100.0


Disturbances


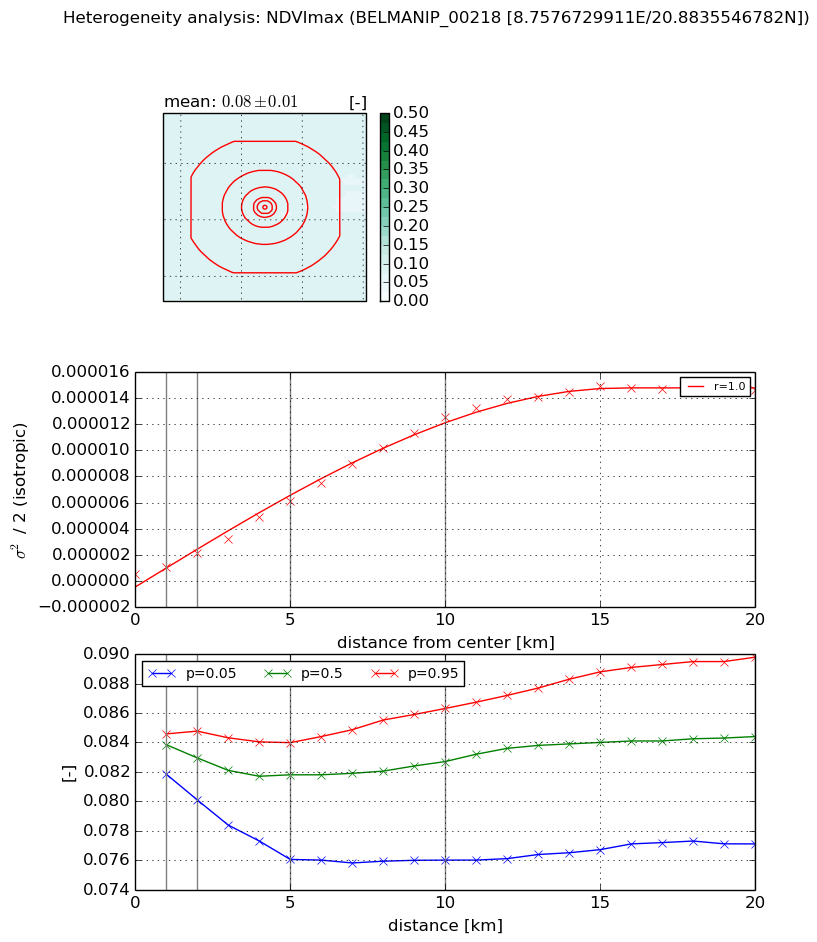
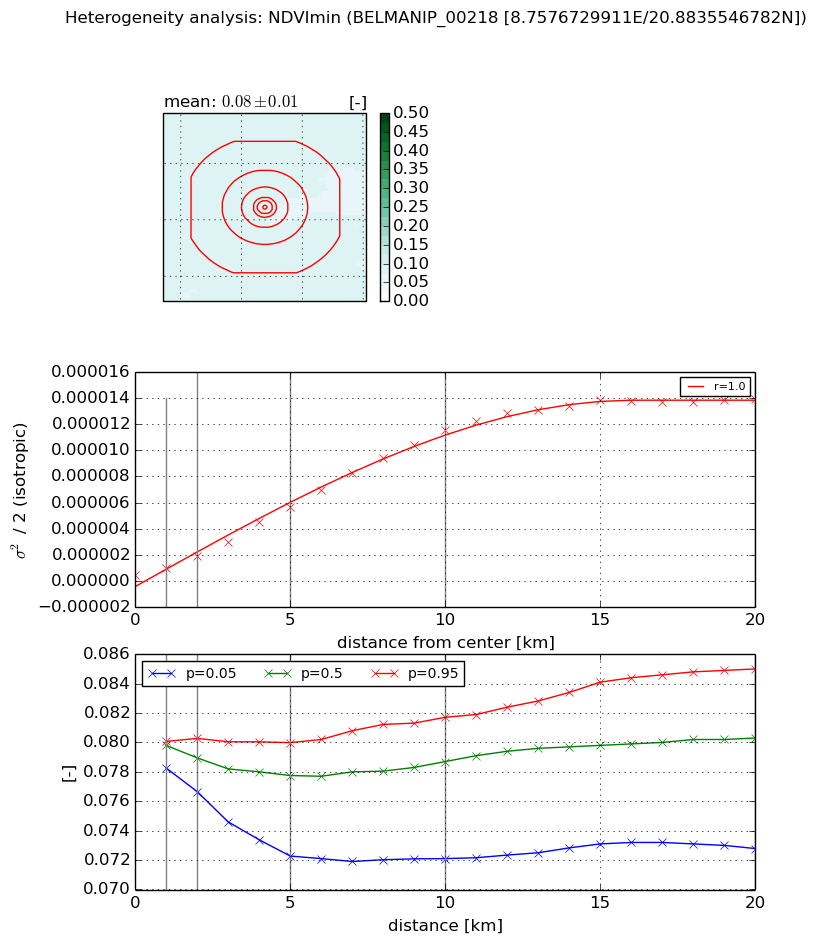
Heterogeneity analysis

The heterogeneity analysis provides information about the spatial and temporal heterogeneity of the site.

Topography


Roman et al. (2009) index


St

3.30369808496

Rcv

0.435476396201

Rse

0.0

Rst

-0.0729049550336

Rsv

0.399691942043


Height range @ 1km [m]

7

Height range @ 2km [m]

13

Height range @ 5km [m]

24

Height range @ 10km [m]

-999

Height range @ 20km [m]

-999


Variance slope @ 1 km

26

Variance slope @ 2 km

21

Variance slope @ 5 km

12

Variance slope @ 10 km

-999

Variance slope @ 20 km

-999


NDVI (max. NDVI composite)


Roman et al. (2009) index


St

0.963599144308

Rcv

0.280677409327

Rse

0.0

Rst

-0.496798924917

Rsv

2.33585146157


NDVI range @ 1km [-]

0.0

NDVI range @ 2km [-]

0.0

NDVI range @ 5km [-]

0.01

NDVI range @ 10km [-]

0.01

NDVI range @ 20km [-]

0.01


Variance slope @ 1 km

5.50440686955e-07

Variance slope @ 2 km

8.12107046677e-07

Variance slope @ 5 km

1.15495037752e-06

Variance slope @ 10 km

1.26477653282e-06

Variance slope @ 20 km

7.77539189811e-07


NDVI (min. NDVI composite)I


Roman et al. (2009) index


St

0.9403699841

Rcv

0.361693715001

Rse

0.0

Rst

-0.468042242729

Rsv

2.36049772765


NDVI range @ 1km [-]

0.0

NDVI range @ 2km [-]

0.0

NDVI range @ 5km [-]

0.01

NDVI range @ 10km [-]

0.01

NDVI range @ 20km [-]

0.01


NDVI slope @ 1 km

4.90105458558e-07

NDVI slope @ 2 km

7.38275896894e-07

NDVI slope @ 5 km

1.07392485385e-06

NDVI slope @ 10 km

1.16974324085e-06

NDVI slope @ 20 km

7.33119720351e-07


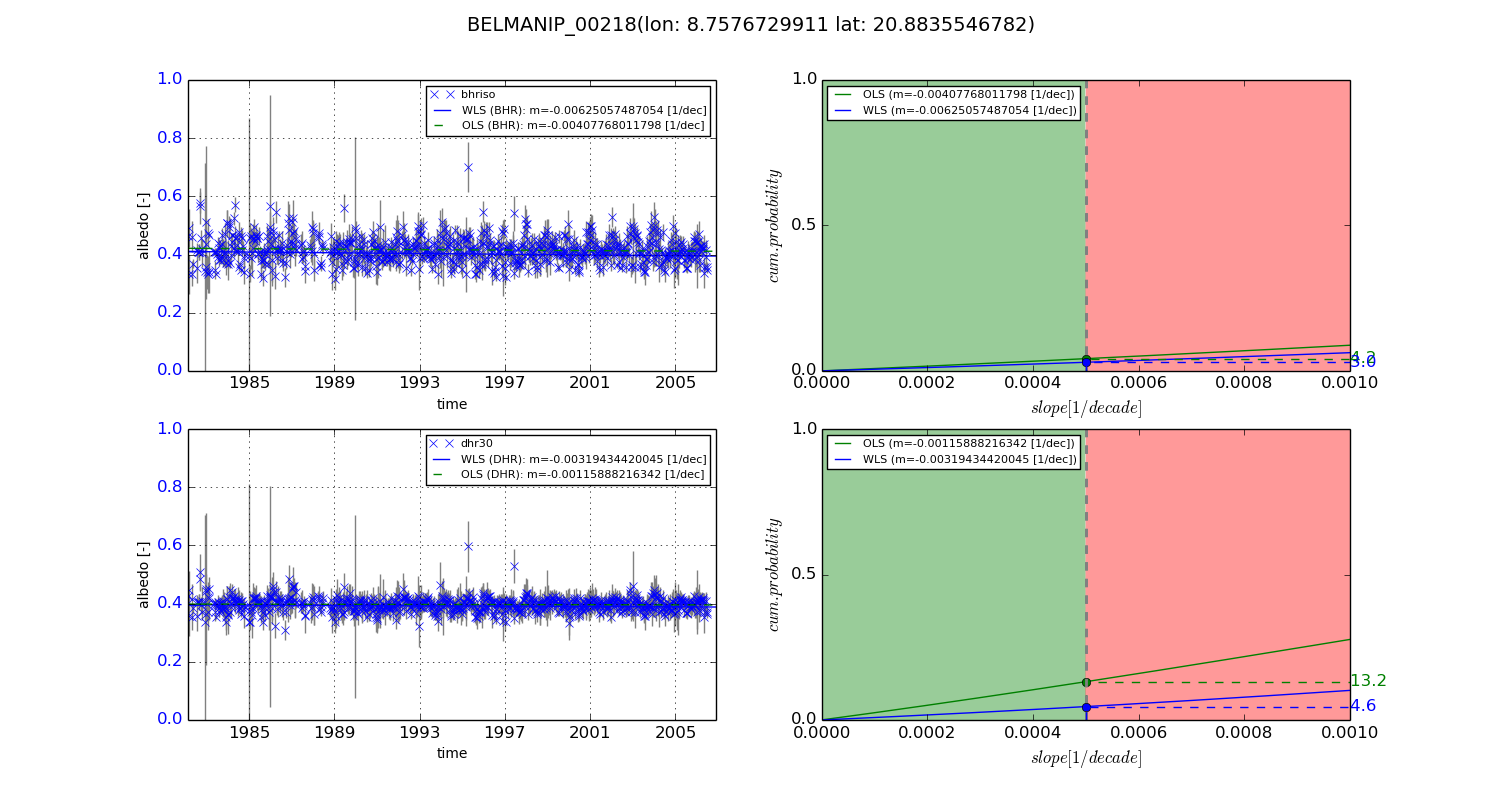
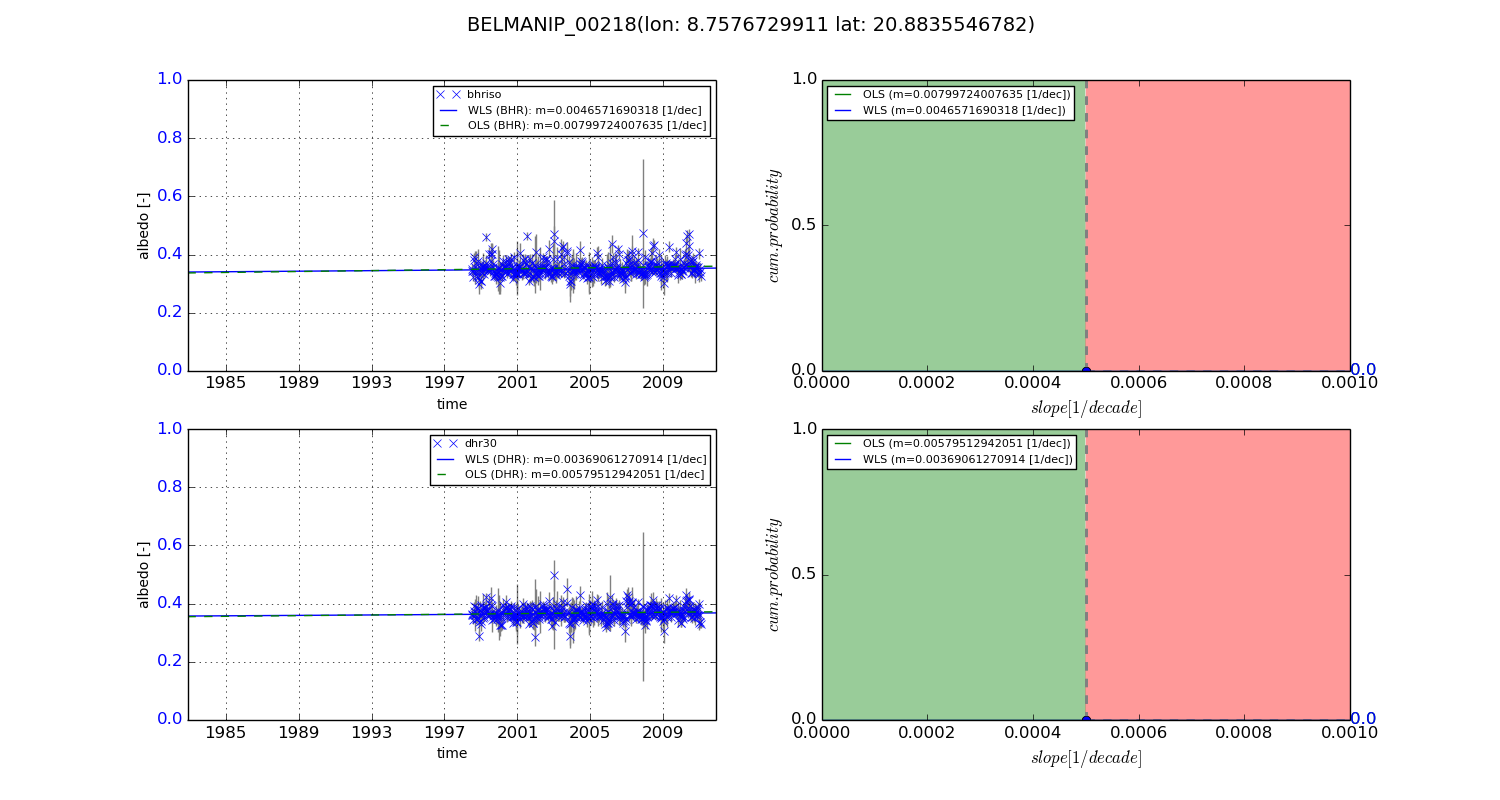
Temporal stability analysis

+000 deg (BHR)


BHR statistics

Temporal stability [1/decade]:


abs

rel


Weighted least square:

-0.00625057487054


Ordinary least square:

-0.00407768011798


Probabilities that GCOS criteria is met:

Weighted least square:

3.0 %

Ordinary least square:

4.2 %


DHR statistics

Temporal stability [1/decade]:


abs

rel


Weighted least square:

-0.00319434420045


Ordinary least square:

-0.00115888216342


Probabilities that GCOS criteria is met:

Weighted least square:

4.6 %

Ordinary least square:

13.2 %


+057/+063 deg (BHR)


BHR statistics

Temporal stability [1/decade]:


abs

rel


Weighted least square:

0.0046571690318


Ordinary least square:

0.00799724007635


Probabilities that GCOS criteria is met:

Weighted least square:

0.0 %

Ordinary least square:

0.0 %


DHR statistics

Temporal stability [1/decade]:


abs

rel


Weighted least square:

0.00369061270914


Ordinary least square:

0.00579512942051


Probabilities that GCOS criteria is met:

Weighted least square:

0.0 %

Ordinary least square:

0.0 %


Temporal anomaly analyis

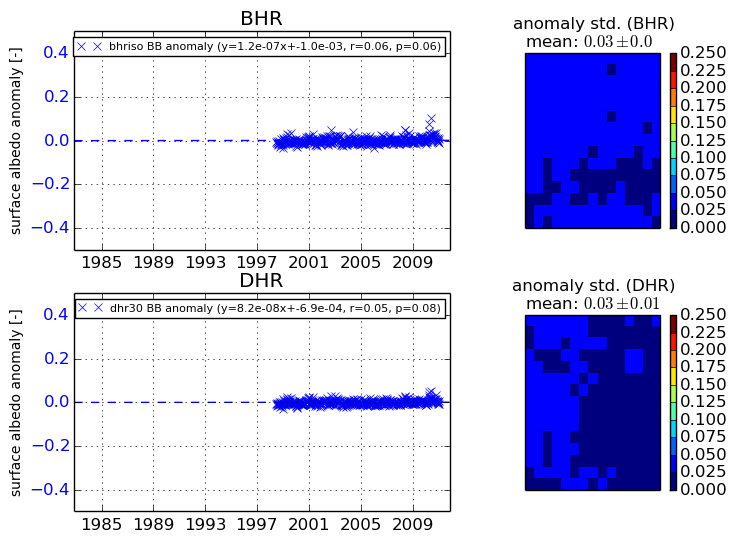
The variance of the temporal anomalies provides an additional measure about the stability of the signal AFTER removal of the mean seasonal cylce.
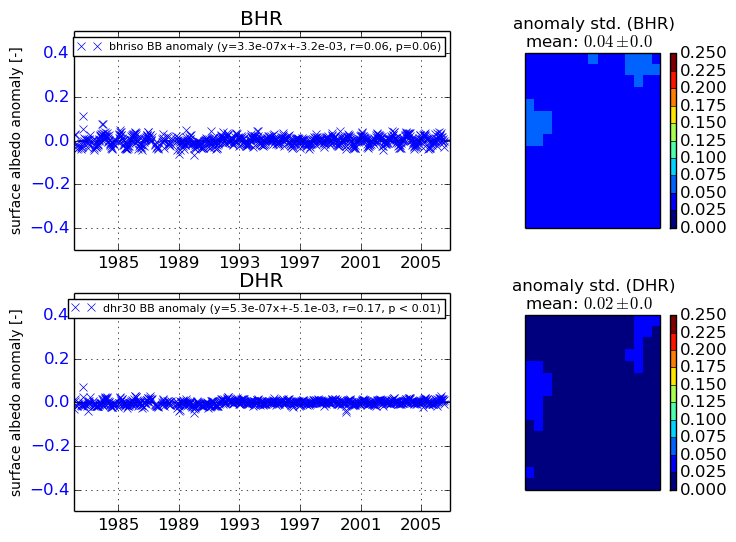
+000 deg


+057/+063 deg