BELMANIP_00221


Location

lon / lat [deg]: 34.325 / 24.069

Source network: BELMANIP


Geostationary surface albedo (GSA) data


“+000”


“+057/+063”


Landcover information (based on ESA CCI landcover data)


Landcover fractions @ 2km distance


Landcover fractions @ 20 km distance


Legend


Distance to open water bodies [km]:

none in region

Distance to urban areas [km]:

none in region


Radius: 1 km

Number of landcover classes:

1

Dominant landcover type:

200: bare areas

Fraction of dominant landcover type [%]:

100.0


Radius: 2 km

Number of landcover classes:

1

Dominant landcover type:

200: bare areas

Fraction of dominant landcover type [%]:

100.0


Radius: 5 km

Number of landcover classes:

1

Dominant landcover type:

200: bare areas

Fraction of dominant landcover type [%]:

100.0


Radius: 10 km

Number of landcover classes:

1

Dominant landcover type:

200: bare areas

Fraction of dominant landcover type [%]:

100.0


Radius: 20 km

Number of landcover classes:

1

Dominant landcover type:

200: bare areas

Fraction of dominant landcover type [%]:

100.0


Disturbances


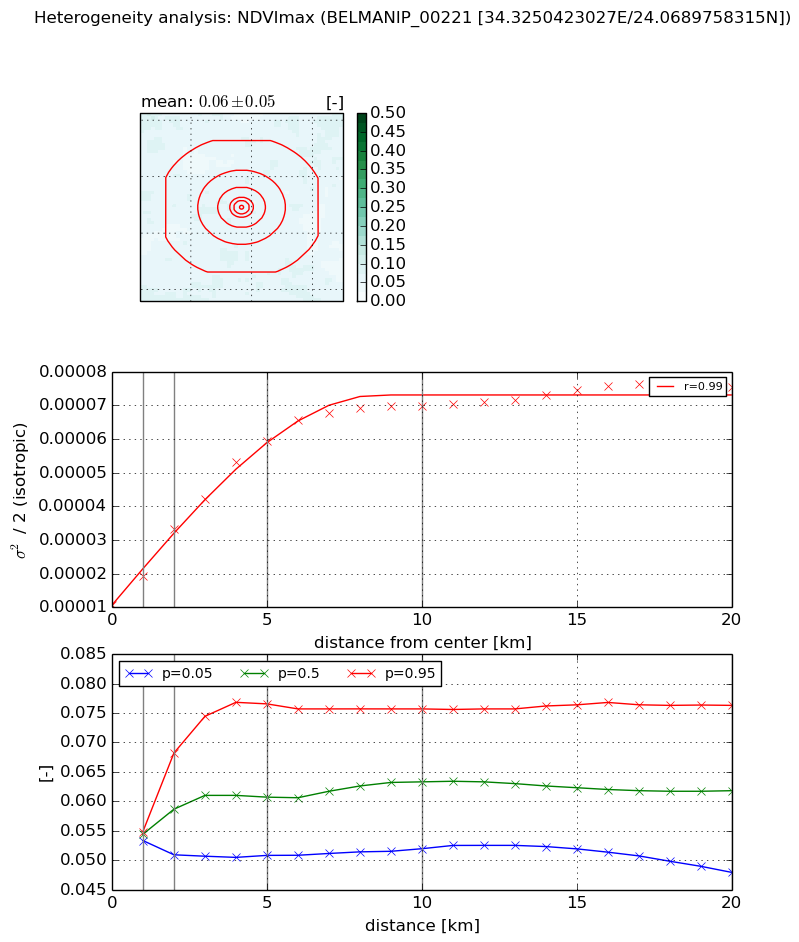
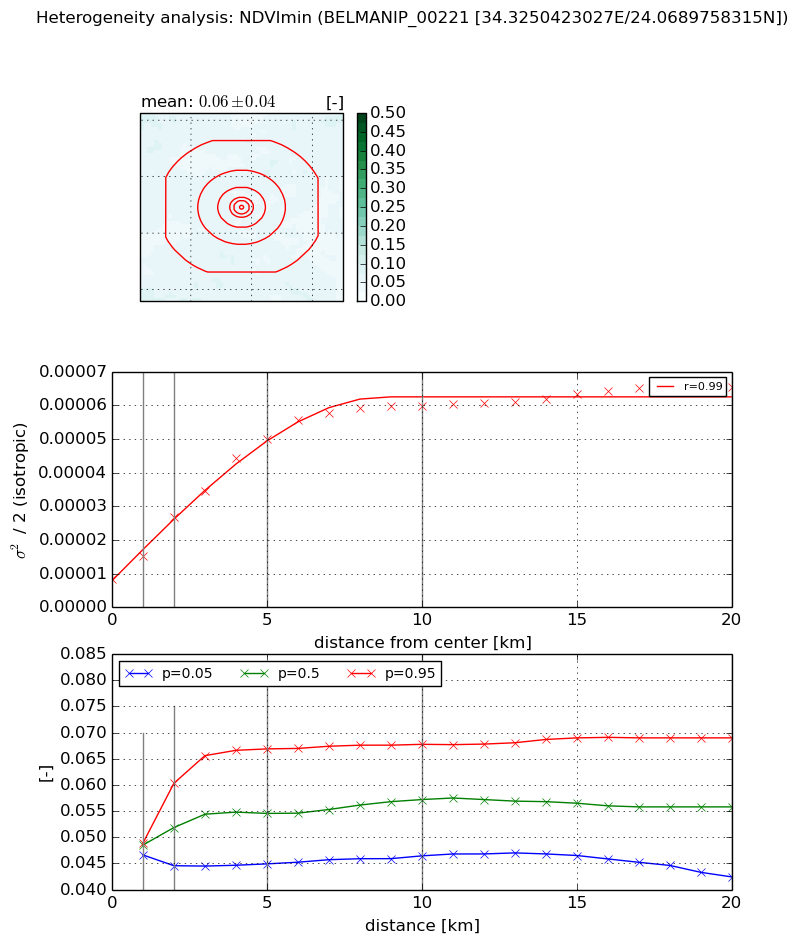
Heterogeneity analysis

The heterogeneity analysis provides information about the spatial and temporal heterogeneity of the site.

Topography


Roman et al. (2009) index


St

4.84411189879

Rcv

0.145549173052

Rse

0.0

Rst

-0.0169836186453

Rsv

0.456775775628


Height range @ 1km [m]

22

Height range @ 2km [m]

30

Height range @ 5km [m]

40

Height range @ 10km [m]

-999

Height range @ 20km [m]

-999


Variance slope @ 1 km

53

Variance slope @ 2 km

39

Variance slope @ 5 km

28

Variance slope @ 10 km

-999

Variance slope @ 20 km

-999


NDVI (max. NDVI composite)


Roman et al. (2009) index


St

6.54152536663e-07

Rcv

0.0133843818975

Rse

0.0

Rst

0.278593169

Rsv

4586086.02866


NDVI range @ 1km [-]

0.0

NDVI range @ 2km [-]

0.02

NDVI range @ 5km [-]

0.03

NDVI range @ 10km [-]

0.02

NDVI range @ 20km [-]

0.03


Variance slope @ 1 km

8.59837509652e-06

Variance slope @ 2 km

1.1287496346e-05

Variance slope @ 5 km

1.01122034965e-05

Variance slope @ 10 km

6.0728021771e-06

Variance slope @ 20 km

2.60618536311e-06


NDVI (min. NDVI composite)I


Roman et al. (2009) index


St

2.16790434381e-07

Rcv

-0.0209680951341

Rse

0.0

Rst

0.267528785716

Rsv

13838248.6571


NDVI range @ 1km [-]

0.0

NDVI range @ 2km [-]

0.02

NDVI range @ 5km [-]

0.02

NDVI range @ 10km [-]

0.02

NDVI range @ 20km [-]

0.03


NDVI slope @ 1 km

6.91111223294e-06

NDVI slope @ 2 km

9.15235753044e-06

NDVI slope @ 5 km

8.62734533115e-06

NDVI slope @ 10 km

5.3714555324e-06

NDVI slope @ 20 km

2.30273512234e-06


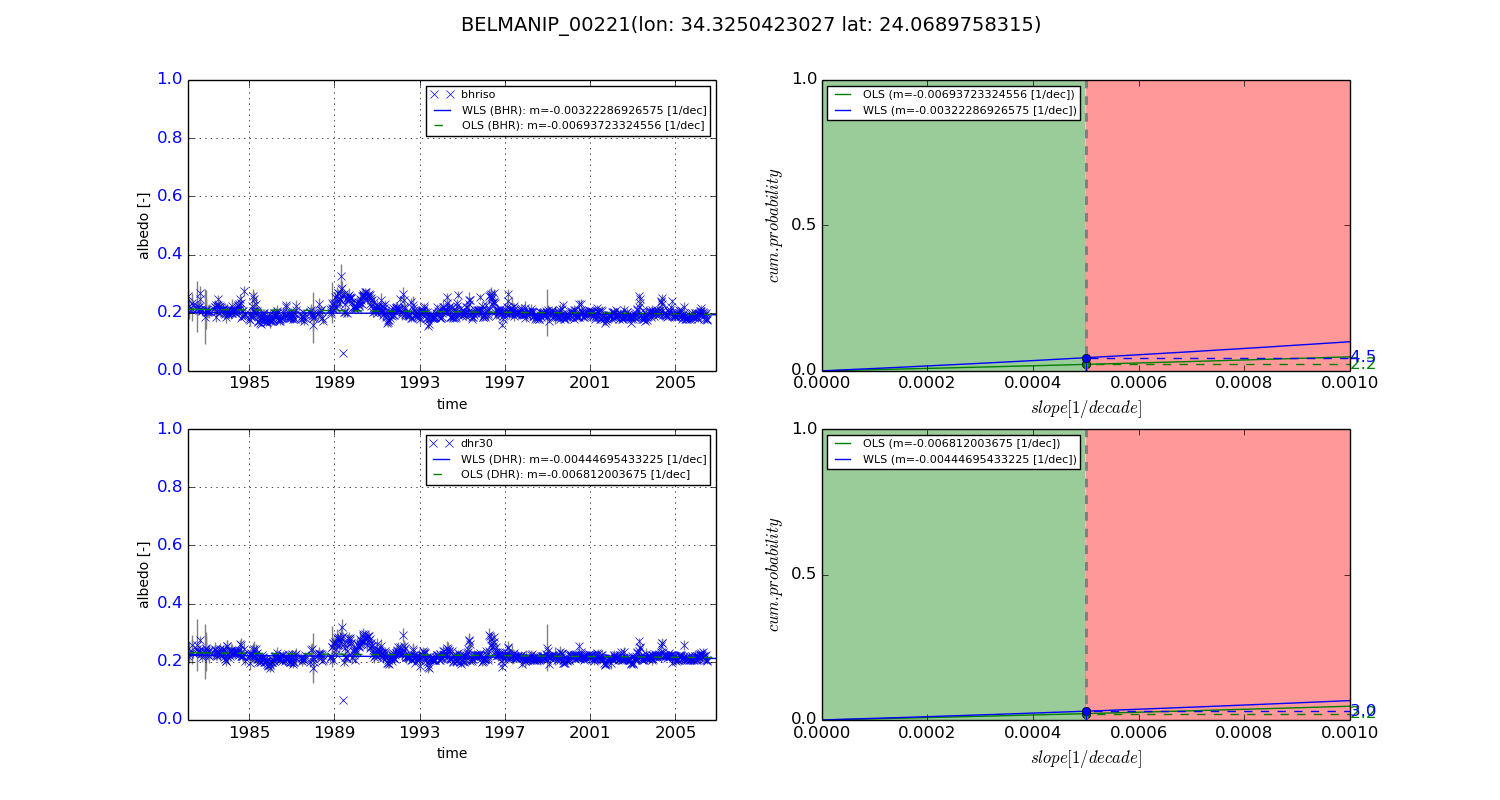
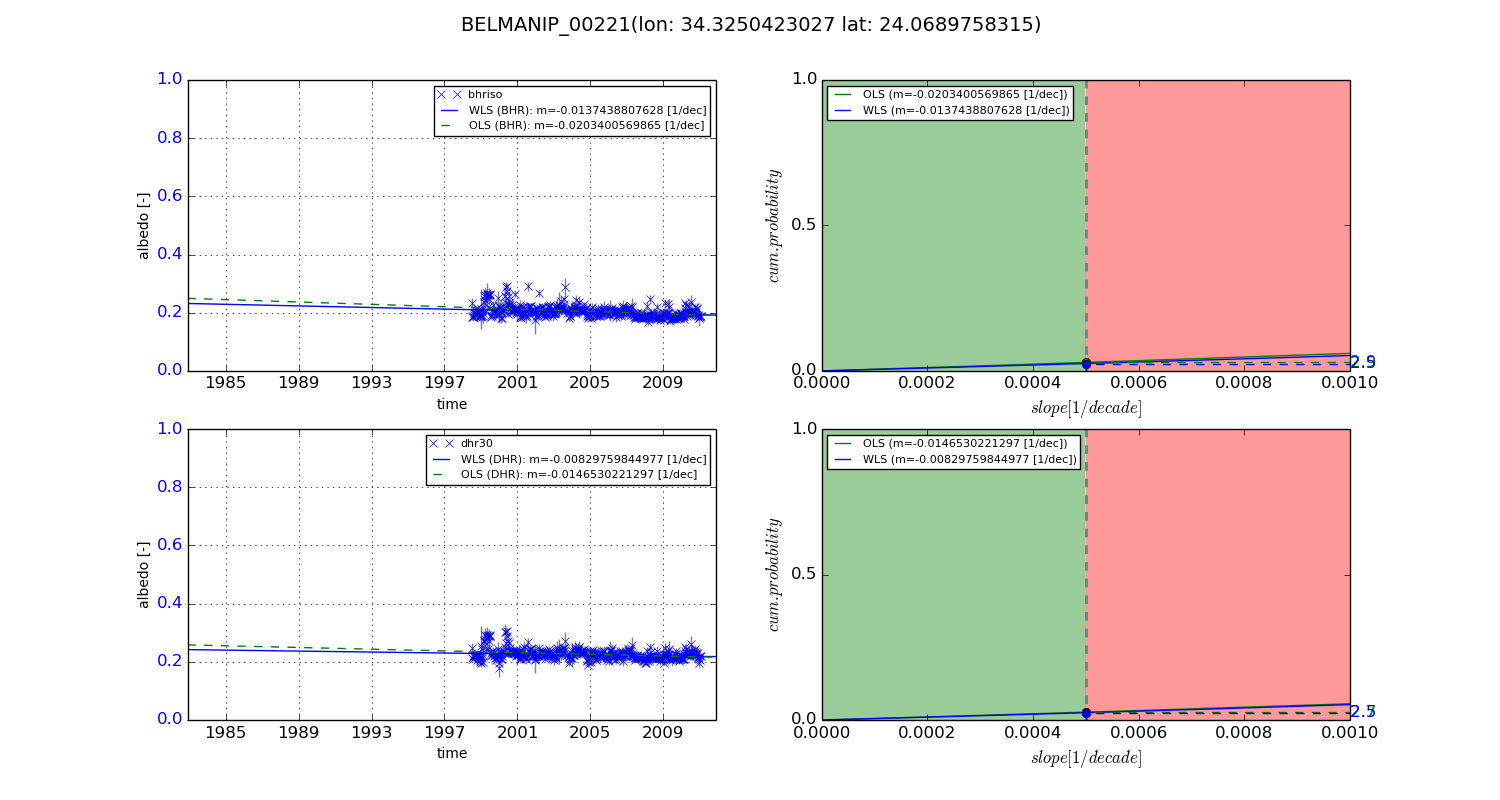
Temporal stability analysis

+000 deg (BHR)


BHR statistics

Temporal stability [1/decade]:


abs

rel


Weighted least square:

-0.00322286926575


Ordinary least square:

-0.00693723324556


Probabilities that GCOS criteria is met:

Weighted least square:

4.5 %

Ordinary least square:

2.2 %


DHR statistics

Temporal stability [1/decade]:


abs

rel


Weighted least square:

-0.00444695433225


Ordinary least square:

-0.006812003675


Probabilities that GCOS criteria is met:

Weighted least square:

3.0 %

Ordinary least square:

2.2 %


+057/+063 deg (BHR)


BHR statistics

Temporal stability [1/decade]:


abs

rel


Weighted least square:

-0.0137438807628


Ordinary least square:

-0.0203400569865


Probabilities that GCOS criteria is met:

Weighted least square:

2.5 %

Ordinary least square:

2.9 %


DHR statistics

Temporal stability [1/decade]:


abs

rel


Weighted least square:

-0.00829759844977


Ordinary least square:

-0.0146530221297


Probabilities that GCOS criteria is met:

Weighted least square:

2.5 %

Ordinary least square:

2.7 %


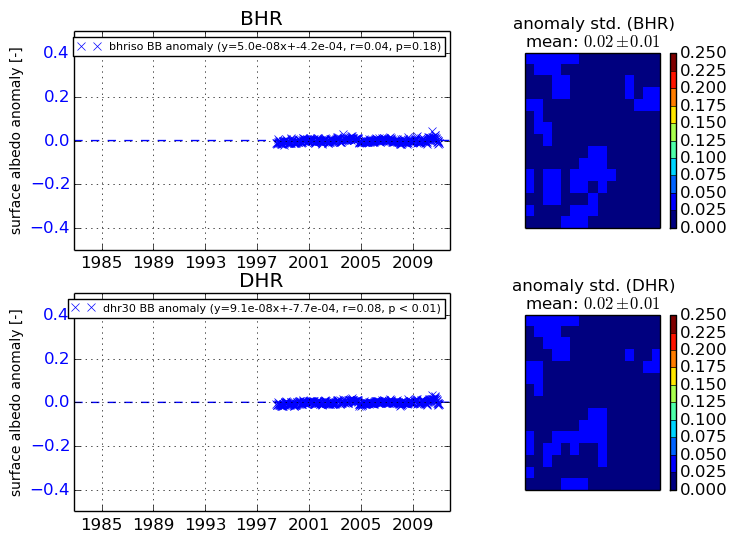
Temporal anomaly analyis

The variance of the temporal anomalies provides an additional measure about the stability of the signal AFTER removal of the mean seasonal cylce.
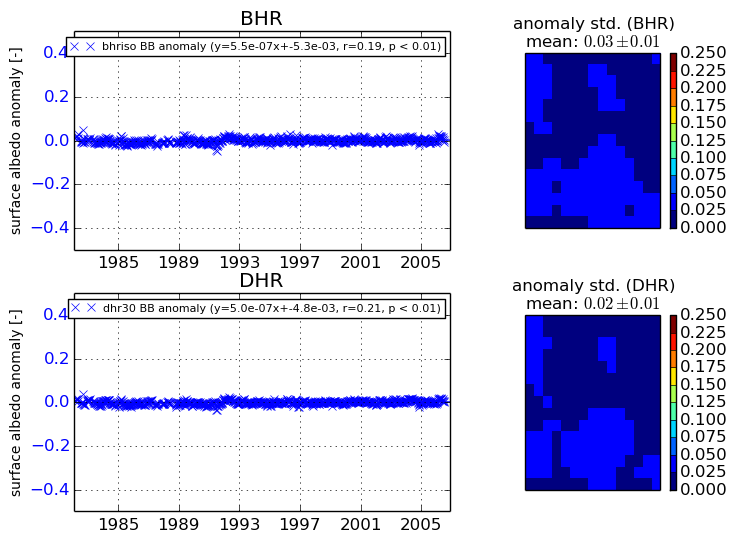
+000 deg


+057/+063 deg