BELMANIP_00223


Location

lon / lat [deg]: 6.5151 / 24.5751

Source network: BELMANIP


Geostationary surface albedo (GSA) data


“+000”


“+057/+063”


Landcover information (based on ESA CCI landcover data)


Landcover fractions @ 2km distance


Landcover fractions @ 20 km distance


Legend


Distance to open water bodies [km]:

none in region

Distance to urban areas [km]:

none in region


Radius: 1 km

Number of landcover classes:

1

Dominant landcover type:

200: bare areas

Fraction of dominant landcover type [%]:

100.0


Radius: 2 km

Number of landcover classes:

1

Dominant landcover type:

200: bare areas

Fraction of dominant landcover type [%]:

100.0


Radius: 5 km

Number of landcover classes:

1

Dominant landcover type:

200: bare areas

Fraction of dominant landcover type [%]:

100.0


Radius: 10 km

Number of landcover classes:

1

Dominant landcover type:

200: bare areas

Fraction of dominant landcover type [%]:

100.0


Radius: 20 km

Number of landcover classes:

1

Dominant landcover type:

200: bare areas

Fraction of dominant landcover type [%]:

100.0


Disturbances


Heterogeneity analysis

The heterogeneity analysis provides information about the spatial and temporal heterogeneity of the site.

Topography


Roman et al. (2009) index


St

0.949250047993

Rcv

0.283672764303

Rse

0.0

Rst

5.06025642087e-08

Rsv

2.87671680671


Height range @ 1km [m]

9

Height range @ 2km [m]

10

Height range @ 5km [m]

16

Height range @ 10km [m]

-999

Height range @ 20km [m]

-999


Variance slope @ 1 km

1

Variance slope @ 2 km

2

Variance slope @ 5 km

5

Variance slope @ 10 km

-999

Variance slope @ 20 km

-999


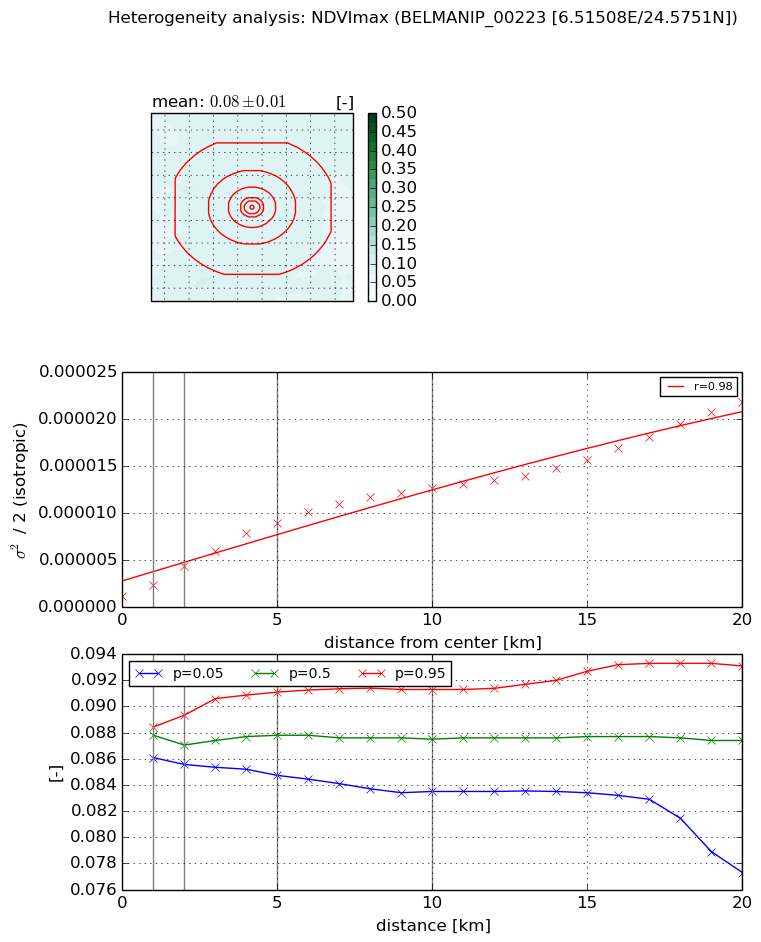
NDVI (max. NDVI composite)


Roman et al. (2009) index


St

1.96333714672

Rcv

0.213938303328

Rse

0.0

Rst

-0.11624152726

Rsv

1.19783078389


NDVI range @ 1km [-]

0.0

NDVI range @ 2km [-]

0.0

NDVI range @ 5km [-]

0.01

NDVI range @ 10km [-]

0.01

NDVI range @ 20km [-]

0.02


Variance slope @ 1 km

1.06676037555e-06

Variance slope @ 2 km

1.57836689322e-06

Variance slope @ 5 km

1.62878550779e-06

Variance slope @ 10 km

1.18651446326e-06

Variance slope @ 20 km

9.0700339807e-07


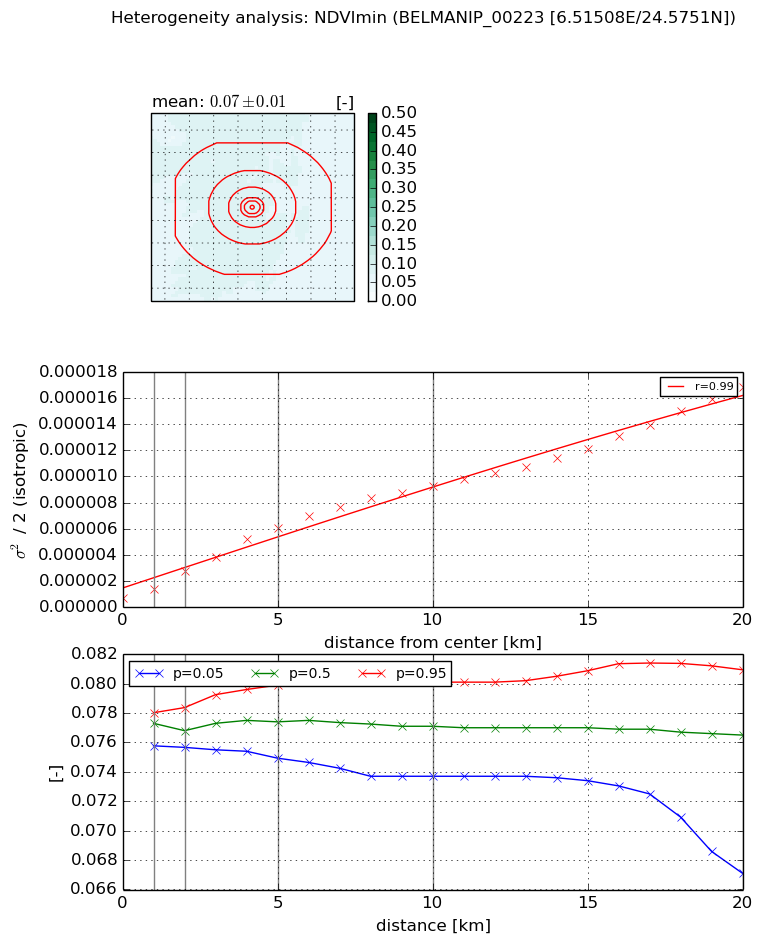
NDVI (min. NDVI composite)I


Roman et al. (2009) index


St

4.62096284091

Rcv

0.24538170562

Rse

0.0

Rst

-0.12192487369

Rsv

0.281908768937


NDVI range @ 1km [-]

0.0

NDVI range @ 2km [-]

0.0

NDVI range @ 5km [-]

0.0

NDVI range @ 10km [-]

0.01

NDVI range @ 20km [-]

0.01


NDVI slope @ 1 km

6.49204923595e-07

NDVI slope @ 2 km

1.01853711356e-06

NDVI slope @ 5 km

1.13224752009e-06

NDVI slope @ 10 km

8.95589622224e-07

NDVI slope @ 20 km

7.4035234776e-07


Temporal stability analysis

+000 deg (BHR)


BHR statistics

Temporal stability [1/decade]:


abs

rel


Weighted least square:

-0.0027156588018


Ordinary least square:

-0.00395300665045


Probabilities that GCOS criteria is met:

Weighted least square:

5.9 %

Ordinary least square:

4.1 %


DHR statistics

Temporal stability [1/decade]:


abs

rel


Weighted least square:

-0.00263823232464


Ordinary least square:

-0.000643985873162


Probabilities that GCOS criteria is met:

Weighted least square:

5.9 %

Ordinary least square:

18.3 %


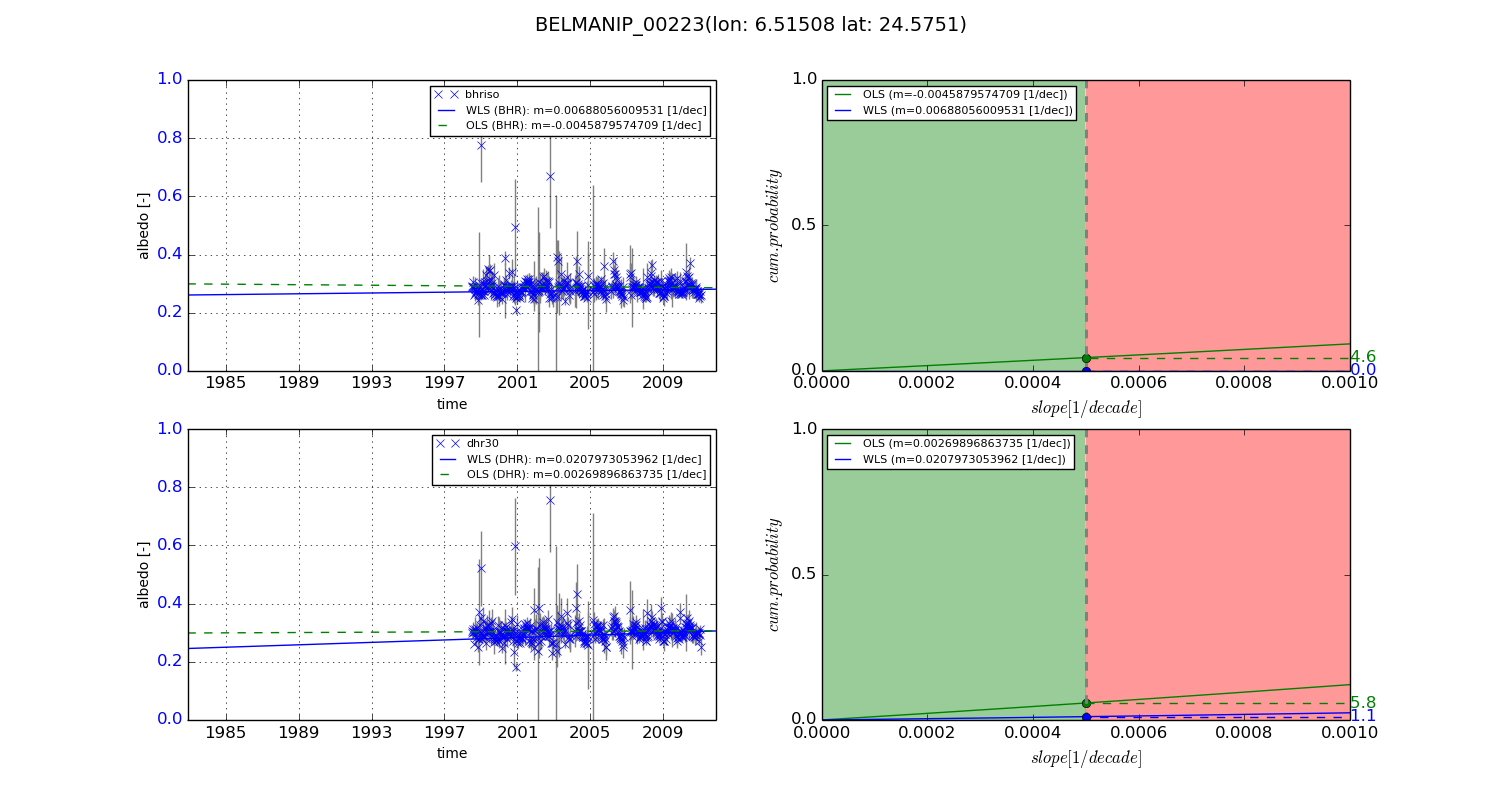
+057/+063 deg (BHR)


BHR statistics

Temporal stability [1/decade]:


abs

rel


Weighted least square:

0.00688056009531


Ordinary least square:

-0.0045879574709


Probabilities that GCOS criteria is met:

Weighted least square:

0.0 %

Ordinary least square:

4.6 %


DHR statistics

Temporal stability [1/decade]:


abs

rel


Weighted least square:

0.0207973053962


Ordinary least square:

0.00269896863735


Probabilities that GCOS criteria is met:

Weighted least square:

1.1 %

Ordinary least square:

5.8 %


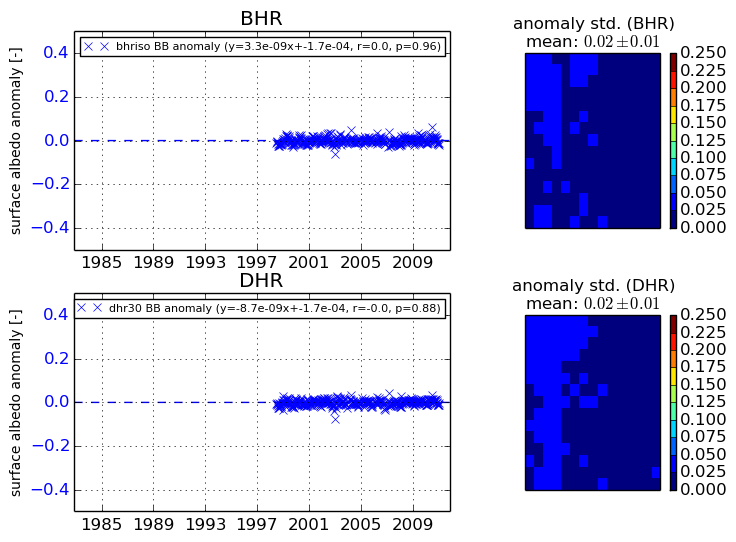
Temporal anomaly analyis

The variance of the temporal anomalies provides an additional measure about the stability of the signal AFTER removal of the mean seasonal cylce.
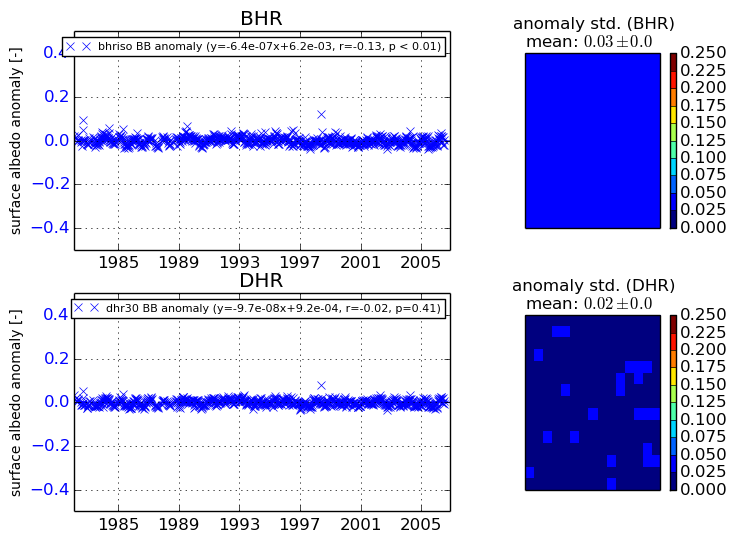
+000 deg


+057/+063 deg