BELMANIP_00224


Location

lon / lat [deg]: 59.0859 / 25.8796

Source network: BELMANIP


Geostationary surface albedo (GSA) data


“+000”


“+057/+063”


Landcover information (based on ESA CCI landcover data)


Landcover fractions @ 2km distance


Landcover fractions @ 20 km distance


Legend


Distance to open water bodies [km]:

30.49

Distance to urban areas [km]:

63.69


Radius: 1 km

Number of landcover classes:

1

Dominant landcover type:

200: bare areas

Fraction of dominant landcover type [%]:

100.0


Radius: 2 km

Number of landcover classes:

1

Dominant landcover type:

200: bare areas

Fraction of dominant landcover type [%]:

100.0


Radius: 5 km

Number of landcover classes:

1

Dominant landcover type:

200: bare areas

Fraction of dominant landcover type [%]:

100.0


Radius: 10 km

Number of landcover classes:

1

Dominant landcover type:

200: bare areas

Fraction of dominant landcover type [%]:

100.0


Radius: 20 km

Number of landcover classes:

1

Dominant landcover type:

200: bare areas

Fraction of dominant landcover type [%]:

100.0


Disturbances


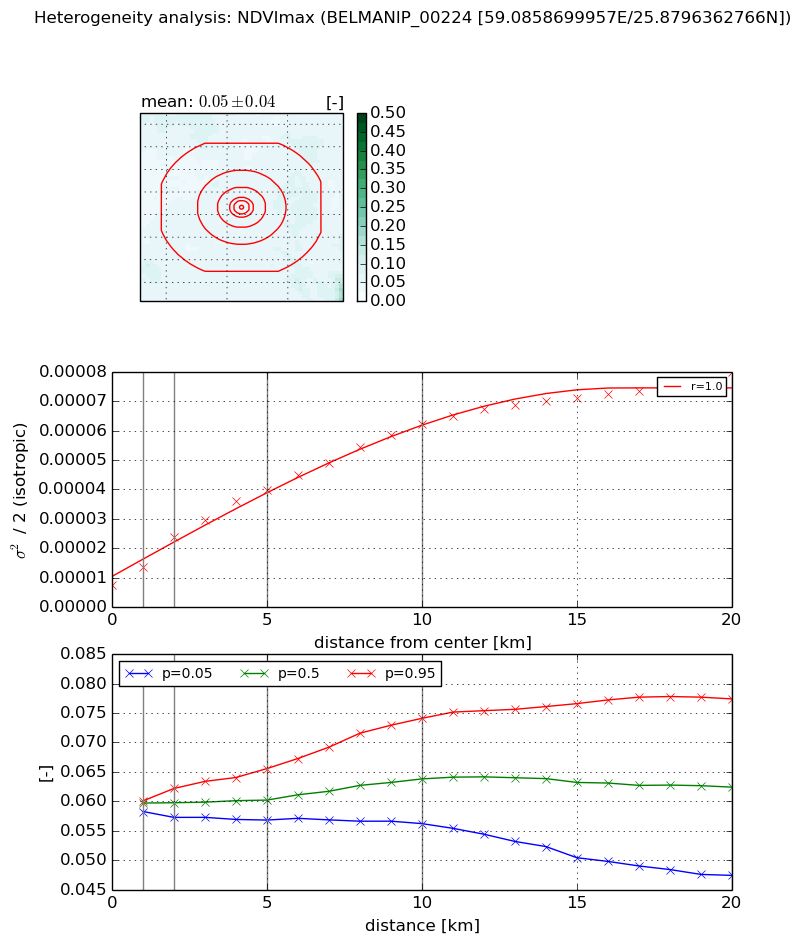
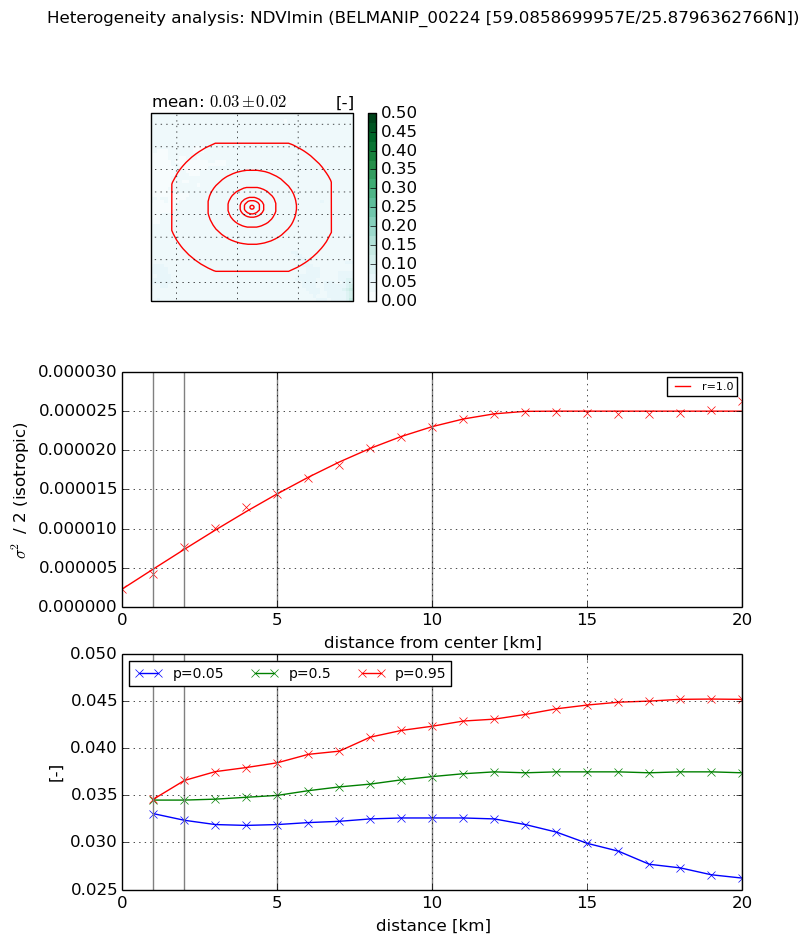
Heterogeneity analysis

The heterogeneity analysis provides information about the spatial and temporal heterogeneity of the site.

Topography


Roman et al. (2009) index


St

2.11908139742

Rcv

0.413663430026

Rse

0.0

Rst

0.00311746516075

Rsv

-0.998926875004


Height range @ 1km [m]

17

Height range @ 2km [m]

23

Height range @ 5km [m]

42

Height range @ 10km [m]

-999

Height range @ 20km [m]

-999


Variance slope @ 1 km

28

Variance slope @ 2 km

27

Variance slope @ 5 km

38

Variance slope @ 10 km

-999

Variance slope @ 20 km

-999


NDVI (max. NDVI composite)


Roman et al. (2009) index


St

4.25009661979

Rcv

0.364419559395

Rse

0.0

Rst

-1.31686266489e-08

Rsv

-0.341446733164


NDVI range @ 1km [-]

0.0

NDVI range @ 2km [-]

0.0

NDVI range @ 5km [-]

0.01

NDVI range @ 10km [-]

0.02

NDVI range @ 20km [-]

0.03


Variance slope @ 1 km

6.15857035044e-06

Variance slope @ 2 km

8.12449724319e-06

Variance slope @ 5 km

6.72726844934e-06

Variance slope @ 10 km

5.38163187917e-06

Variance slope @ 20 km

3.34155744058e-06


NDVI (min. NDVI composite)I


Roman et al. (2009) index


St

9.21798086909e-07

Rcv

0.109733977615

Rse

0.0

Rst

0.00877727061394

Rsv

3254508.69704


NDVI range @ 1km [-]

0.0

NDVI range @ 2km [-]

0.0

NDVI range @ 5km [-]

0.01

NDVI range @ 10km [-]

0.01

NDVI range @ 20km [-]

0.02


NDVI slope @ 1 km

1.99253011866e-06

NDVI slope @ 2 km

2.72393438624e-06

NDVI slope @ 5 km

2.5274684068e-06

NDVI slope @ 10 km

2.0994413383e-06

NDVI slope @ 20 km

1.10898385318e-06


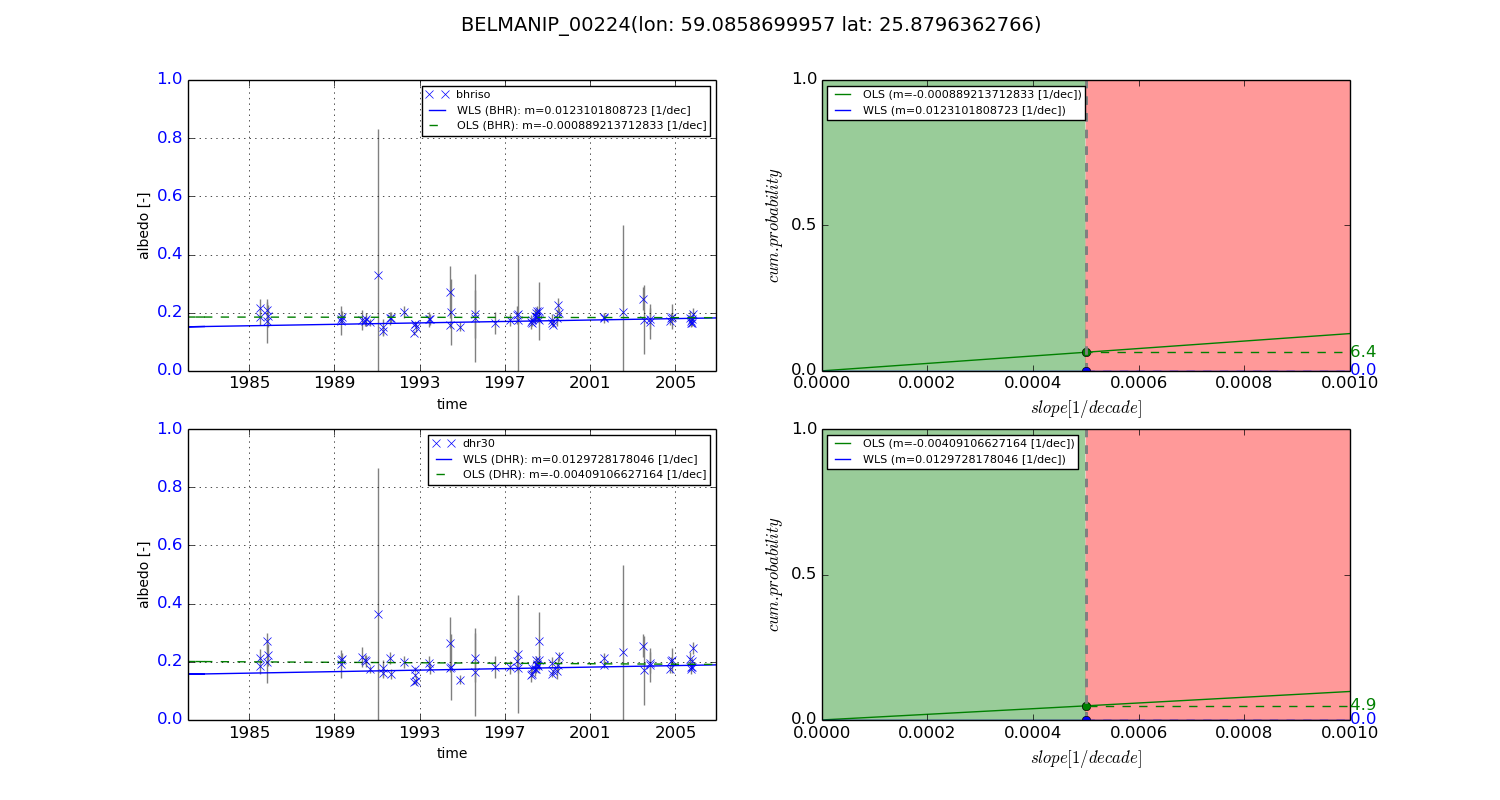
Temporal stability analysis

+000 deg (BHR)


BHR statistics

Temporal stability [1/decade]:


abs

rel


Weighted least square:

0.0123101808723


Ordinary least square:

-0.000889213712833


Probabilities that GCOS criteria is met:

Weighted least square:

0.0 %

Ordinary least square:

6.4 %


DHR statistics

Temporal stability [1/decade]:


abs

rel


Weighted least square:

0.0129728178046


Ordinary least square:

-0.00409106627164


Probabilities that GCOS criteria is met:

Weighted least square:

0.0 %

Ordinary least square:

4.9 %


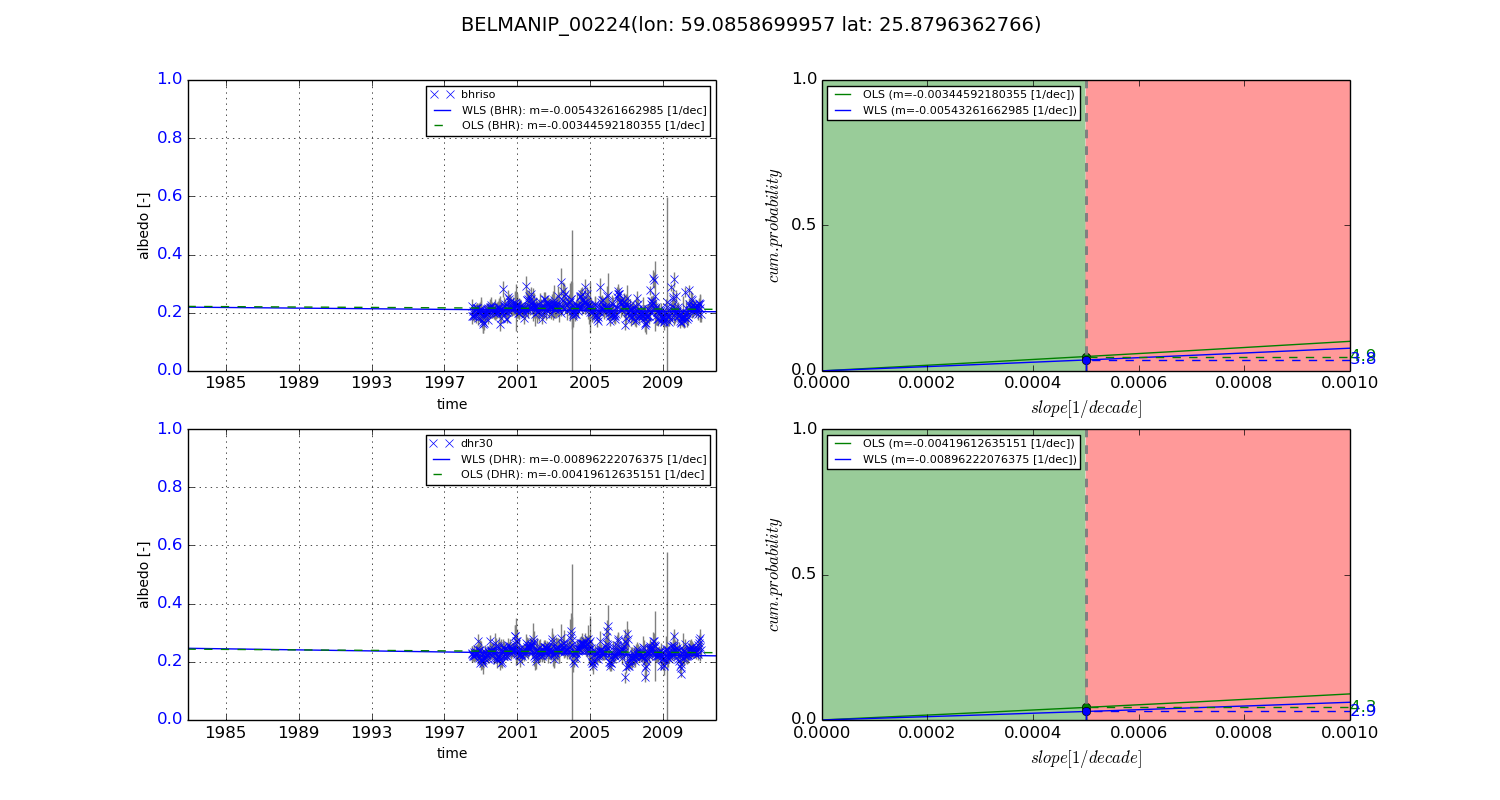
+057/+063 deg (BHR)


BHR statistics

Temporal stability [1/decade]:


abs

rel


Weighted least square:

-0.00543261662985


Ordinary least square:

-0.00344592180355


Probabilities that GCOS criteria is met:

Weighted least square:

3.8 %

Ordinary least square:

4.9 %


DHR statistics

Temporal stability [1/decade]:


abs

rel


Weighted least square:

-0.00896222076375


Ordinary least square:

-0.00419612635151


Probabilities that GCOS criteria is met:

Weighted least square:

2.9 %

Ordinary least square:

4.3 %


Temporal anomaly analyis

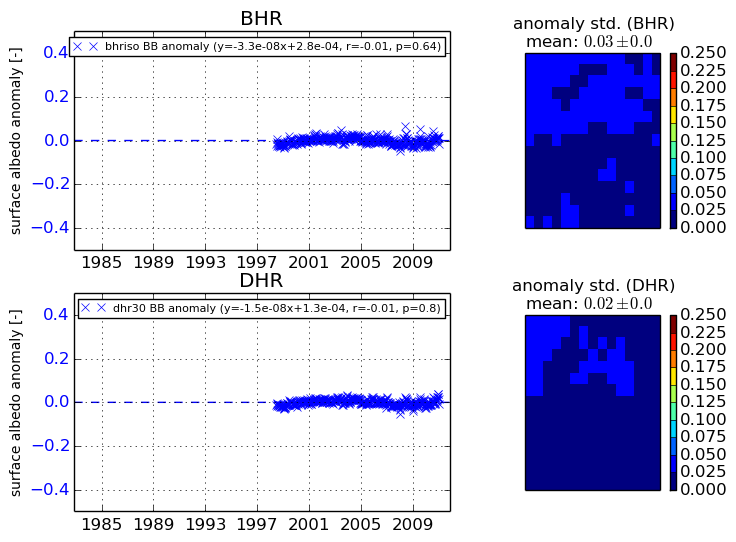
The variance of the temporal anomalies provides an additional measure about the stability of the signal AFTER removal of the mean seasonal cylce.
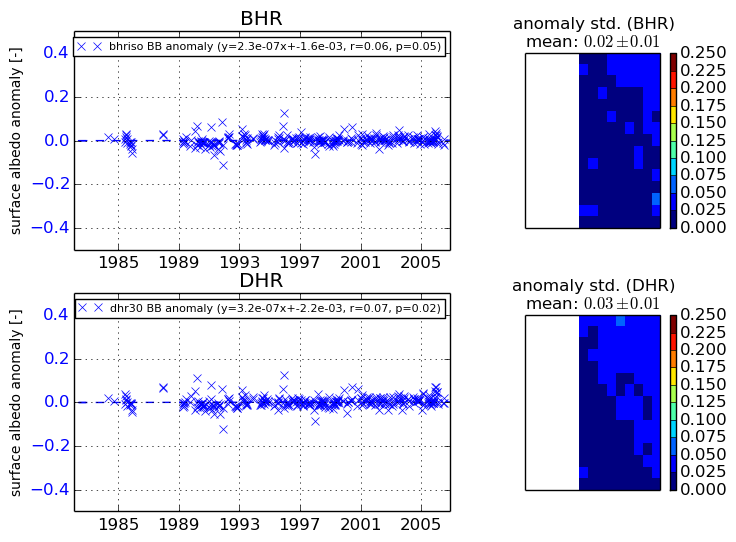
+000 deg


+057/+063 deg