BELMANIP_00225


Location

lon / lat [deg]: -1.0015 / 35.0917

Source network: BELMANIP


Geostationary surface albedo (GSA) data


“+000”


“+057/+063”


Landcover information (based on ESA CCI landcover data)


Landcover fractions @ 2km distance


Landcover fractions @ 20 km distance


Legend


Distance to open water bodies [km]:

9.15

Distance to urban areas [km]:

15.0


Radius: 1 km

Number of landcover classes:

1

Dominant landcover type:

10: cropland, rainfed

Fraction of dominant landcover type [%]:

100.0


Radius: 2 km

Number of landcover classes:

1

Dominant landcover type:

10: cropland, rainfed

Fraction of dominant landcover type [%]:

100.0


Radius: 5 km

Number of landcover classes:

1

Dominant landcover type:

10: cropland, rainfed

Fraction of dominant landcover type [%]:

100.0


Radius: 10 km

Number of landcover classes:

1

Dominant landcover type:

10: cropland, rainfed

Fraction of dominant landcover type [%]:

100.0


Radius: 20 km

Number of landcover classes:

2

Dominant landcover type:

10: cropland, rainfed

Fraction of dominant landcover type [%]:

97.0


Disturbances


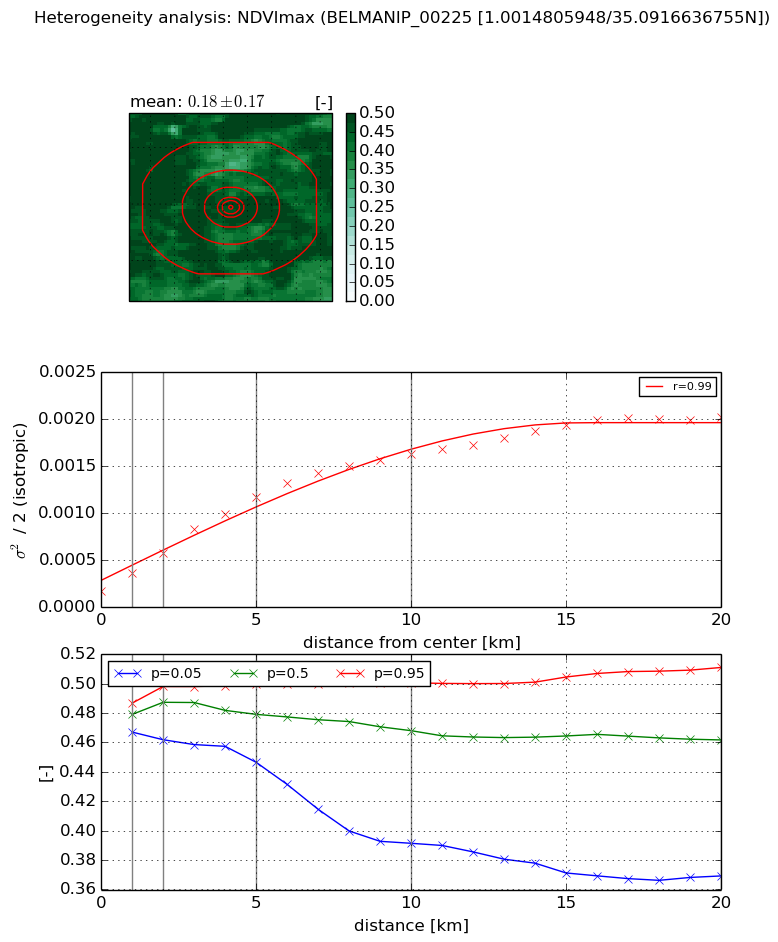
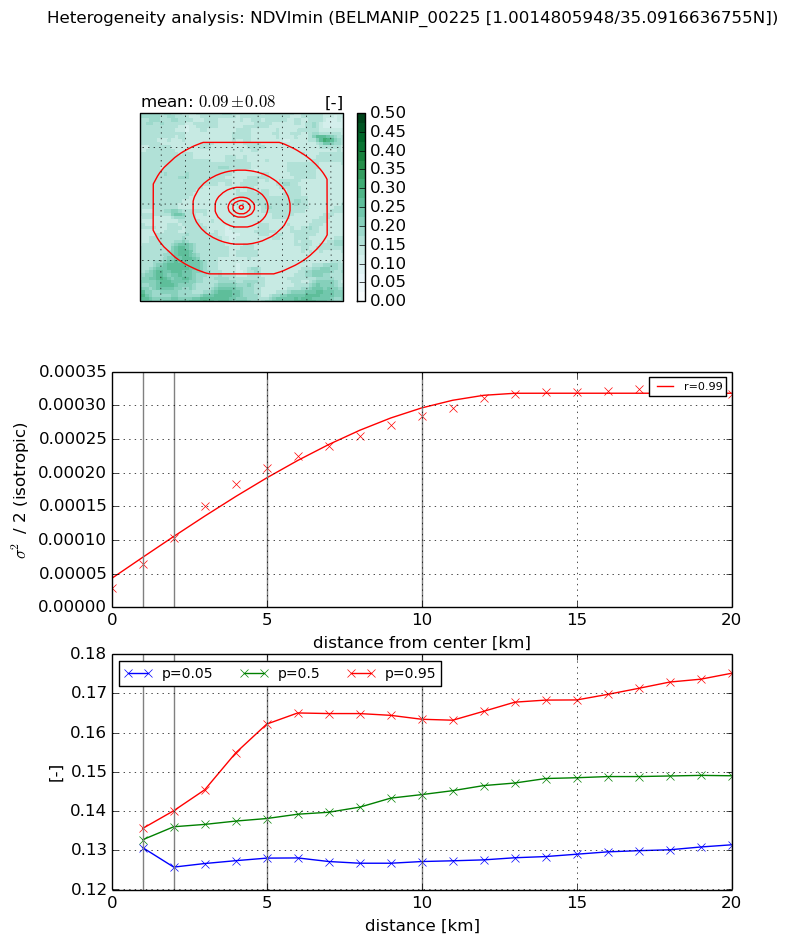
Heterogeneity analysis

The heterogeneity analysis provides information about the spatial and temporal heterogeneity of the site.

Topography


Roman et al. (2009) index


St

0.00867159538382

Rcv

0.837738475083

Rse

0.0

Rst

9.09327930478e-07

Rsv

345.119361612


Height range @ 1km [m]

82

Height range @ 2km [m]

94

Height range @ 5km [m]

209

Height range @ 10km [m]

-999

Height range @ 20km [m]

-999


Variance slope @ 1 km

1029

Variance slope @ 2 km

962

Variance slope @ 5 km

943

Variance slope @ 10 km

-999

Variance slope @ 20 km

-999


NDVI (max. NDVI composite)


Roman et al. (2009) index


St

9.95391409373e-06

Rcv

0.671235182702

Rse

0.0

Rst

0.106526382228

Rsv

301388.200659


NDVI range @ 1km [-]

0.02

NDVI range @ 2km [-]

0.04

NDVI range @ 5km [-]

0.05

NDVI range @ 10km [-]

0.11

NDVI range @ 20km [-]

0.14


Variance slope @ 1 km

0.000189078500044

Variance slope @ 2 km

0.00020216616079

Variance slope @ 5 km

0.00020216094596

Variance slope @ 10 km

0.000148459889774

Variance slope @ 20 km

8.6220786698e-05


NDVI (min. NDVI composite)I


Roman et al. (2009) index


St

3.72978076078e-09

Rcv

0.750134575896

Rse

0.0

Rst

0.0787264310001

Rsv

804336820.13


NDVI range @ 1km [-]

0.0

NDVI range @ 2km [-]

0.01

NDVI range @ 5km [-]

0.03

NDVI range @ 10km [-]

0.04

NDVI range @ 20km [-]

0.04


NDVI slope @ 1 km

3.50357475171e-05

NDVI slope @ 2 km

3.73630658148e-05

NDVI slope @ 5 km

3.71436231947e-05

NDVI slope @ 10 km

2.53481091033e-05

NDVI slope @ 20 km

1.33909201238e-05


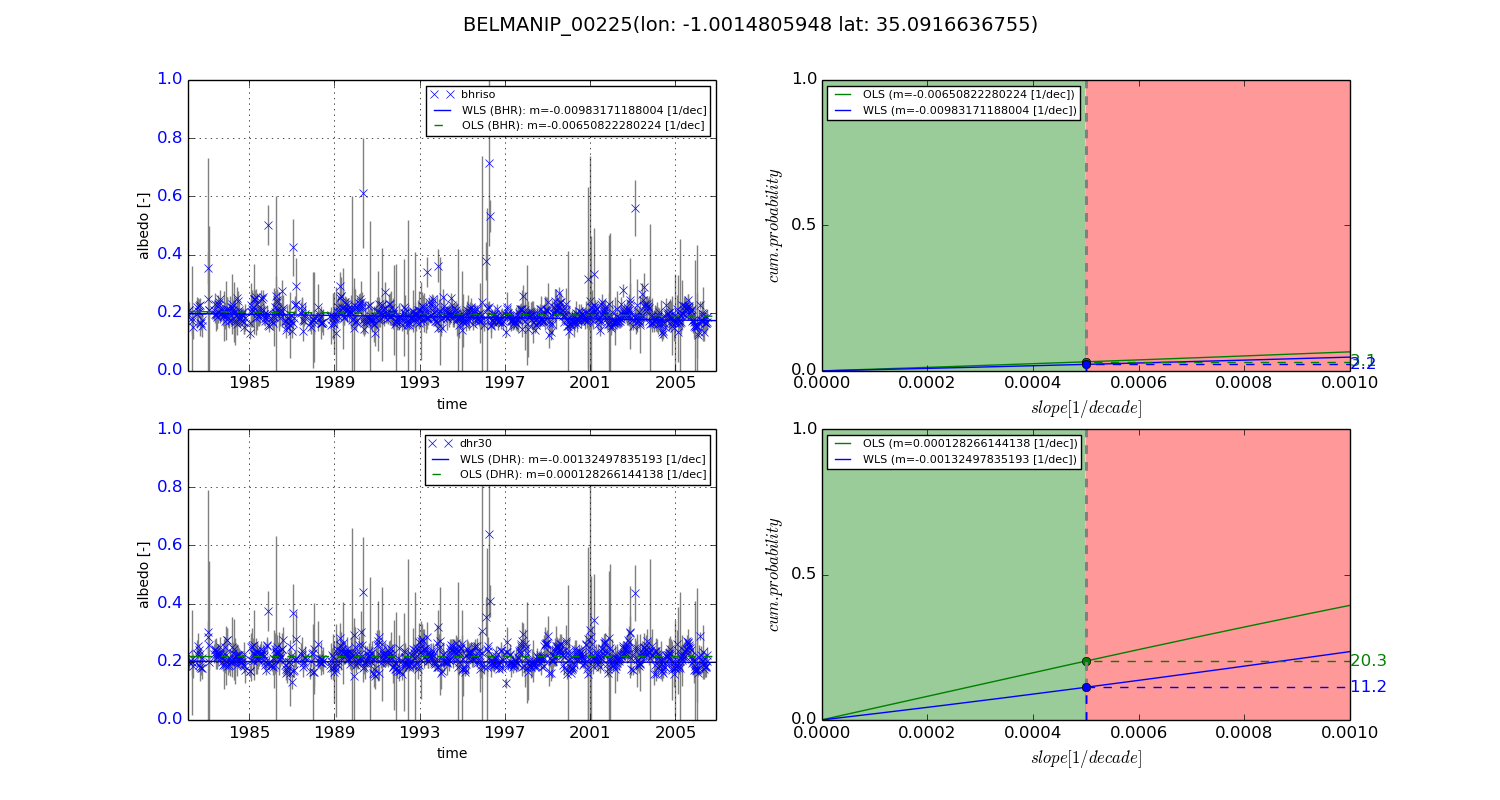
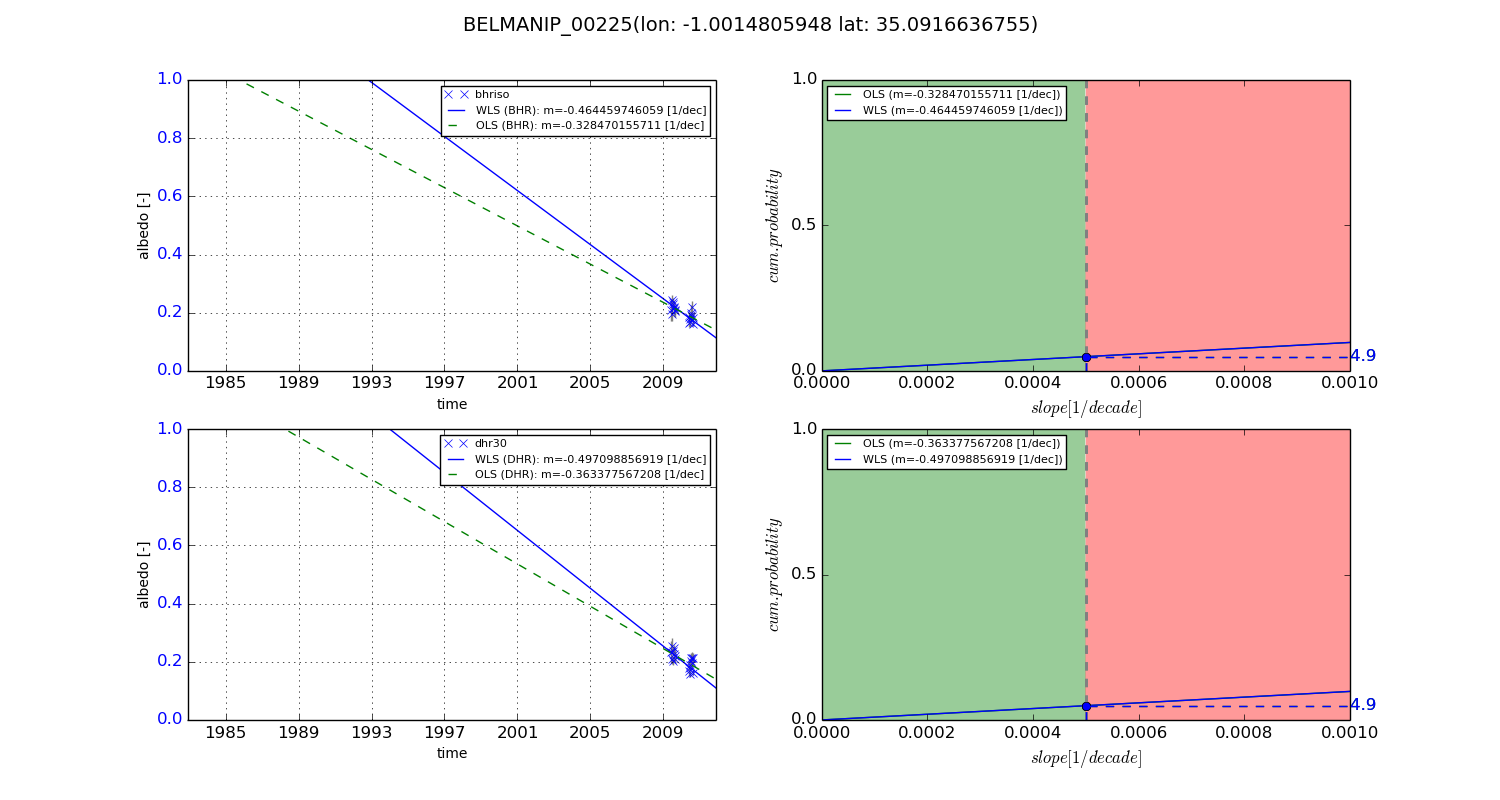
Temporal stability analysis

+000 deg (BHR)


BHR statistics

Temporal stability [1/decade]:


abs

rel


Weighted least square:

-0.00983171188004


Ordinary least square:

-0.00650822280224


Probabilities that GCOS criteria is met:

Weighted least square:

2.2 %

Ordinary least square:

3.1 %


DHR statistics

Temporal stability [1/decade]:


abs

rel


Weighted least square:

-0.00132497835193


Ordinary least square:

0.000128266144138


Probabilities that GCOS criteria is met:

Weighted least square:

11.2 %

Ordinary least square:

20.3 %


+057/+063 deg (BHR)


BHR statistics

Temporal stability [1/decade]:


abs

rel


Weighted least square:

-0.464459746059


Ordinary least square:

-0.328470155711


Probabilities that GCOS criteria is met:

Weighted least square:

4.9 %

Ordinary least square:

4.9 %


DHR statistics

Temporal stability [1/decade]:


abs

rel


Weighted least square:

-0.497098856919


Ordinary least square:

-0.363377567208


Probabilities that GCOS criteria is met:

Weighted least square:

4.9 %

Ordinary least square:

4.9 %


Temporal anomaly analyis

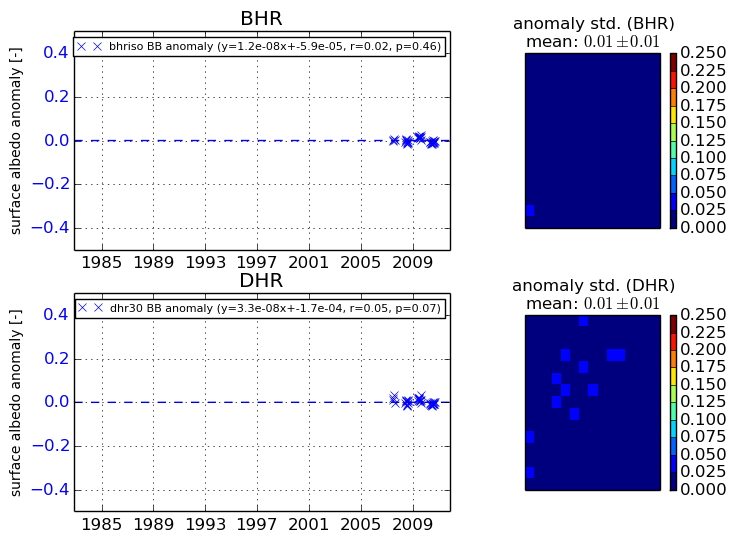
The variance of the temporal anomalies provides an additional measure about the stability of the signal AFTER removal of the mean seasonal cylce.
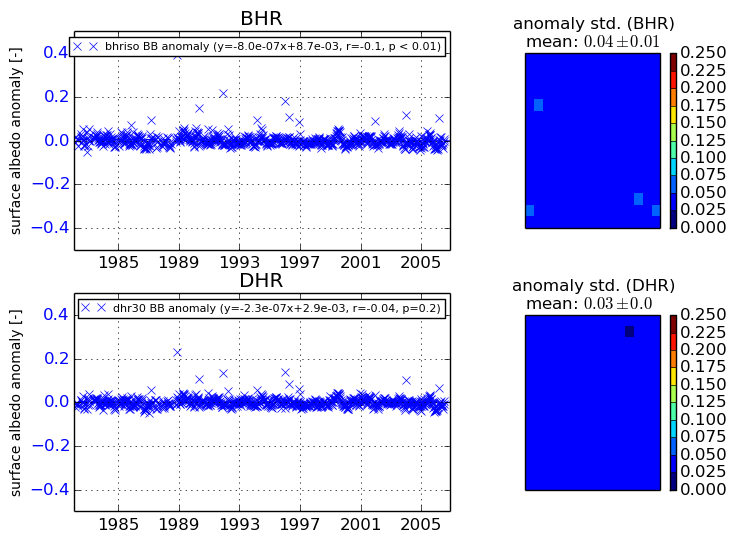
+000 deg


+057/+063 deg