BELMANIP_00226


Location

lon / lat [deg]: 40.9387 / 37.4891

Source network: BELMANIP


Geostationary surface albedo (GSA) data


“+000”


“+057/+063”


Landcover information (based on ESA CCI landcover data)


Landcover fractions @ 2km distance


Landcover fractions @ 20 km distance


Legend


Distance to open water bodies [km]:

32.49

Distance to urban areas [km]:

2.64


Radius: 1 km

Number of landcover classes:

1

Dominant landcover type:

10: cropland, rainfed

Fraction of dominant landcover type [%]:

100.0


Radius: 2 km

Number of landcover classes:

1

Dominant landcover type:

10: cropland, rainfed

Fraction of dominant landcover type [%]:

100.0


Radius: 5 km

Number of landcover classes:

2

Dominant landcover type:

10: cropland, rainfed

Fraction of dominant landcover type [%]:

94.0


Radius: 10 km

Number of landcover classes:

5

Dominant landcover type:

10: cropland, rainfed

Fraction of dominant landcover type [%]:

88.0


Radius: 20 km

Number of landcover classes:

4

Dominant landcover type:

10: cropland, rainfed

Fraction of dominant landcover type [%]:

88.0


Disturbances


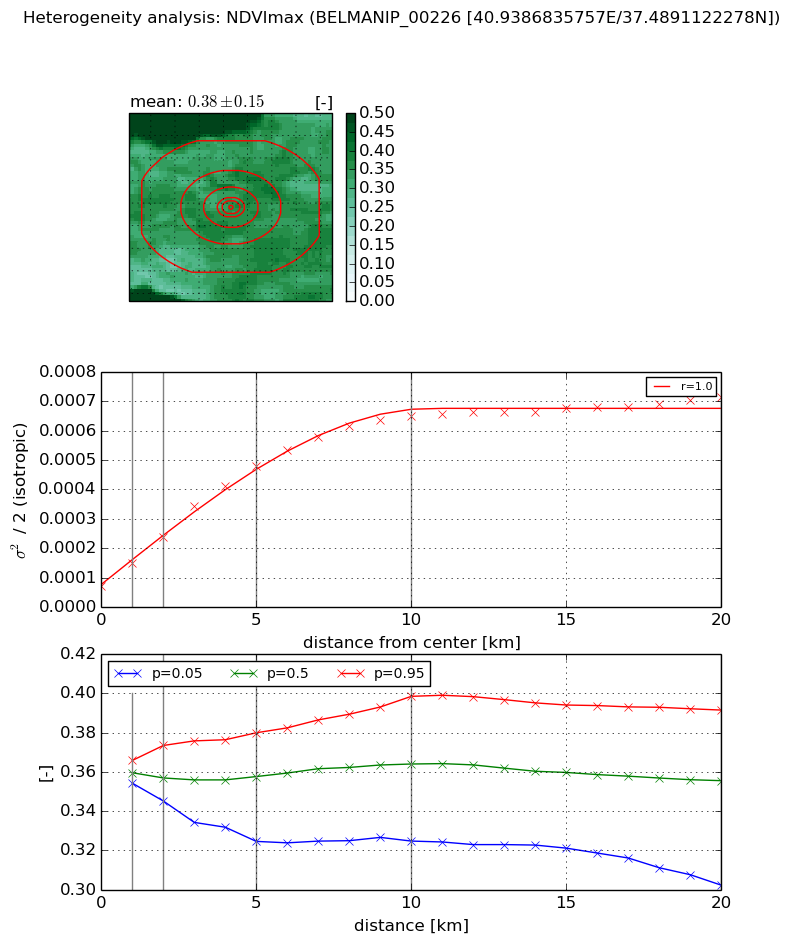
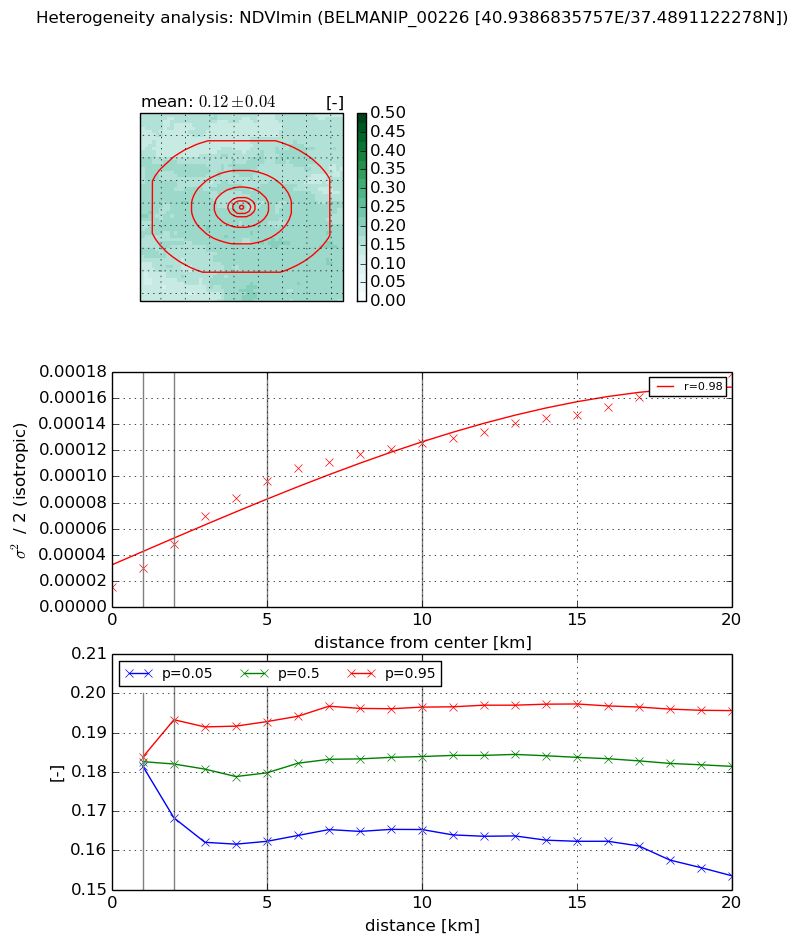
Heterogeneity analysis

The heterogeneity analysis provides information about the spatial and temporal heterogeneity of the site.

Topography


Roman et al. (2009) index


St

2.07545163315e-08

Rcv

0.315928927573

Rse

0.0

Rst

-0.0421019045775

Rsv

144546851.618


Height range @ 1km [m]

85

Height range @ 2km [m]

88

Height range @ 5km [m]

142

Height range @ 10km [m]

-999

Height range @ 20km [m]

-999


Variance slope @ 1 km

773

Variance slope @ 2 km

585

Variance slope @ 5 km

352

Variance slope @ 10 km

-999

Variance slope @ 20 km

-999


NDVI (max. NDVI composite)


Roman et al. (2009) index


St

3.73162773318e-06

Rcv

0.330424025379

Rse

0.0

Rst

0.053580099579

Rsv

803938.329744


NDVI range @ 1km [-]

0.01

NDVI range @ 2km [-]

0.03

NDVI range @ 5km [-]

0.06

NDVI range @ 10km [-]

0.07

NDVI range @ 20km [-]

0.09


Variance slope @ 1 km

7.6666603515e-05

Variance slope @ 2 km

8.33916298364e-05

Variance slope @ 5 km

8.41535603519e-05

Variance slope @ 10 km

5.95836997439e-05

Variance slope @ 20 km

2.70997125468e-05


NDVI (min. NDVI composite)I


Roman et al. (2009) index


St

8.50567848204

Rcv

-0.0487482416535

Rse

0.0

Rst

-0.0737226565662

Rsv

0.230234650942


NDVI range @ 1km [-]

0.0

NDVI range @ 2km [-]

0.03

NDVI range @ 5km [-]

0.03

NDVI range @ 10km [-]

0.03

NDVI range @ 20km [-]

0.04


NDVI slope @ 1 km

1.45211206751e-05

NDVI slope @ 2 km

1.61922904623e-05

NDVI slope @ 5 km

1.67480616667e-05

NDVI slope @ 10 km

1.11754988971e-05

NDVI slope @ 20 km

7.09658796311e-06


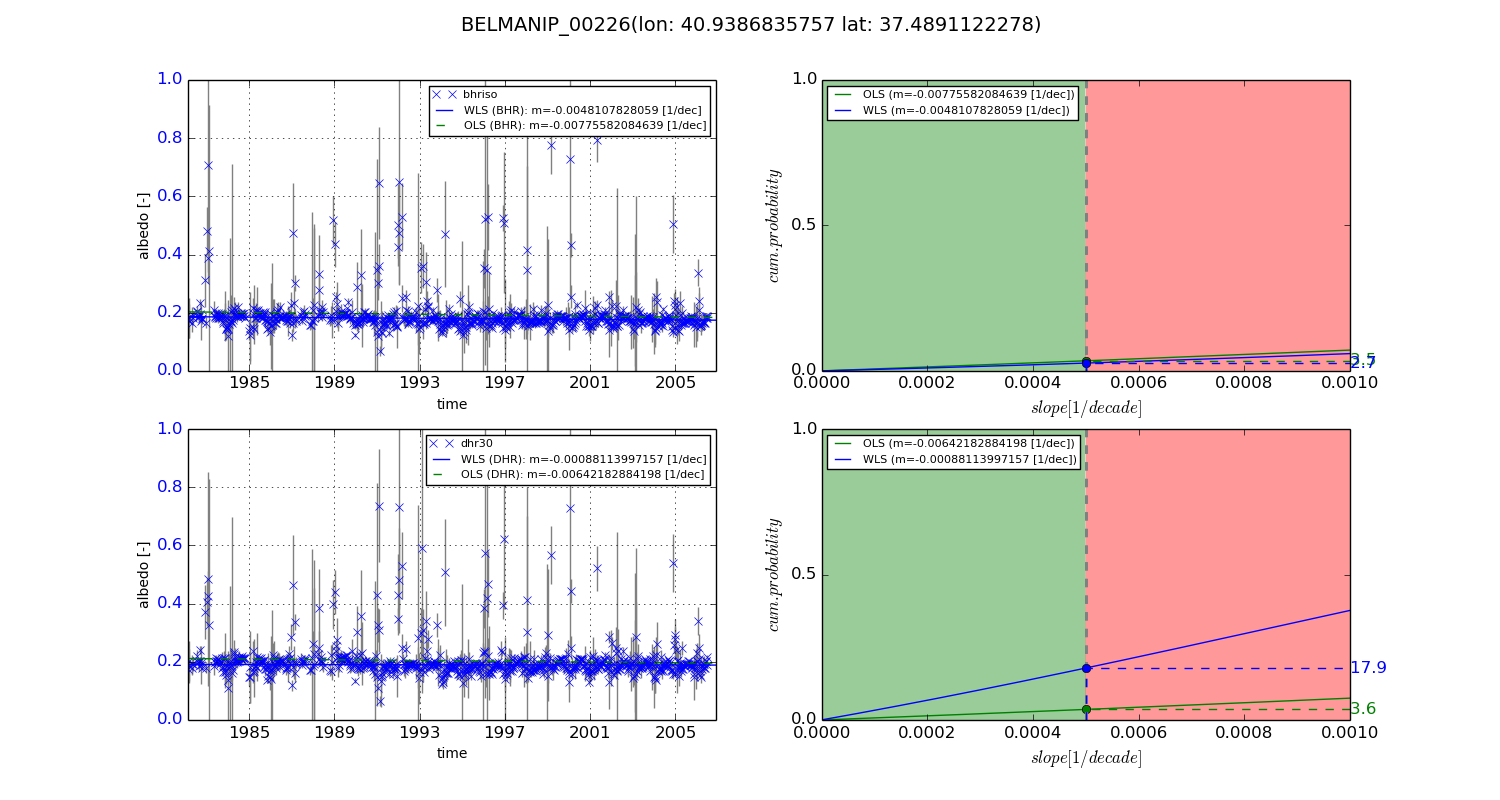
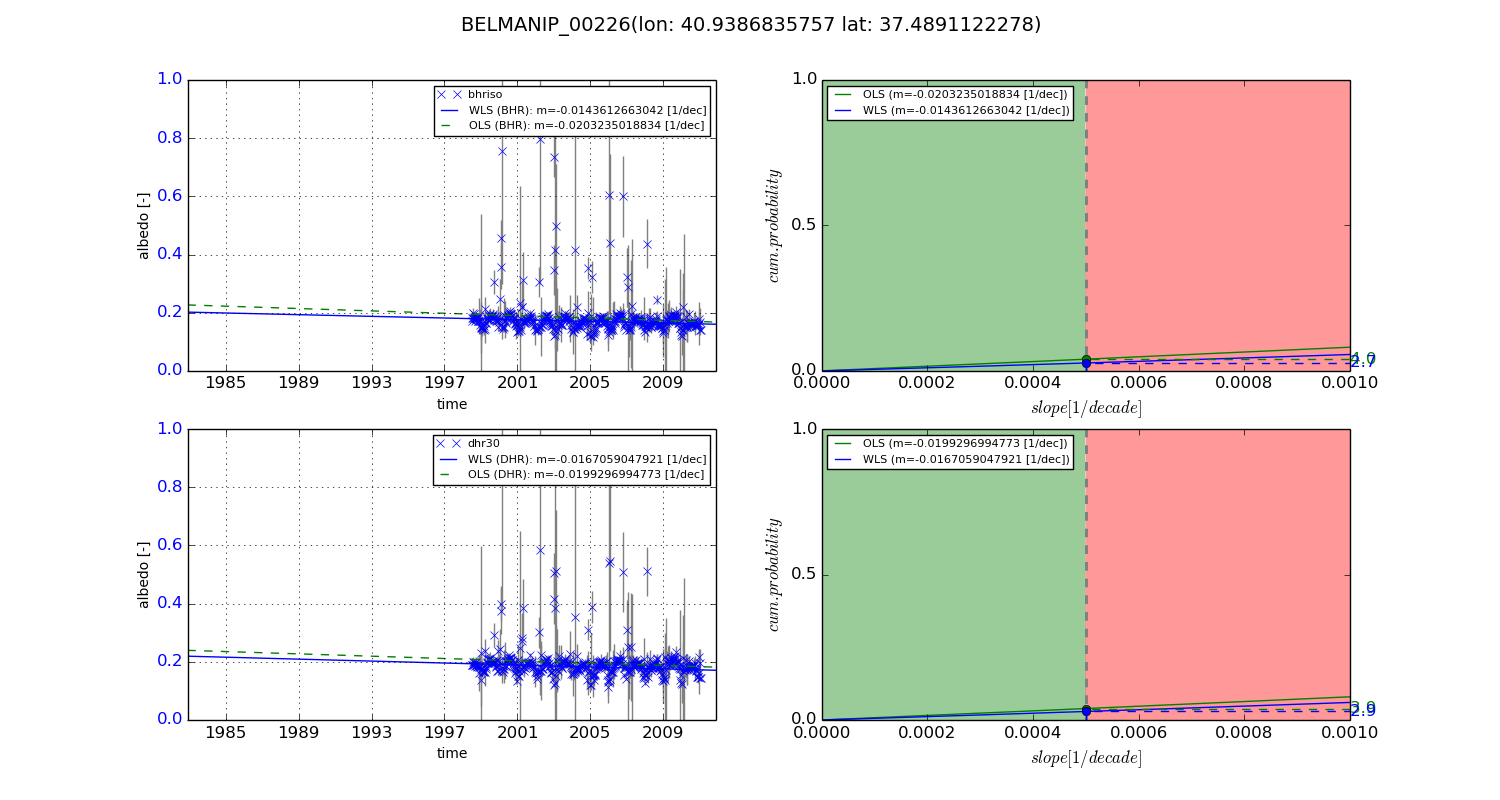
Temporal stability analysis

+000 deg (BHR)


BHR statistics

Temporal stability [1/decade]:


abs

rel


Weighted least square:

-0.0048107828059


Ordinary least square:

-0.00775582084639


Probabilities that GCOS criteria is met:

Weighted least square:

2.7 %

Ordinary least square:

3.5 %


DHR statistics

Temporal stability [1/decade]:


abs

rel


Weighted least square:

-0.00088113997157


Ordinary least square:

-0.00642182884198


Probabilities that GCOS criteria is met:

Weighted least square:

17.9 %

Ordinary least square:

3.6 %


+057/+063 deg (BHR)


BHR statistics

Temporal stability [1/decade]:


abs

rel


Weighted least square:

-0.0143612663042


Ordinary least square:

-0.0203235018834


Probabilities that GCOS criteria is met:

Weighted least square:

2.7 %

Ordinary least square:

4.0 %


DHR statistics

Temporal stability [1/decade]:


abs

rel


Weighted least square:

-0.0167059047921


Ordinary least square:

-0.0199296994773


Probabilities that GCOS criteria is met:

Weighted least square:

2.9 %

Ordinary least square:

3.9 %


Temporal anomaly analyis

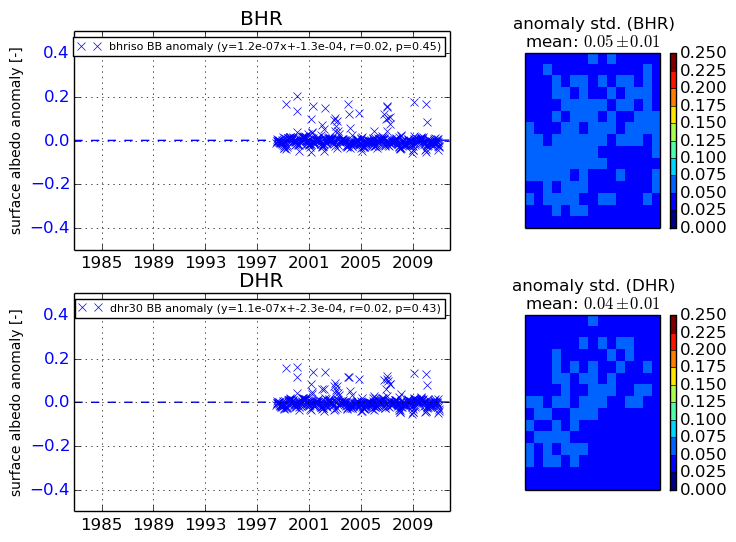
The variance of the temporal anomalies provides an additional measure about the stability of the signal AFTER removal of the mean seasonal cylce.
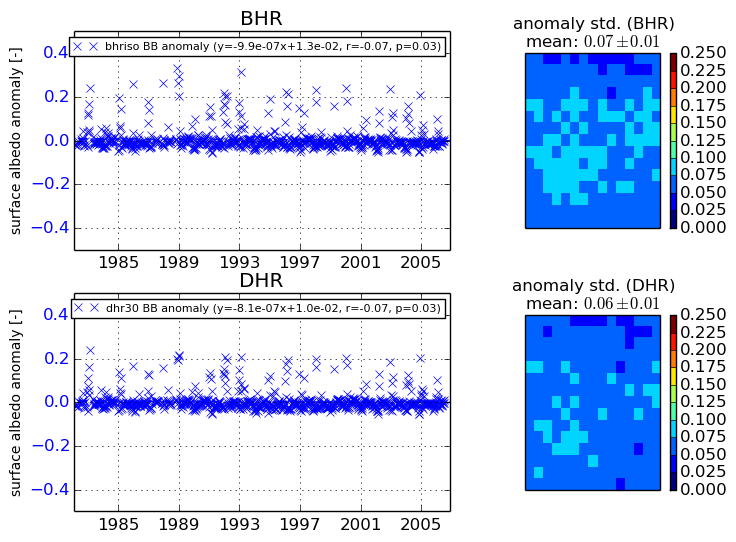
+000 deg


+057/+063 deg