BELMANIP_00227


Location

lon / lat [deg]: 46.6651 / 35.5611

Source network: BELMANIP


Geostationary surface albedo (GSA) data


“+000”


“+057/+063”


Landcover information (based on ESA CCI landcover data)


Landcover fractions @ 2km distance


Landcover fractions @ 20 km distance


Legend


Distance to open water bodies [km]:

30.1

Distance to urban areas [km]:

38.46


Radius: 1 km

Number of landcover classes:

2

Dominant landcover type:

10: cropland, rainfed

Fraction of dominant landcover type [%]:

89.0


Radius: 2 km

Number of landcover classes:

2

Dominant landcover type:

10: cropland, rainfed

Fraction of dominant landcover type [%]:

90.0


Radius: 5 km

Number of landcover classes:

2

Dominant landcover type:

10: cropland, rainfed

Fraction of dominant landcover type [%]:

92.0


Radius: 10 km

Number of landcover classes:

2

Dominant landcover type:

10: cropland, rainfed

Fraction of dominant landcover type [%]:

92.0


Radius: 20 km

Number of landcover classes:

2

Dominant landcover type:

10: cropland, rainfed

Fraction of dominant landcover type [%]:

87.0


Disturbances


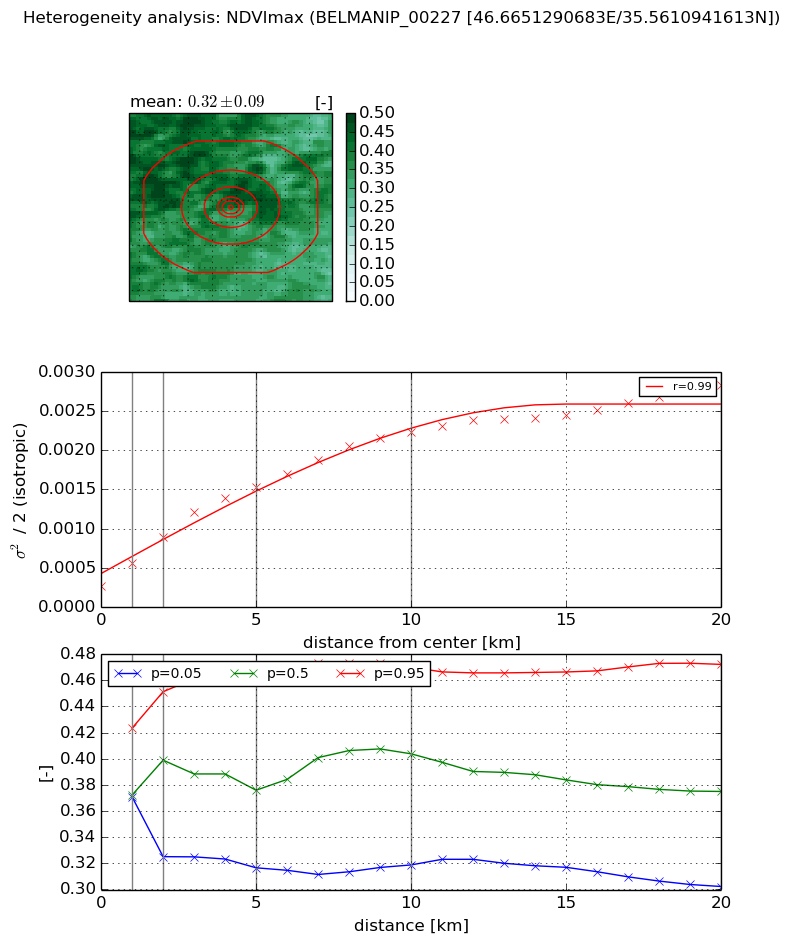
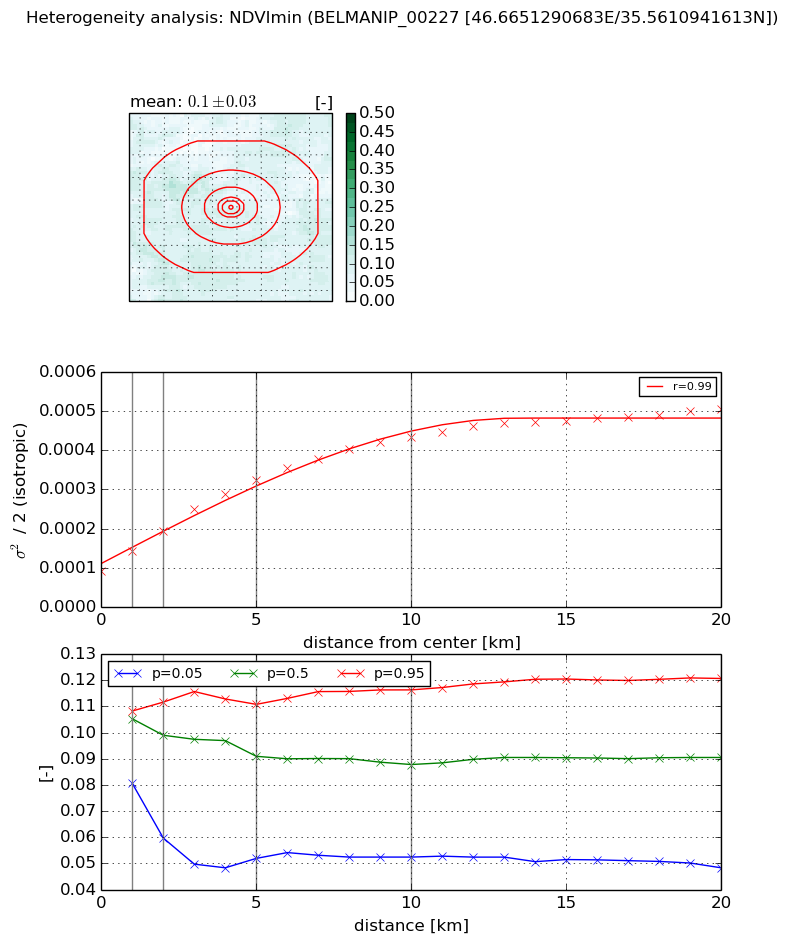
Heterogeneity analysis

The heterogeneity analysis provides information about the spatial and temporal heterogeneity of the site.

Topography


Roman et al. (2009) index


St

0.0406928827317

Rcv

0.252356012998

Rse

0.0

Rst

1.99008871429e-08

Rsv

73.4706097197


Height range @ 1km [m]

304

Height range @ 2km [m]

353

Height range @ 5km [m]

562

Height range @ 10km [m]

-999

Height range @ 20km [m]

-999


Variance slope @ 1 km

7159

Variance slope @ 2 km

6317

Variance slope @ 5 km

5632

Variance slope @ 10 km

-999

Variance slope @ 20 km

-999


NDVI (max. NDVI composite)


Roman et al. (2009) index


St

1.33186793152

Rcv

0.0736074450549

Rse

0.0

Rst

0.0761409051419

Rsv

2.10272723616


NDVI range @ 1km [-]

0.05

NDVI range @ 2km [-]

0.13

NDVI range @ 5km [-]

0.15

NDVI range @ 10km [-]

0.15

NDVI range @ 20km [-]

0.17


Variance slope @ 1 km

0.000298200955205

Variance slope @ 2 km

0.00031262602973

Variance slope @ 5 km

0.000261940811055

Variance slope @ 10 km

0.00019415858819

Variance slope @ 20 km

0.000111712801911


NDVI (min. NDVI composite)I


Roman et al. (2009) index


St

17.9470770081

Rcv

-0.0774619530753

Rse

0.0

Rst

0.035378864571

Rsv

-0.054317321735


NDVI range @ 1km [-]

0.03

NDVI range @ 2km [-]

0.05

NDVI range @ 5km [-]

0.06

NDVI range @ 10km [-]

0.06

NDVI range @ 20km [-]

0.07


NDVI slope @ 1 km

5.0931880407e-05

NDVI slope @ 2 km

5.02653576512e-05

NDVI slope @ 5 km

4.72404347856e-05

NDVI slope @ 10 km

3.42587696278e-05

NDVI slope @ 20 km

1.84304859658e-05


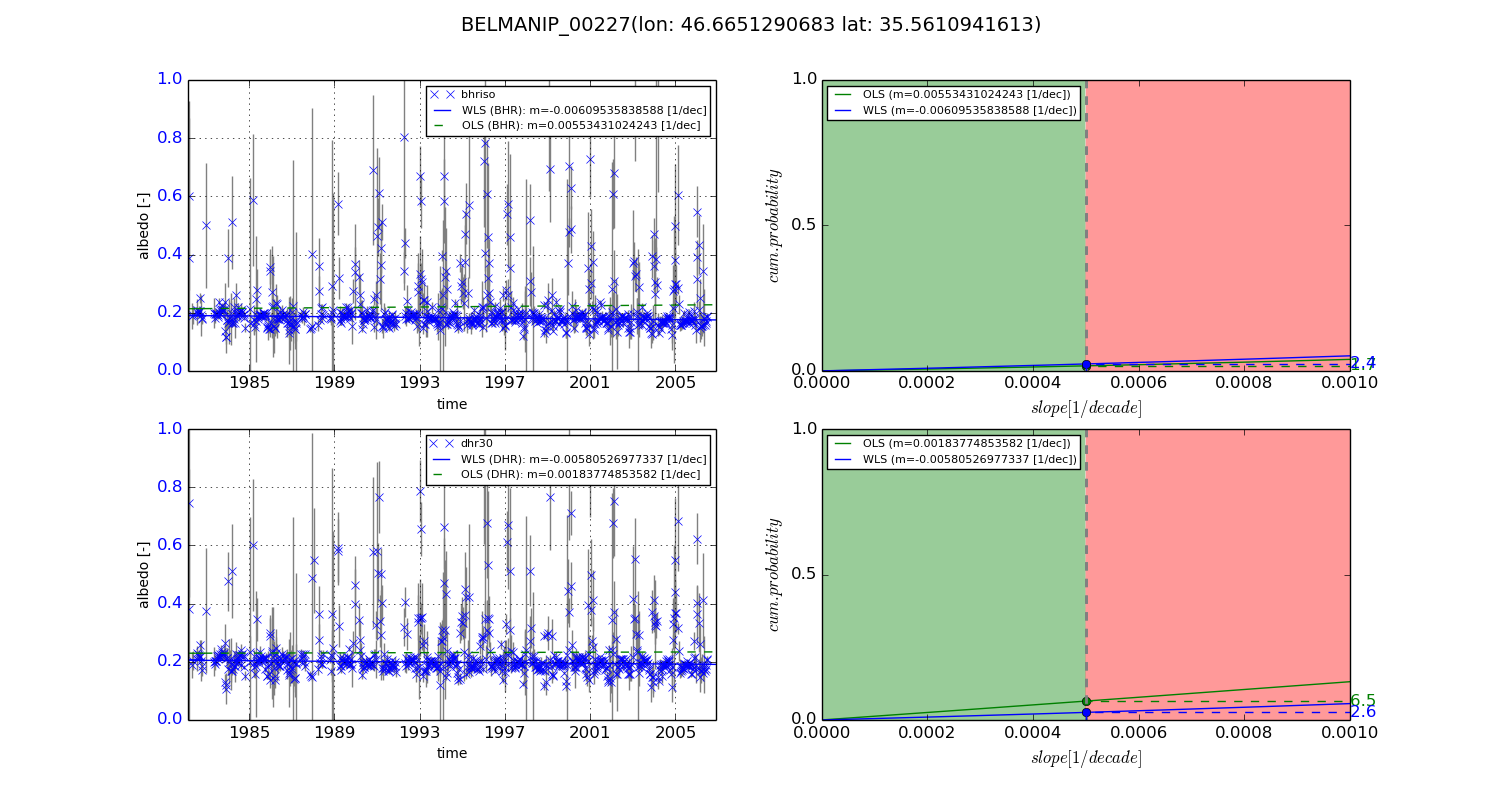
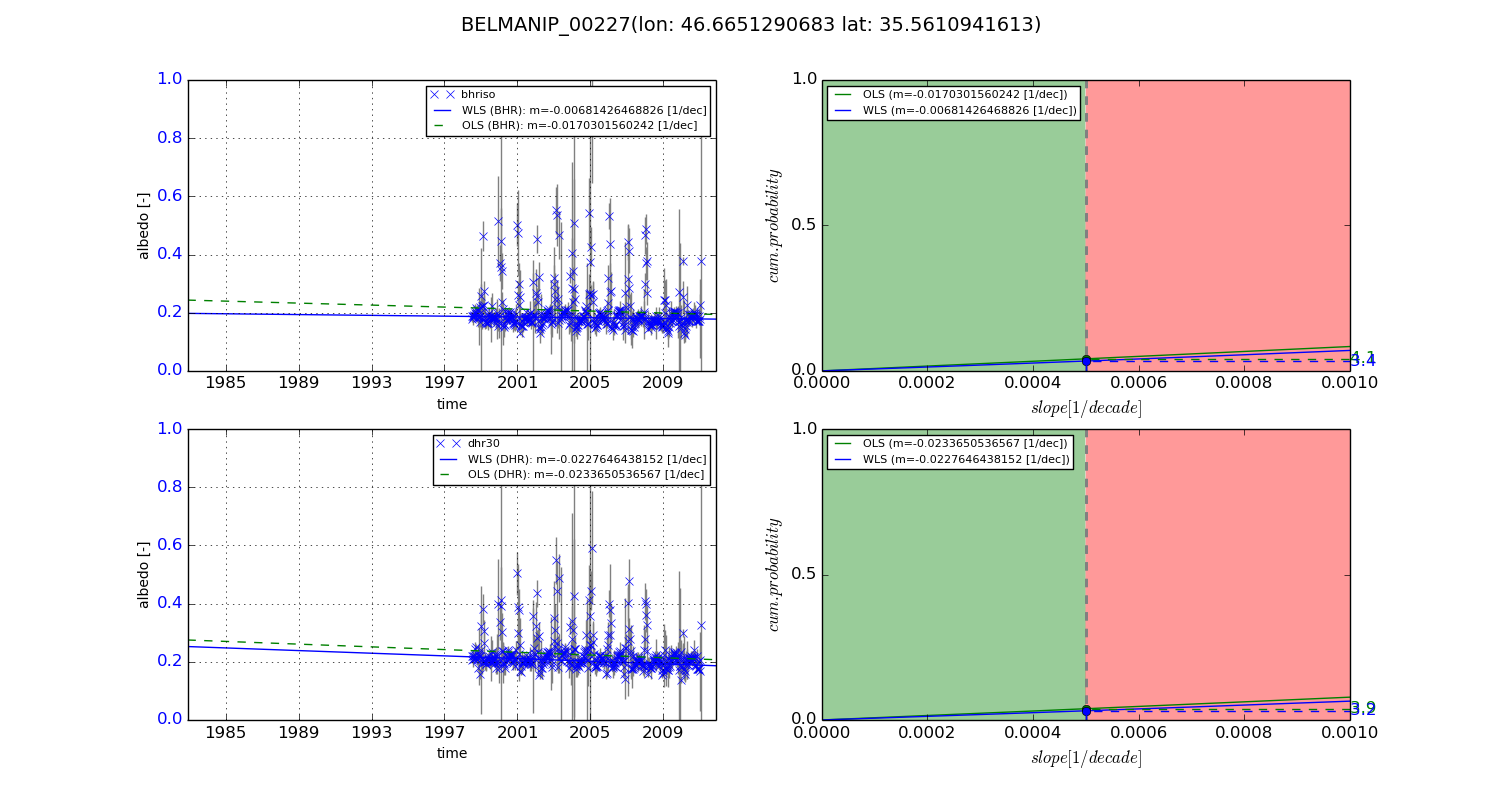
Temporal stability analysis

+000 deg (BHR)


BHR statistics

Temporal stability [1/decade]:


abs

rel


Weighted least square:

-0.00609535838588


Ordinary least square:

0.00553431024243


Probabilities that GCOS criteria is met:

Weighted least square:

2.4 %

Ordinary least square:

1.7 %


DHR statistics

Temporal stability [1/decade]:


abs

rel


Weighted least square:

-0.00580526977337


Ordinary least square:

0.00183774853582


Probabilities that GCOS criteria is met:

Weighted least square:

2.6 %

Ordinary least square:

6.5 %


+057/+063 deg (BHR)


BHR statistics

Temporal stability [1/decade]:


abs

rel


Weighted least square:

-0.00681426468826


Ordinary least square:

-0.0170301560242


Probabilities that GCOS criteria is met:

Weighted least square:

3.4 %

Ordinary least square:

4.1 %


DHR statistics

Temporal stability [1/decade]:


abs

rel


Weighted least square:

-0.0227646438152


Ordinary least square:

-0.0233650536567


Probabilities that GCOS criteria is met:

Weighted least square:

3.2 %

Ordinary least square:

3.9 %


Temporal anomaly analyis

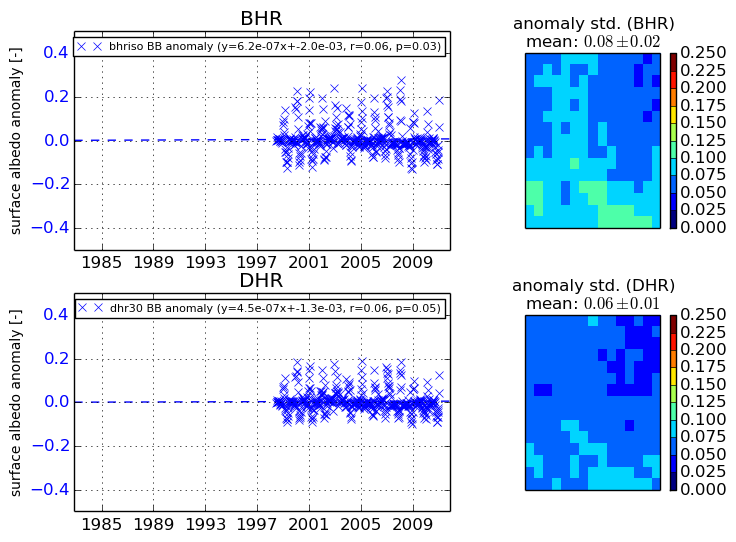
The variance of the temporal anomalies provides an additional measure about the stability of the signal AFTER removal of the mean seasonal cylce.
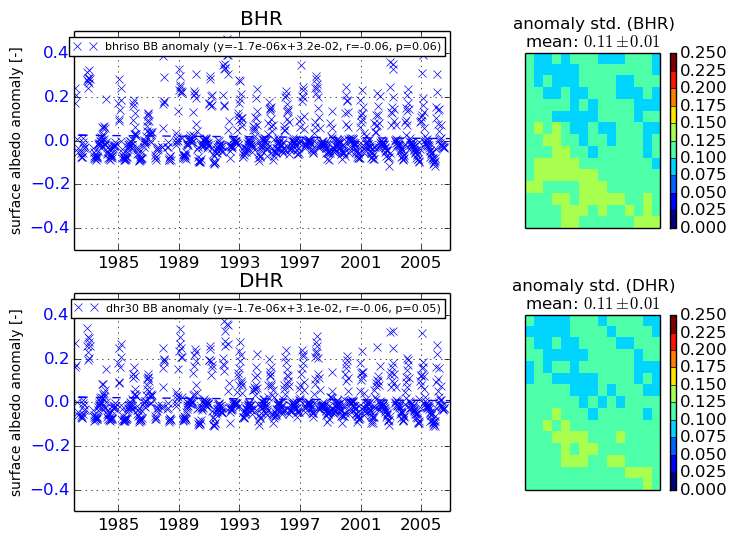
+000 deg


+057/+063 deg