BELMANIP_00229


Location

lon / lat [deg]: 9.4836 / 34.7228

Source network: BELMANIP


Geostationary surface albedo (GSA) data


“+000”


“+057/+063”


Landcover information (based on ESA CCI landcover data)


Landcover fractions @ 2km distance


Landcover fractions @ 20 km distance


Legend


Distance to open water bodies [km]:

51.21

Distance to urban areas [km]:

16.02


Radius: 1 km

Number of landcover classes:

3

Dominant landcover type:

150: Sparse vegetation (tree, shrub, herbaceous cover) (<15%)

Fraction of dominant landcover type [%]:

48.0


Radius: 2 km

Number of landcover classes:

3

Dominant landcover type:

150: Sparse vegetation (tree, shrub, herbaceous cover) (<15%)

Fraction of dominant landcover type [%]:

56.0


Radius: 5 km

Number of landcover classes:

3

Dominant landcover type:

150: Sparse vegetation (tree, shrub, herbaceous cover) (<15%)

Fraction of dominant landcover type [%]:

66.0


Radius: 10 km

Number of landcover classes:

3

Dominant landcover type:

150: Sparse vegetation (tree, shrub, herbaceous cover) (<15%)

Fraction of dominant landcover type [%]:

54.0


Radius: 20 km

Number of landcover classes:

3

Dominant landcover type:

150: Sparse vegetation (tree, shrub, herbaceous cover) (<15%)

Fraction of dominant landcover type [%]:

50.0


Disturbances


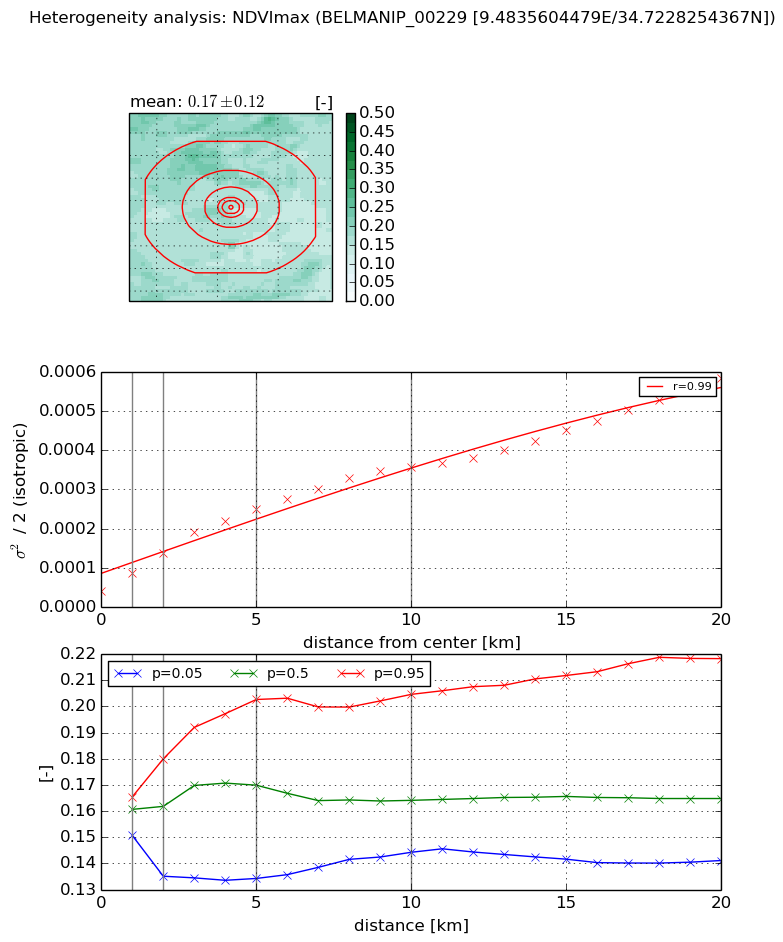
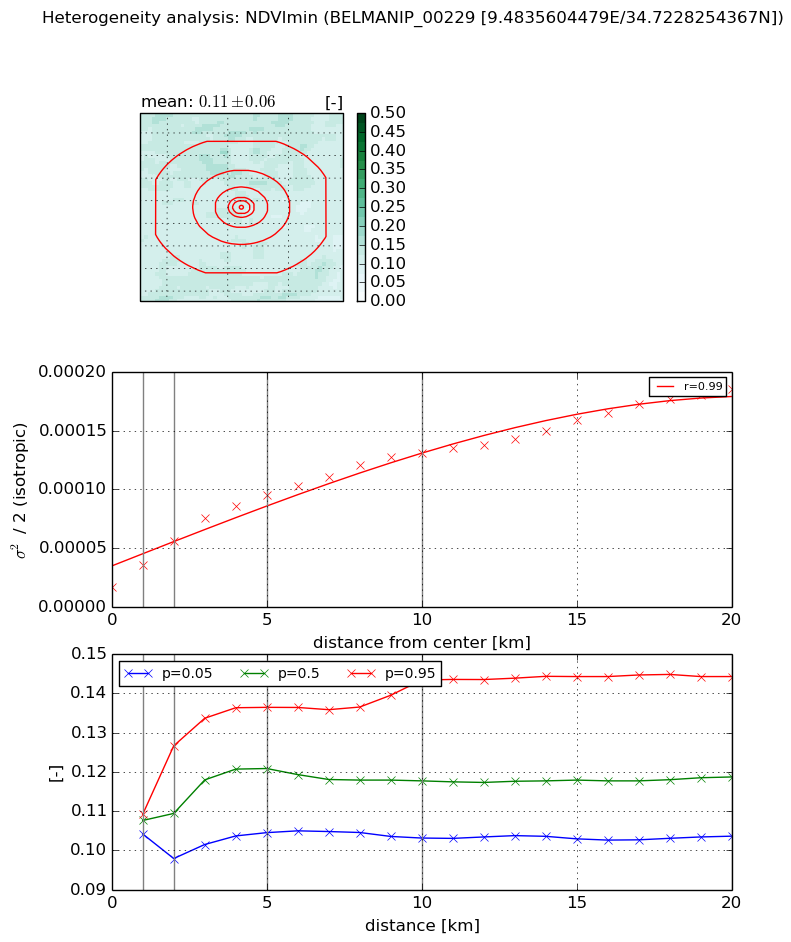
Heterogeneity analysis

The heterogeneity analysis provides information about the spatial and temporal heterogeneity of the site.

Topography


Roman et al. (2009) index


St

0.0296360732303

Rcv

2.42845584619

Rse

0.0

Rst

8.76684715601e-07

Rsv

98.7995290729


Height range @ 1km [m]

11

Height range @ 2km [m]

21

Height range @ 5km [m]

120

Height range @ 10km [m]

-999

Height range @ 20km [m]

-999


Variance slope @ 1 km

392

Variance slope @ 2 km

376

Variance slope @ 5 km

472

Variance slope @ 10 km

-999

Variance slope @ 20 km

-999


NDVI (max. NDVI composite)


Roman et al. (2009) index


St

5.85458695405

Rcv

0.115028352463

Rse

0.0

Rst

0.0265580355684

Rsv

0.370832339975


NDVI range @ 1km [-]

0.01

NDVI range @ 2km [-]

0.04

NDVI range @ 5km [-]

0.07

NDVI range @ 10km [-]

0.06

NDVI range @ 20km [-]

0.08


Variance slope @ 1 km

4.59443822673e-05

Variance slope @ 2 km

4.84461249884e-05

Variance slope @ 5 km

4.28326418944e-05

Variance slope @ 10 km

3.16170514636e-05

Variance slope @ 20 km

2.40632161873e-05


NDVI (min. NDVI composite)I


Roman et al. (2009) index


St

55.1503770152

Rcv

-0.0226229456208

Rse

0.0

Rst

0.0157345176565

Rsv

-0.0160392636784


NDVI range @ 1km [-]

0.01

NDVI range @ 2km [-]

0.03

NDVI range @ 5km [-]

0.03

NDVI range @ 10km [-]

0.04

NDVI range @ 20km [-]

0.04


NDVI slope @ 1 km

1.92521894603e-05

NDVI slope @ 2 km

1.97259502633e-05

NDVI slope @ 5 km

1.60466883906e-05

NDVI slope @ 10 km

1.11006540334e-05

NDVI slope @ 20 km

7.47419236038e-06


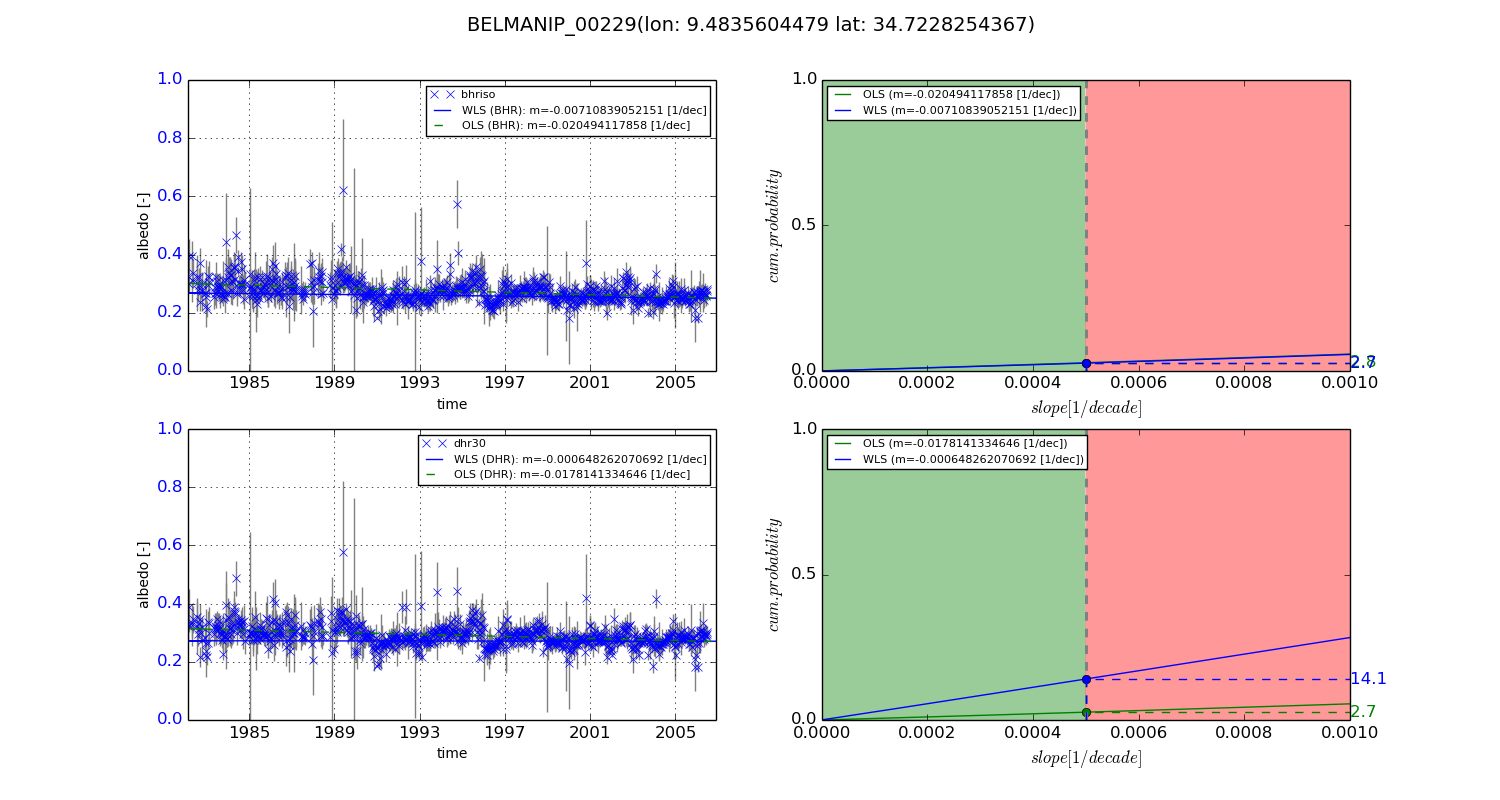
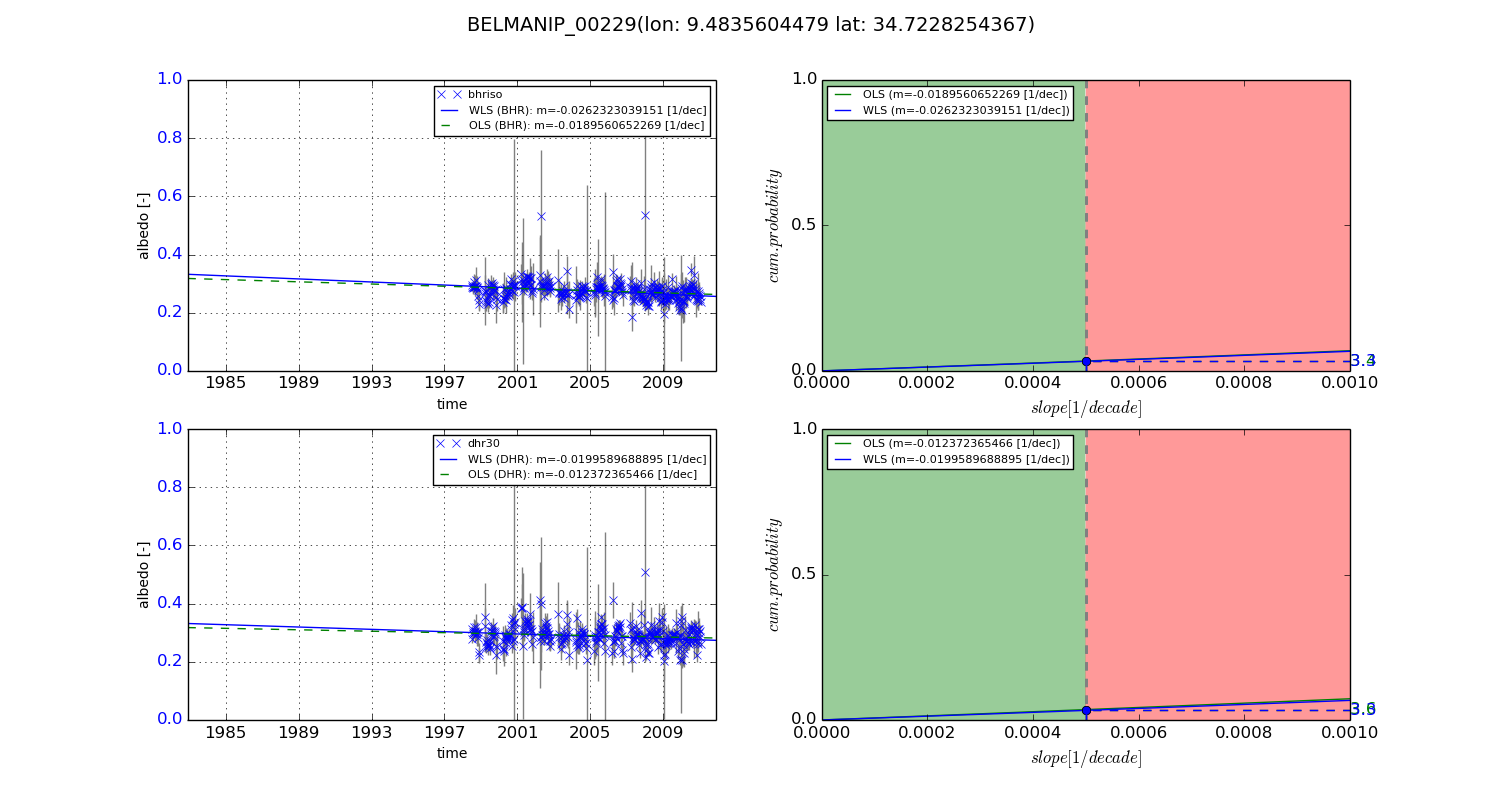
Temporal stability analysis

+000 deg (BHR)


BHR statistics

Temporal stability [1/decade]:


abs

rel


Weighted least square:

-0.00710839052151


Ordinary least square:

-0.020494117858


Probabilities that GCOS criteria is met:

Weighted least square:

2.7 %

Ordinary least square:

2.8 %


DHR statistics

Temporal stability [1/decade]:


abs

rel


Weighted least square:

-0.000648262070692


Ordinary least square:

-0.0178141334646


Probabilities that GCOS criteria is met:

Weighted least square:

14.1 %

Ordinary least square:

2.7 %


+057/+063 deg (BHR)


BHR statistics

Temporal stability [1/decade]:


abs

rel


Weighted least square:

-0.0262323039151


Ordinary least square:

-0.0189560652269


Probabilities that GCOS criteria is met:

Weighted least square:

3.3 %

Ordinary least square:

3.4 %


DHR statistics

Temporal stability [1/decade]:


abs

rel


Weighted least square:

-0.0199589688895


Ordinary least square:

-0.012372365466


Probabilities that GCOS criteria is met:

Weighted least square:

3.3 %

Ordinary least square:

3.6 %


Temporal anomaly analyis

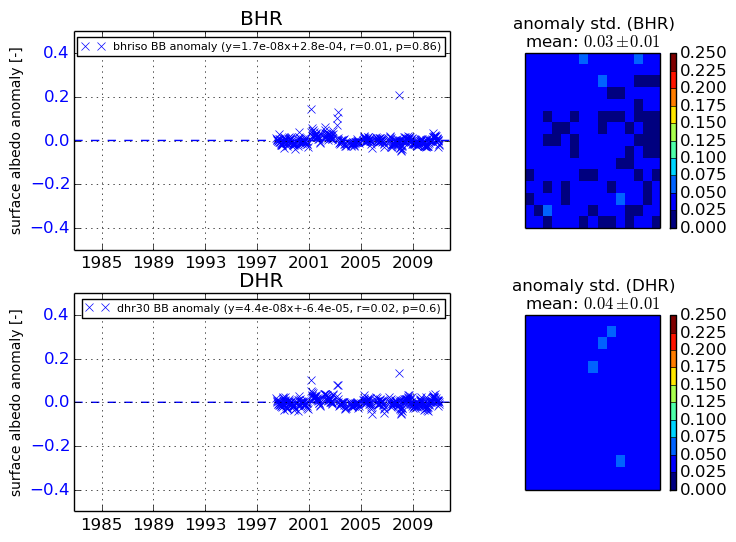
The variance of the temporal anomalies provides an additional measure about the stability of the signal AFTER removal of the mean seasonal cylce.
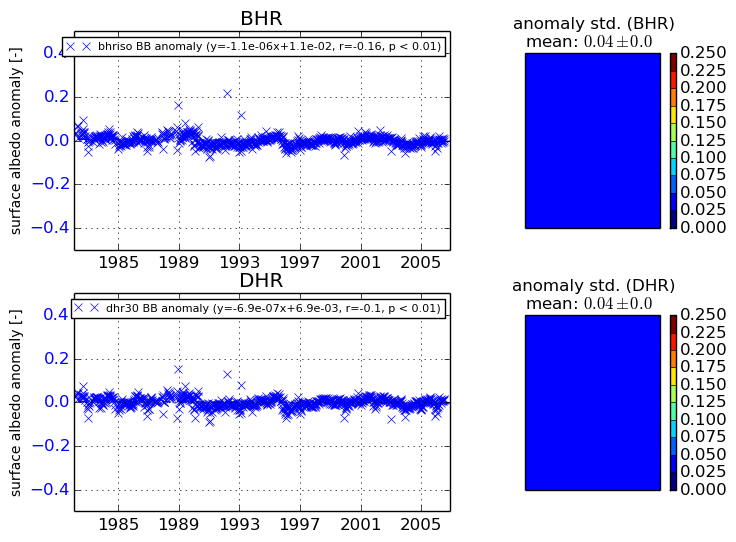
+000 deg


+057/+063 deg