BELMANIP_00230


Location

lon / lat [deg]: 20.6945 / 31.8057

Source network: BELMANIP


Geostationary surface albedo (GSA) data


“+000”


“+057/+063”


Landcover information (based on ESA CCI landcover data)


Landcover fractions @ 2km distance


Landcover fractions @ 20 km distance


Legend


Distance to open water bodies [km]:

9.15

Distance to urban areas [km]:

21.22


Radius: 1 km

Number of landcover classes:

1

Dominant landcover type:

150: Sparse vegetation (tree, shrub, herbaceous cover) (<15%)

Fraction of dominant landcover type [%]:

100.0


Radius: 2 km

Number of landcover classes:

1

Dominant landcover type:

150: Sparse vegetation (tree, shrub, herbaceous cover) (<15%)

Fraction of dominant landcover type [%]:

100.0


Radius: 5 km

Number of landcover classes:

2

Dominant landcover type:

150: Sparse vegetation (tree, shrub, herbaceous cover) (<15%)

Fraction of dominant landcover type [%]:

99.0


Radius: 10 km

Number of landcover classes:

2

Dominant landcover type:

150: Sparse vegetation (tree, shrub, herbaceous cover) (<15%)

Fraction of dominant landcover type [%]:

93.0


Radius: 20 km

Number of landcover classes:

2

Dominant landcover type:

150: Sparse vegetation (tree, shrub, herbaceous cover) (<15%)

Fraction of dominant landcover type [%]:

94.0


Disturbances


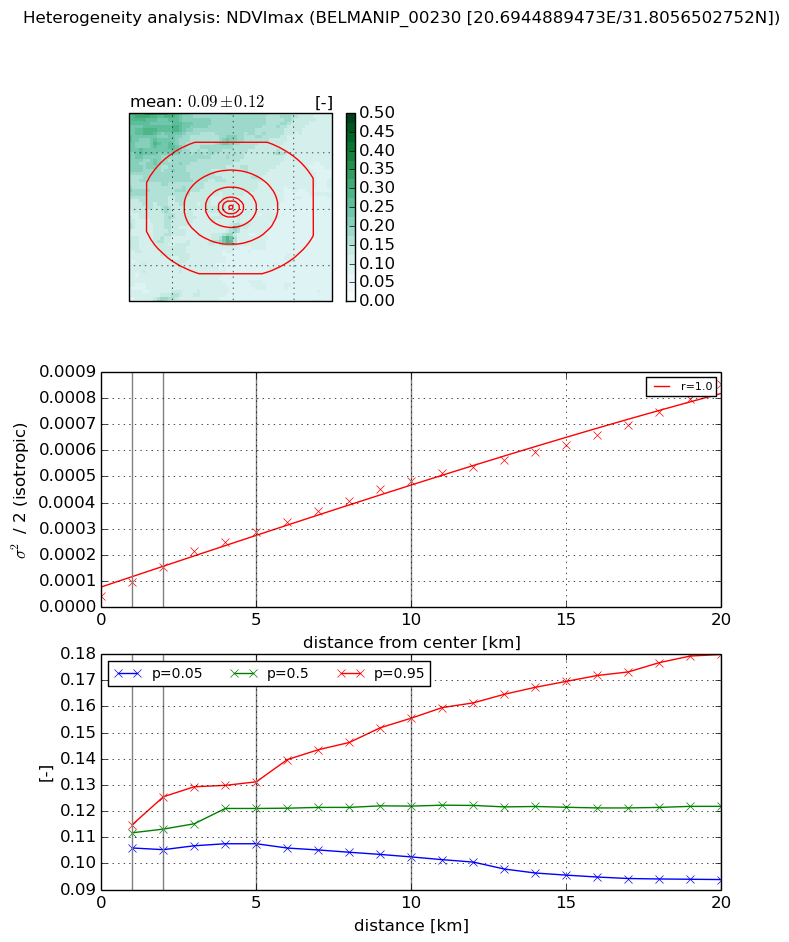
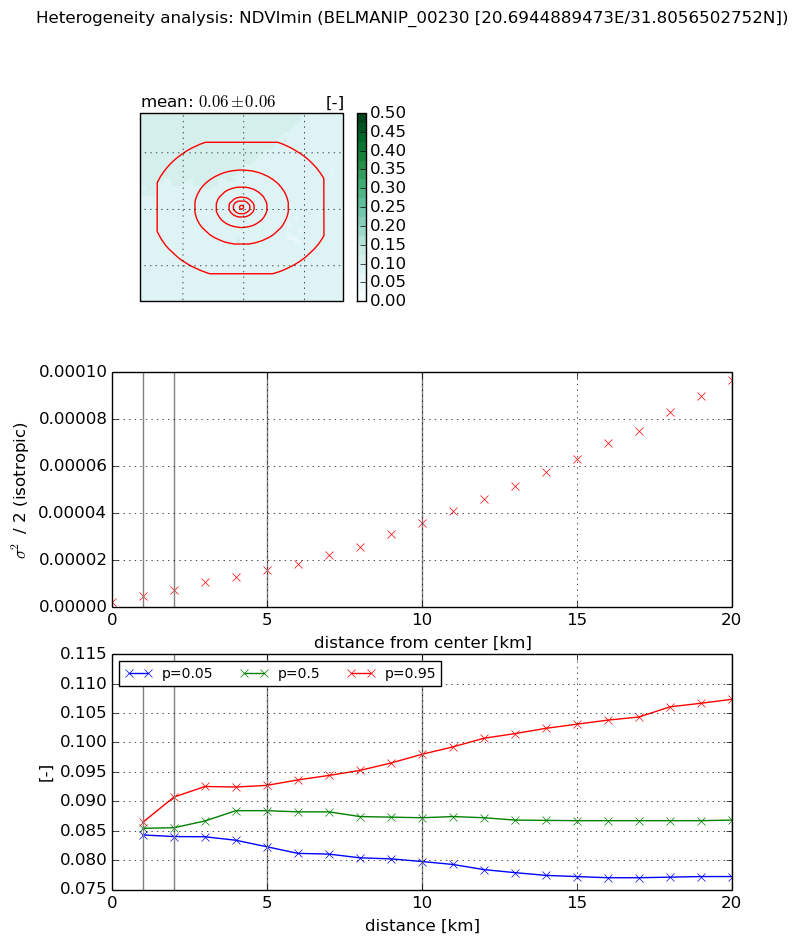
Heterogeneity analysis

The heterogeneity analysis provides information about the spatial and temporal heterogeneity of the site.

Topography


Roman et al. (2009) index


St

2.04570002057

Rcv

0.587864946566

Rse

0.0

Rst

-1.58089096784e-05

Rsv

-0.878609917562


Height range @ 1km [m]

21

Height range @ 2km [m]

28

Height range @ 5km [m]

62

Height range @ 10km [m]

-999

Height range @ 20km [m]

-999


Variance slope @ 1 km

67

Variance slope @ 2 km

57

Variance slope @ 5 km

76

Variance slope @ 10 km

-999

Variance slope @ 20 km

-999


NDVI (max. NDVI composite)


Roman et al. (2009) index


St

1.93389575081

Rcv

0.194104169792

Rse

0.0

Rst

-0.324227586812

Rsv

1.03294110738


NDVI range @ 1km [-]

0.01

NDVI range @ 2km [-]

0.02

NDVI range @ 5km [-]

0.02

NDVI range @ 10km [-]

0.05

NDVI range @ 20km [-]

0.09


Variance slope @ 1 km

5.31971750113e-05

Variance slope @ 2 km

5.44810121984e-05

Variance slope @ 5 km

5.00627140181e-05

Variance slope @ 10 km

4.32984563843e-05

Variance slope @ 20 km

3.72380626456e-05


NDVI (min. NDVI composite)I


Roman et al. (2009) index


St

2.02688576044

Rcv

0.198743743888

Rse

0.0

Rst

-0.281360723076

Rsv

-0.999998683666


NDVI range @ 1km [-]

0.0

NDVI range @ 2km [-]

0.01

NDVI range @ 5km [-]

0.01

NDVI range @ 10km [-]

0.02

NDVI range @ 20km [-]

0.03


NDVI slope @ 1 km

2.62134881662e-06

NDVI slope @ 2 km

2.63448954198e-06

NDVI slope @ 5 km

2.7111987935e-06

NDVI slope @ 10 km

3.24710152968e-06

NDVI slope @ 20 km

4.715580582e-06


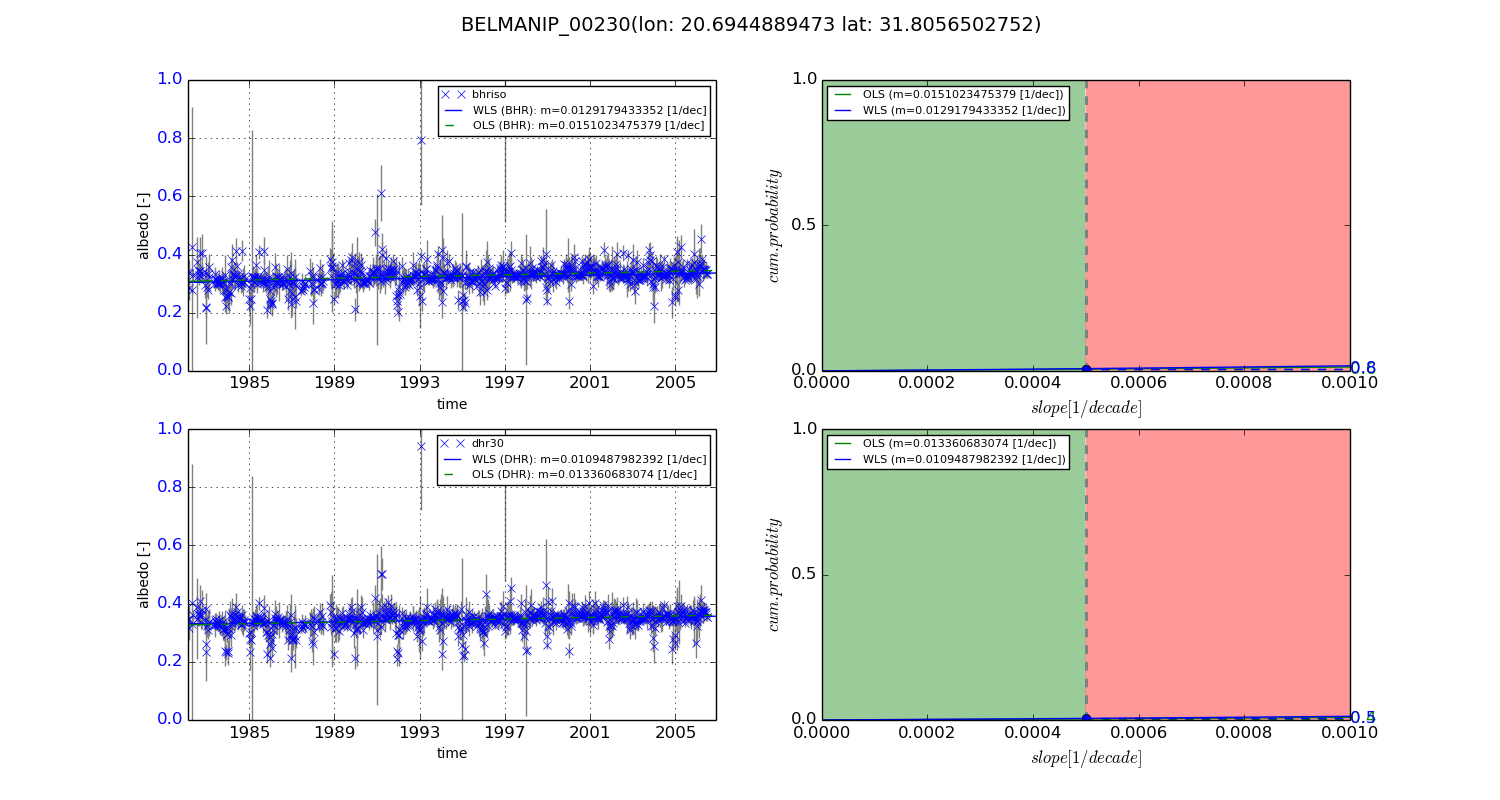
Temporal stability analysis

+000 deg (BHR)


BHR statistics

Temporal stability [1/decade]:


abs

rel


Weighted least square:

0.0129179433352


Ordinary least square:

0.0151023475379


Probabilities that GCOS criteria is met:

Weighted least square:

0.8 %

Ordinary least square:

0.6 %


DHR statistics

Temporal stability [1/decade]:


abs

rel


Weighted least square:

0.0109487982392


Ordinary least square:

0.013360683074


Probabilities that GCOS criteria is met:

Weighted least square:

0.5 %

Ordinary least square:

0.4 %


+057/+063 deg (BHR)


BHR statistics

Temporal stability [1/decade]:


abs

rel


Weighted least square:

0.01460856655


Ordinary least square:

0.00995052551907


Probabilities that GCOS criteria is met:

Weighted least square:

0.3 %

Ordinary least square:

0.0 %


DHR statistics

Temporal stability [1/decade]:


abs

rel


Weighted least square:

0.0124632686644


Ordinary least square:

0.000880588067067


Probabilities that GCOS criteria is met:

Weighted least square:

0.2 %

Ordinary least square:

8.4 %


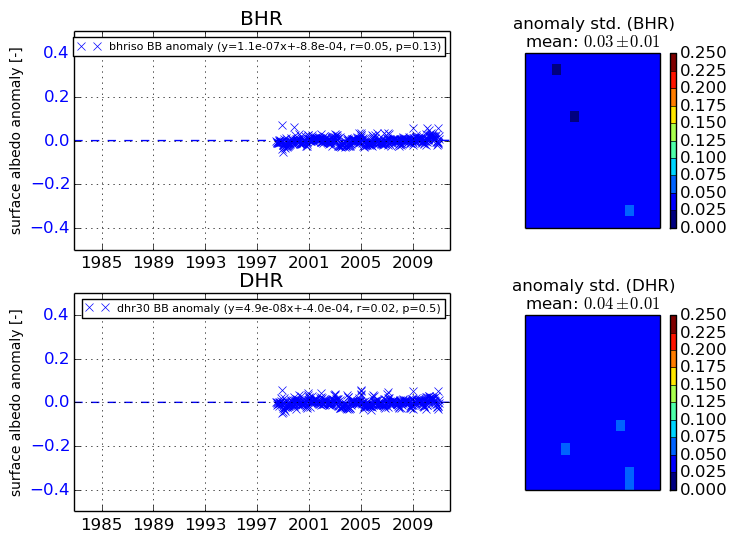
Temporal anomaly analyis

The variance of the temporal anomalies provides an additional measure about the stability of the signal AFTER removal of the mean seasonal cylce.
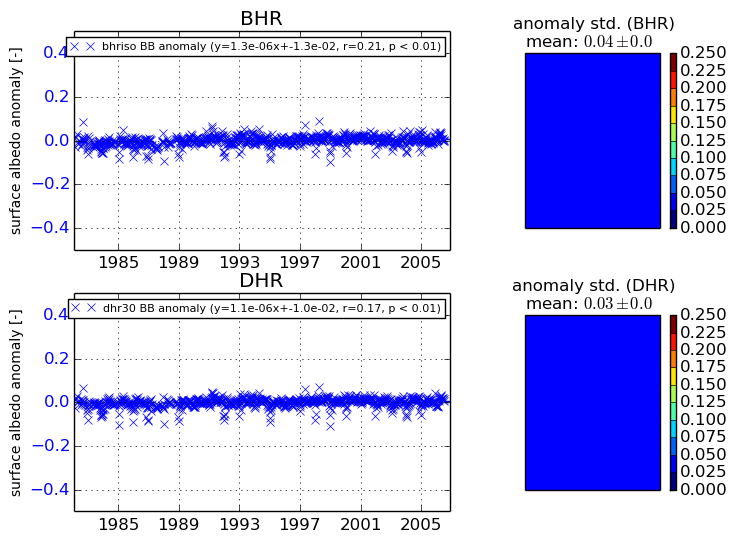
+000 deg


+057/+063 deg