BELMANIP_00231


Location

lon / lat [deg]: 41.2613 / 36.8688

Source network: BELMANIP


Geostationary surface albedo (GSA) data


“+000”


“+057/+063”


Landcover information (based on ESA CCI landcover data)


Landcover fractions @ 2km distance


Landcover fractions @ 20 km distance


Legend


Distance to open water bodies [km]:

23.85

Distance to urban areas [km]:

0.92


Radius: 1 km

Number of landcover classes:

4

Dominant landcover type:

10: cropland, rainfed

Fraction of dominant landcover type [%]:

52.0


Radius: 2 km

Number of landcover classes:

3

Dominant landcover type:

150: Sparse vegetation (tree, shrub, herbaceous cover) (<15%)

Fraction of dominant landcover type [%]:

53.0


Radius: 5 km

Number of landcover classes:

3

Dominant landcover type:

150: Sparse vegetation (tree, shrub, herbaceous cover) (<15%)

Fraction of dominant landcover type [%]:

49.0


Radius: 10 km

Number of landcover classes:

3

Dominant landcover type:

10: cropland, rainfed

Fraction of dominant landcover type [%]:

63.0


Radius: 20 km

Number of landcover classes:

4

Dominant landcover type:

10: cropland, rainfed

Fraction of dominant landcover type [%]:

59.0


Disturbances


Heterogeneity analysis

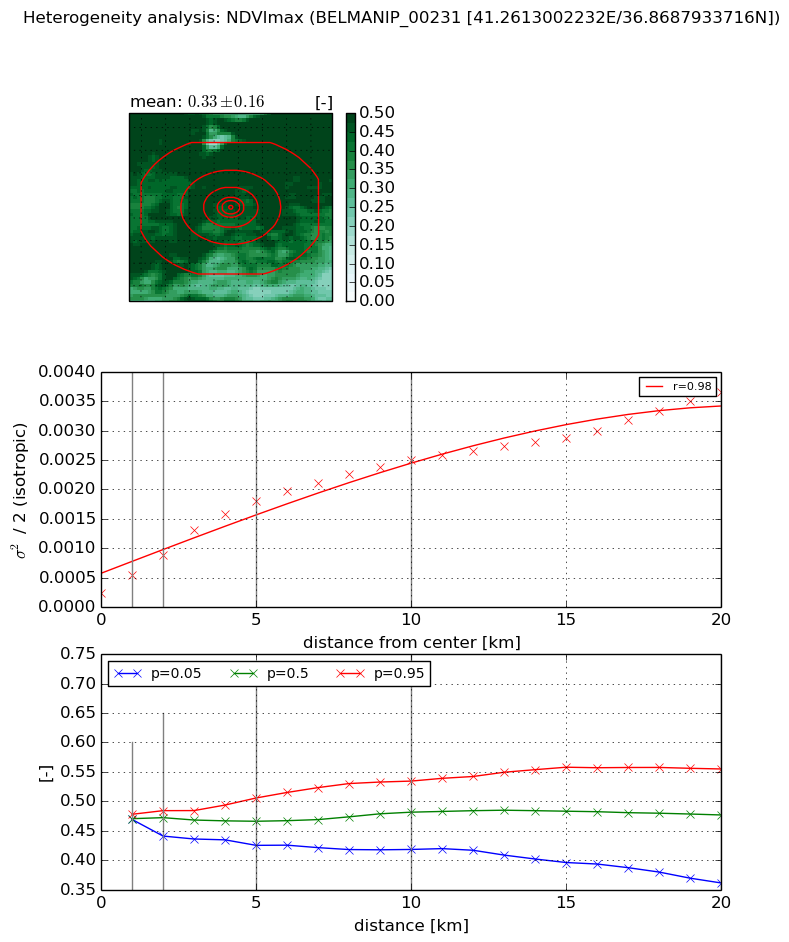
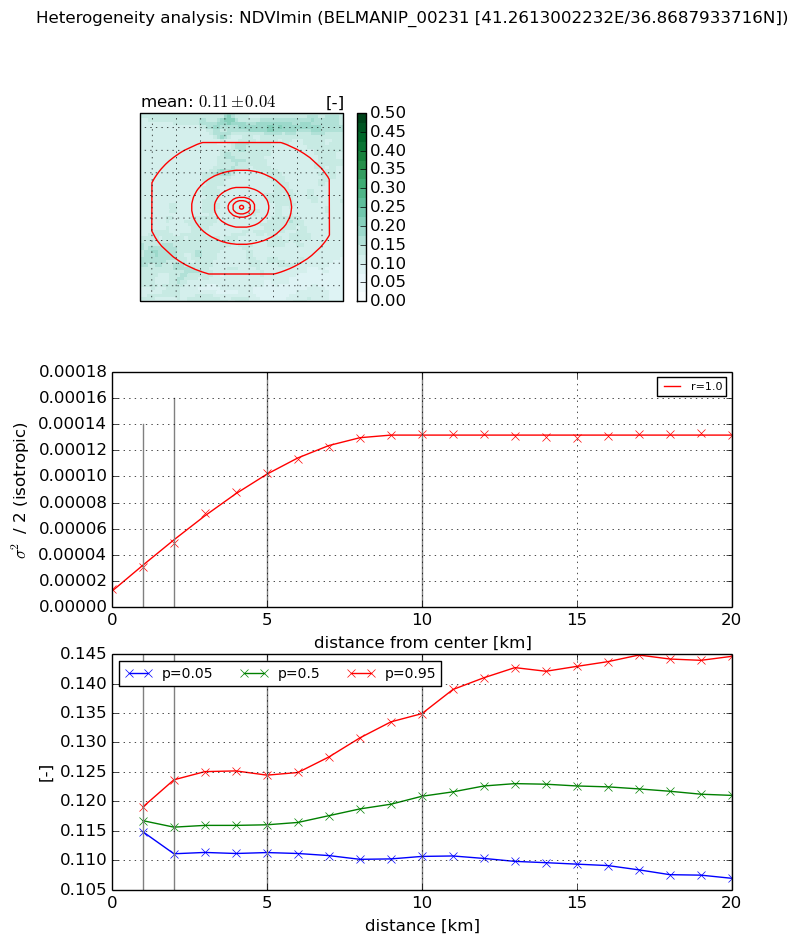
The heterogeneity analysis provides information about the spatial and temporal heterogeneity of the site.

Topography


Roman et al. (2009) index


St

0.000937930372961

Rcv

0.456777266024

Rse

0.0

Rst

1.55727120087e-08

Rsv

3198.07489041


Height range @ 1km [m]

9

Height range @ 2km [m]

12

Height range @ 5km [m]

25

Height range @ 10km [m]

-999

Height range @ 20km [m]

-999


Variance slope @ 1 km

7

Variance slope @ 2 km

8

Variance slope @ 5 km

14

Variance slope @ 10 km

-999

Variance slope @ 20 km

-999


NDVI (max. NDVI composite)


Roman et al. (2009) index


St

2.46175853122

Rcv

0.383747753162

Rse

0.0

Rst

-0.307581758486

Rsv

0.527311537809


NDVI range @ 1km [-]

0.01

NDVI range @ 2km [-]

0.04

NDVI range @ 5km [-]

0.08

NDVI range @ 10km [-]

0.12

NDVI range @ 20km [-]

0.19


Variance slope @ 1 km

0.000299285952866

Variance slope @ 2 km

0.000322281513478

Variance slope @ 5 km

0.000325445521673

Variance slope @ 10 km

0.000224390717866

Variance slope @ 20 km

0.000147313106334


NDVI (min. NDVI composite)I


Roman et al. (2009) index


St

17.5779884443

Rcv

-0.0280990461013

Rse

0.0

Rst

-0.0133040527098

Rsv

0.12926489369


NDVI range @ 1km [-]

0.0

NDVI range @ 2km [-]

0.01

NDVI range @ 5km [-]

0.01

NDVI range @ 10km [-]

0.02

NDVI range @ 20km [-]

0.04


NDVI slope @ 1 km

1.67293076551e-05

NDVI slope @ 2 km

1.74918875028e-05

NDVI slope @ 5 km

1.83139982515e-05

NDVI slope @ 10 km

1.24272502791e-05

NDVI slope @ 20 km

4.78786299609e-06


Temporal stability analysis

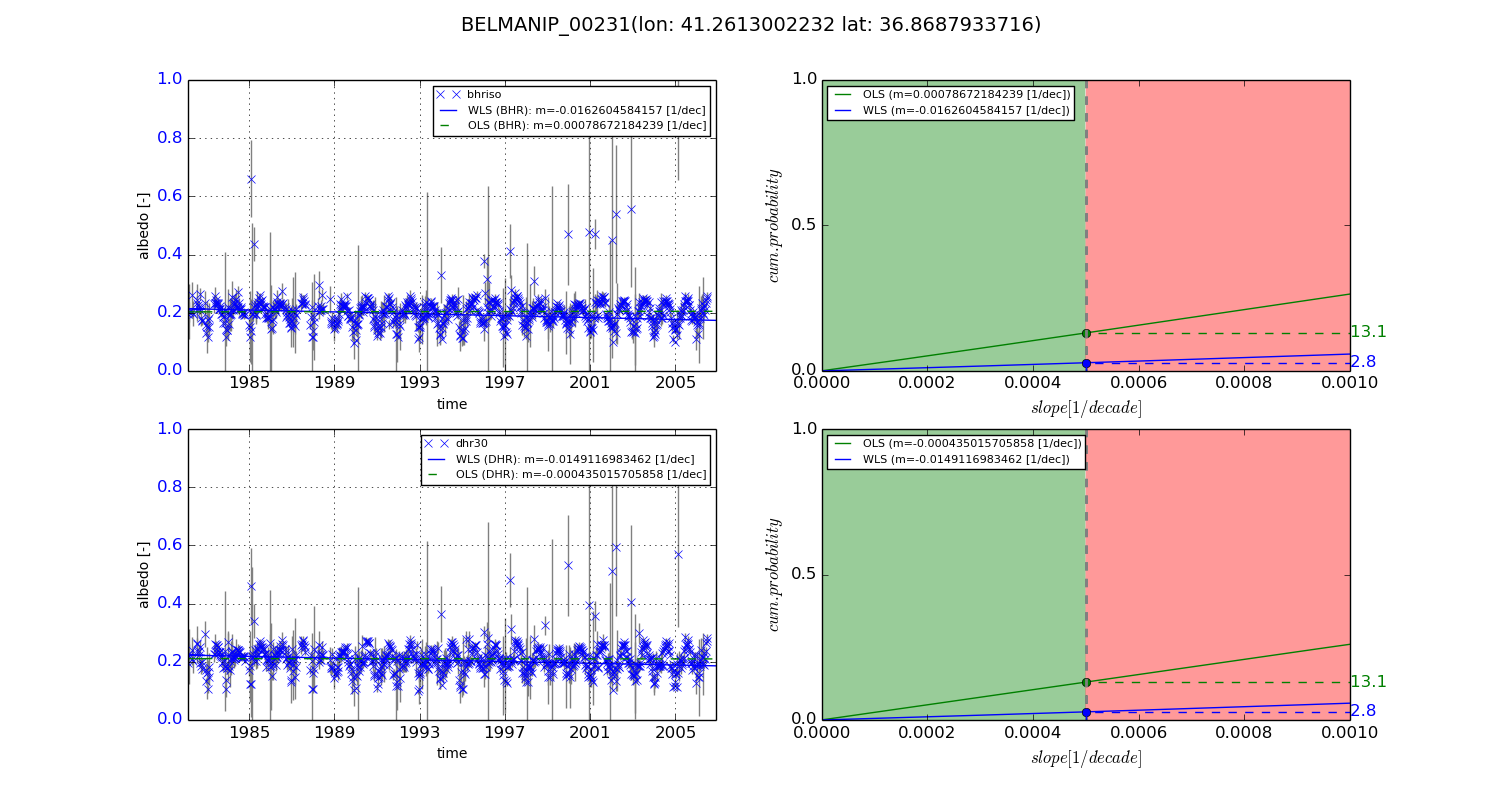
+000 deg (BHR)


BHR statistics

Temporal stability [1/decade]:


abs

rel


Weighted least square:

-0.0162604584157


Ordinary least square:

0.00078672184239


Probabilities that GCOS criteria is met:

Weighted least square:

2.8 %

Ordinary least square:

13.1 %


DHR statistics

Temporal stability [1/decade]:


abs

rel


Weighted least square:

-0.0149116983462


Ordinary least square:

-0.000435015705858


Probabilities that GCOS criteria is met:

Weighted least square:

2.8 %

Ordinary least square:

13.1 %


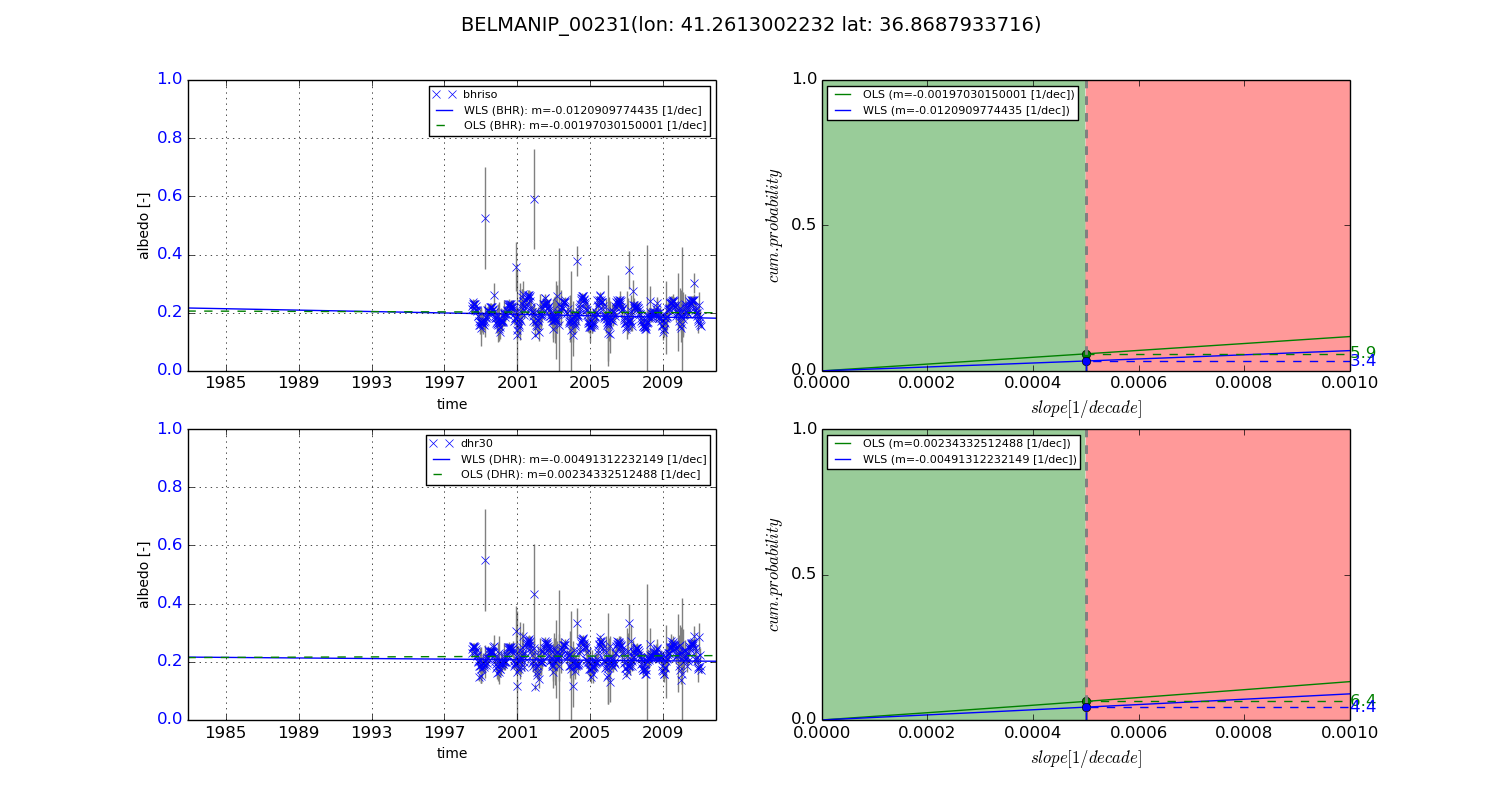
+057/+063 deg (BHR)


BHR statistics

Temporal stability [1/decade]:


abs

rel


Weighted least square:

-0.0120909774435


Ordinary least square:

-0.00197030150001


Probabilities that GCOS criteria is met:

Weighted least square:

3.4 %

Ordinary least square:

5.9 %


DHR statistics

Temporal stability [1/decade]:


abs

rel


Weighted least square:

-0.00491312232149


Ordinary least square:

0.00234332512488


Probabilities that GCOS criteria is met:

Weighted least square:

4.4 %

Ordinary least square:

6.4 %


Temporal anomaly analyis

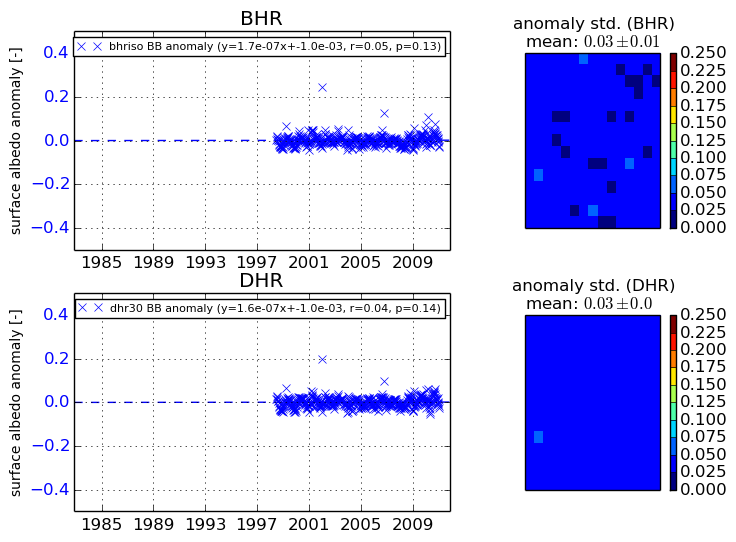
The variance of the temporal anomalies provides an additional measure about the stability of the signal AFTER removal of the mean seasonal cylce.
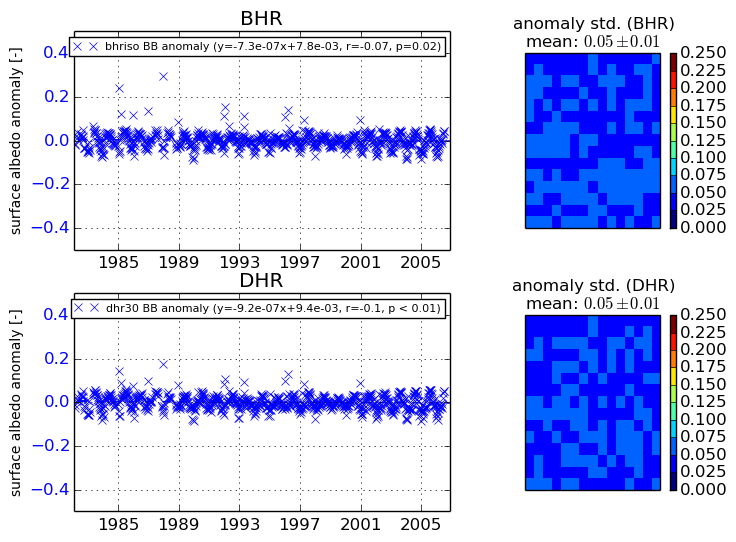
+000 deg


+057/+063 deg