BELMANIP_00233


Location

lon / lat [deg]: 31.0539 / 30.9501

Source network: BELMANIP


Geostationary surface albedo (GSA) data


“+000”


“+057/+063”


Landcover information (based on ESA CCI landcover data)


Landcover fractions @ 2km distance


Landcover fractions @ 20 km distance


Legend


Distance to open water bodies [km]:

25.8

Distance to urban areas [km]:

2.84


Radius: 1 km

Number of landcover classes:

1

Dominant landcover type:

20: cropland, irrigated or post-flooded

Fraction of dominant landcover type [%]:

100.0


Radius: 2 km

Number of landcover classes:

1

Dominant landcover type:

20: cropland, irrigated or post-flooded

Fraction of dominant landcover type [%]:

100.0


Radius: 5 km

Number of landcover classes:

3

Dominant landcover type:

20: cropland, irrigated or post-flooded

Fraction of dominant landcover type [%]:

96.0


Radius: 10 km

Number of landcover classes:

2

Dominant landcover type:

20: cropland, irrigated or post-flooded

Fraction of dominant landcover type [%]:

93.0


Radius: 20 km

Number of landcover classes:

2

Dominant landcover type:

20: cropland, irrigated or post-flooded

Fraction of dominant landcover type [%]:

89.0


Disturbances


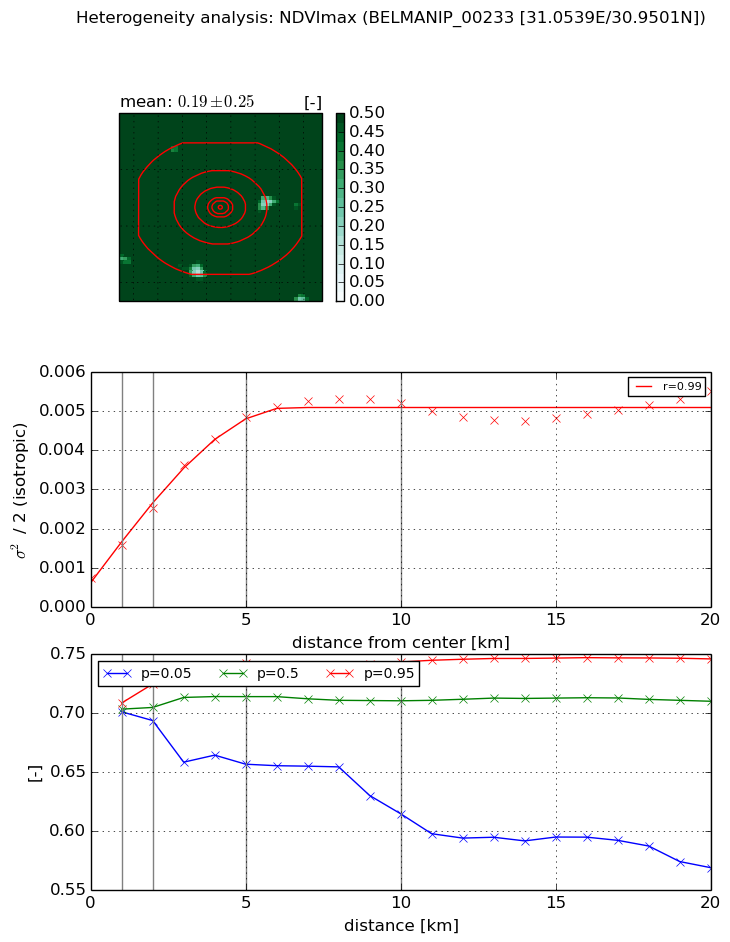
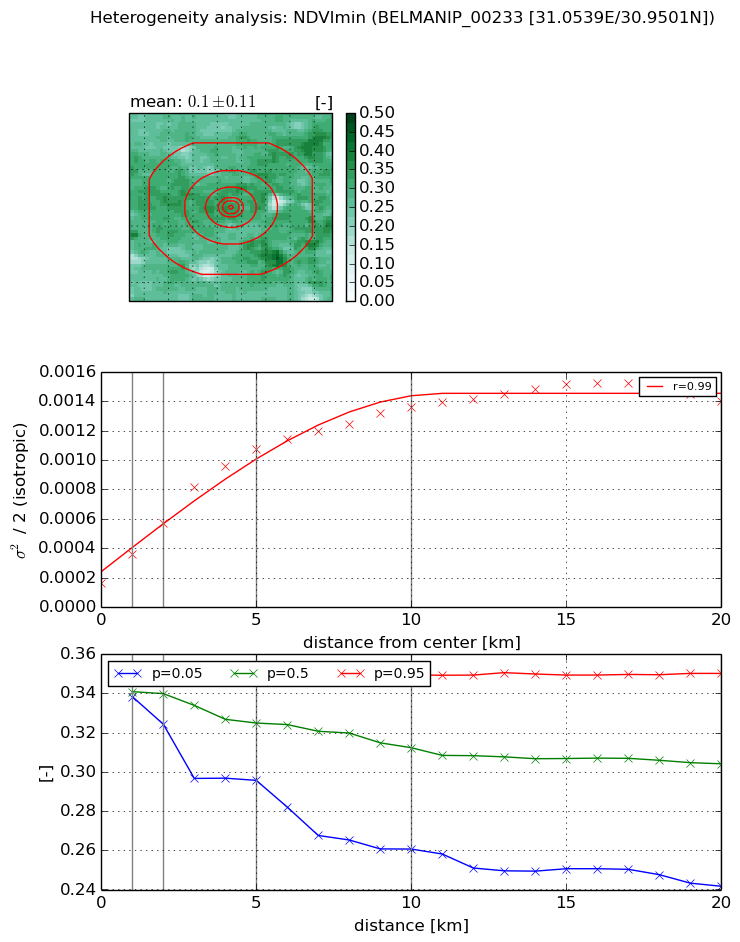
Heterogeneity analysis

The heterogeneity analysis provides information about the spatial and temporal heterogeneity of the site.

Topography


Roman et al. (2009) index


St

0.585625434682

Rcv

0.154583966209

Rse

0.0

Rst

-0.868821945741

Rsv

4.09932240948


Height range @ 1km [m]

3

Height range @ 2km [m]

4

Height range @ 5km [m]

4

Height range @ 10km [m]

-999

Height range @ 20km [m]

-999


Variance slope @ 1 km

0

Variance slope @ 2 km

0

Variance slope @ 5 km

0

Variance slope @ 10 km

-999

Variance slope @ 20 km

-999


NDVI (max. NDVI composite)


Roman et al. (2009) index


St

3.03551696266

Rcv

0.0627620012525

Rse

0.0

Rst

0.399494611319

Rsv

-0.526042921544


NDVI range @ 1km [-]

0.01

NDVI range @ 2km [-]

0.03

NDVI range @ 5km [-]

0.09

NDVI range @ 10km [-]

0.13

NDVI range @ 20km [-]

0.18


Variance slope @ 1 km

0.000838012802603

Variance slope @ 2 km

0.00089022209421

Variance slope @ 5 km

0.000852496951275

Variance slope @ 10 km

0.000452356446259

Variance slope @ 20 km

0.00014542903682


NDVI (min. NDVI composite)I


Roman et al. (2009) index


St

2.44390033005

Rcv

0.113186057119

Rse

0.0

Rst

-0.347753163417

Rsv

0.766606748957


NDVI range @ 1km [-]

0.01

NDVI range @ 2km [-]

0.03

NDVI range @ 5km [-]

0.06

NDVI range @ 10km [-]

0.09

NDVI range @ 20km [-]

0.11


NDVI slope @ 1 km

0.000194254649968

NDVI slope @ 2 km

0.000203013657992

NDVI slope @ 5 km

0.000188448710498

NDVI slope @ 10 km

0.000115992668749

NDVI slope @ 20 km

5.5371077581e-05


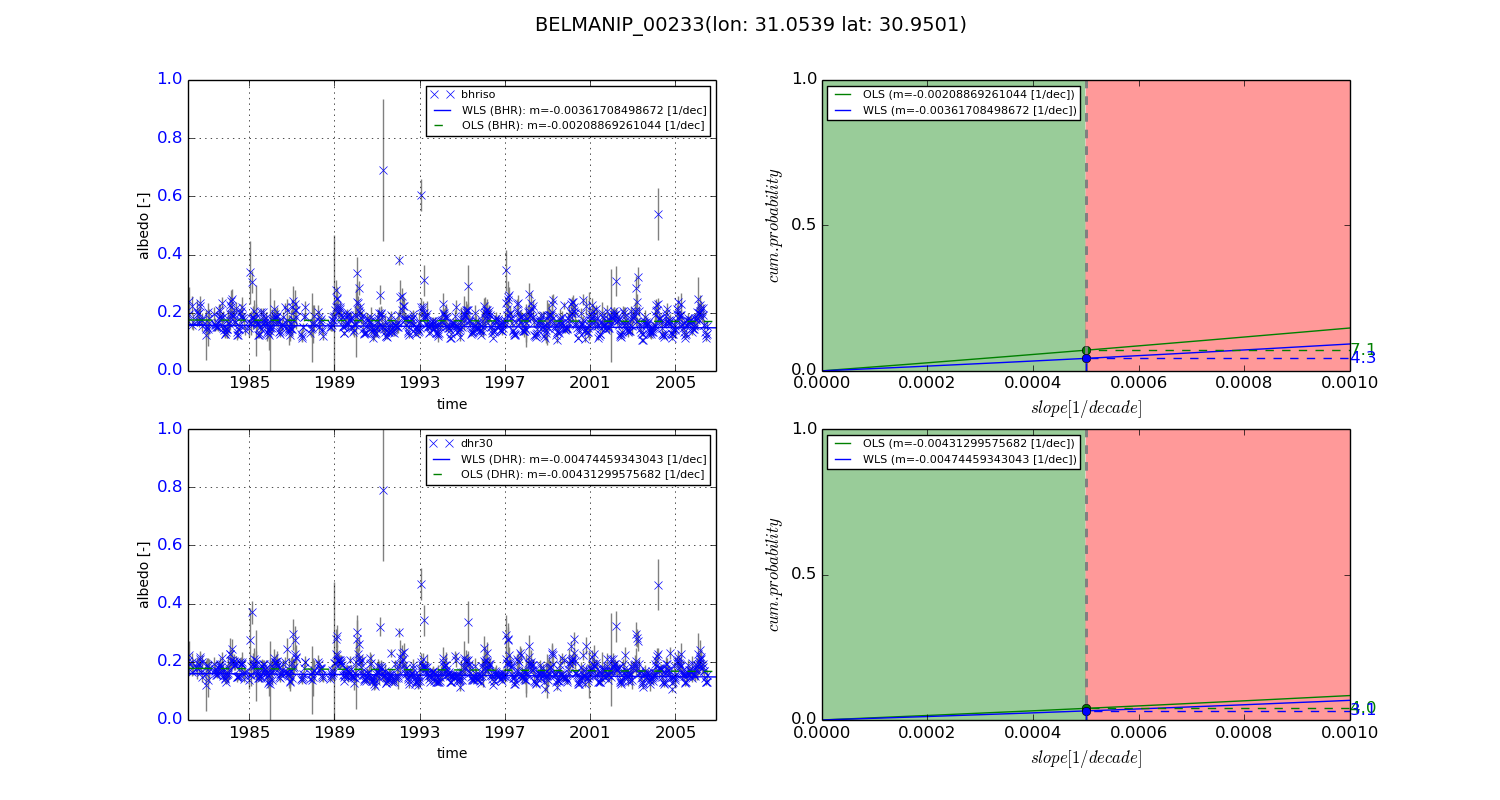
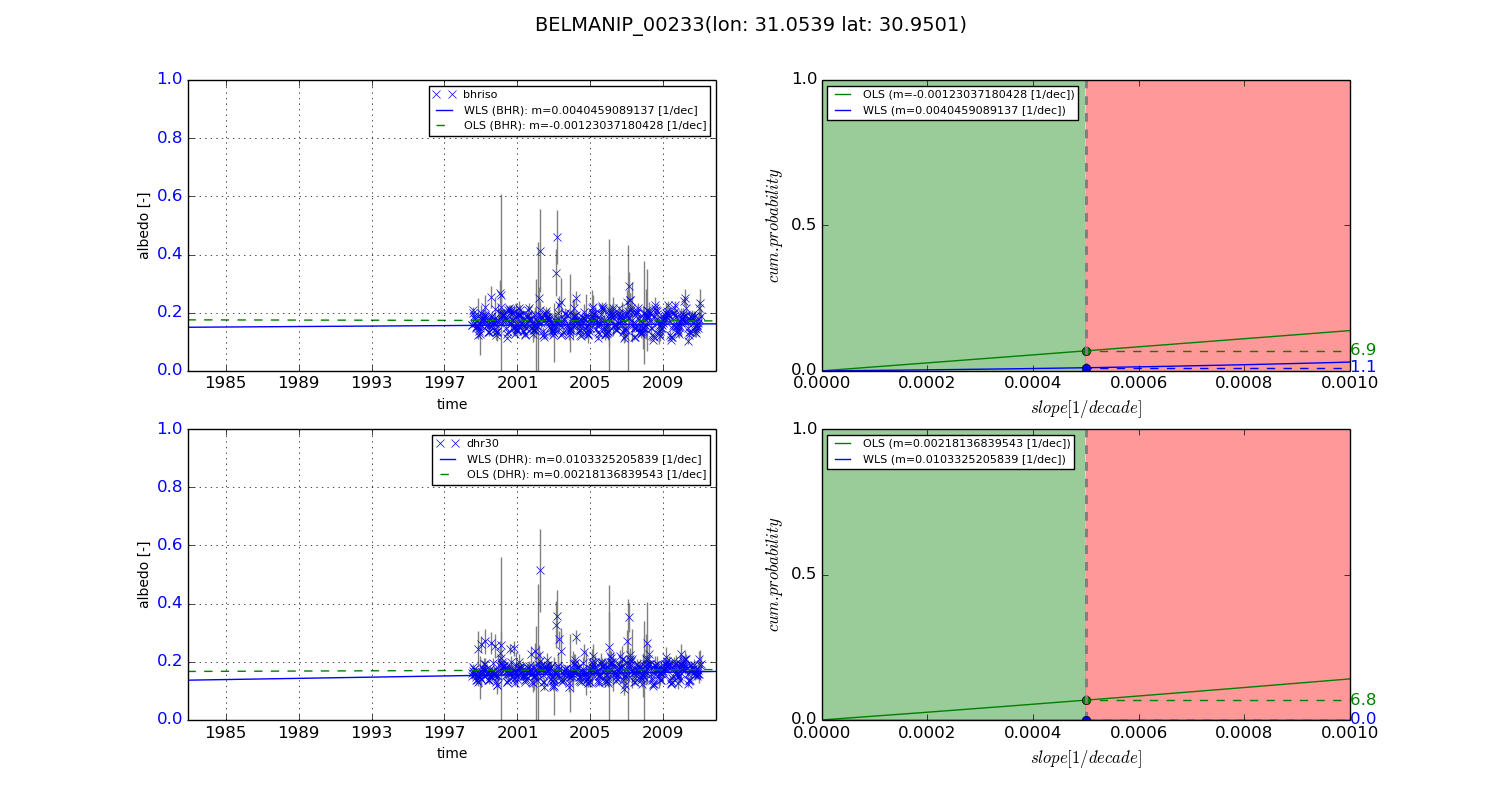
Temporal stability analysis

+000 deg (BHR)


BHR statistics

Temporal stability [1/decade]:


abs

rel


Weighted least square:

-0.00361708498672


Ordinary least square:

-0.00208869261044


Probabilities that GCOS criteria is met:

Weighted least square:

4.3 %

Ordinary least square:

7.1 %


DHR statistics

Temporal stability [1/decade]:


abs

rel


Weighted least square:

-0.00474459343043


Ordinary least square:

-0.00431299575682


Probabilities that GCOS criteria is met:

Weighted least square:

3.1 %

Ordinary least square:

4.0 %


+057/+063 deg (BHR)


BHR statistics

Temporal stability [1/decade]:


abs

rel


Weighted least square:

0.0040459089137


Ordinary least square:

-0.00123037180428


Probabilities that GCOS criteria is met:

Weighted least square:

1.1 %

Ordinary least square:

6.9 %


DHR statistics

Temporal stability [1/decade]:


abs

rel


Weighted least square:

0.0103325205839


Ordinary least square:

0.00218136839543


Probabilities that GCOS criteria is met:

Weighted least square:

0.0 %

Ordinary least square:

6.8 %


Temporal anomaly analyis

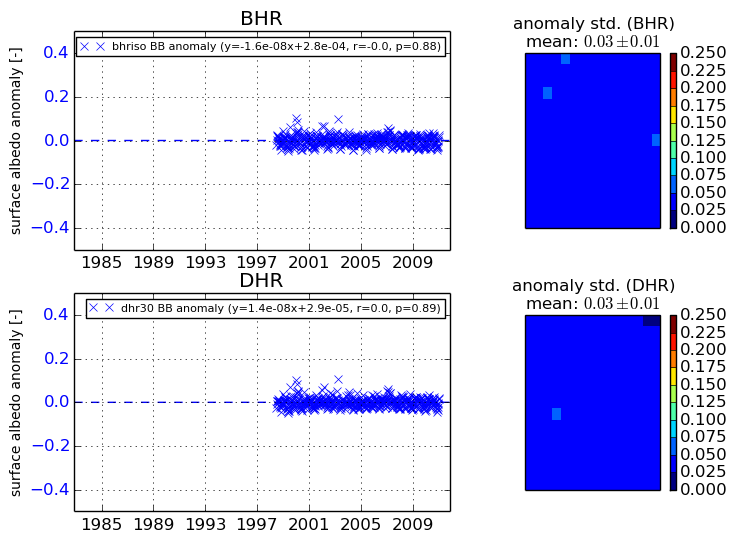
The variance of the temporal anomalies provides an additional measure about the stability of the signal AFTER removal of the mean seasonal cylce.
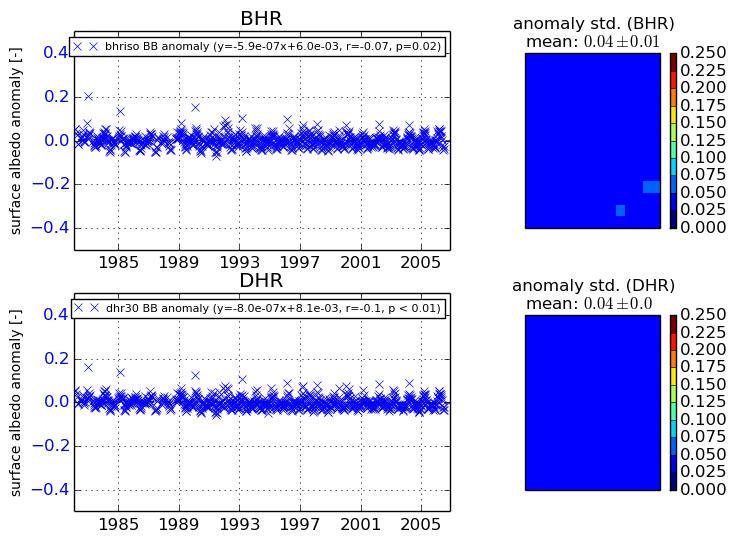
+000 deg


+057/+063 deg