BELMANIP_00234


Location

lon / lat [deg]: 40.858 / 38.0088

Source network: BELMANIP


Geostationary surface albedo (GSA) data


“+000”


“+057/+063”


Landcover information (based on ESA CCI landcover data)


Landcover fractions @ 2km distance


Landcover fractions @ 20 km distance


Legend


Distance to open water bodies [km]:

8.37

Distance to urban areas [km]:

10.03


Radius: 1 km

Number of landcover classes:

1

Dominant landcover type:

10: cropland, rainfed

Fraction of dominant landcover type [%]:

100.0


Radius: 2 km

Number of landcover classes:

1

Dominant landcover type:

10: cropland, rainfed

Fraction of dominant landcover type [%]:

100.0


Radius: 5 km

Number of landcover classes:

1

Dominant landcover type:

10: cropland, rainfed

Fraction of dominant landcover type [%]:

99.0


Radius: 10 km

Number of landcover classes:

1

Dominant landcover type:

10: cropland, rainfed

Fraction of dominant landcover type [%]:

99.0


Radius: 20 km

Number of landcover classes:

2

Dominant landcover type:

10: cropland, rainfed

Fraction of dominant landcover type [%]:

92.0


Disturbances


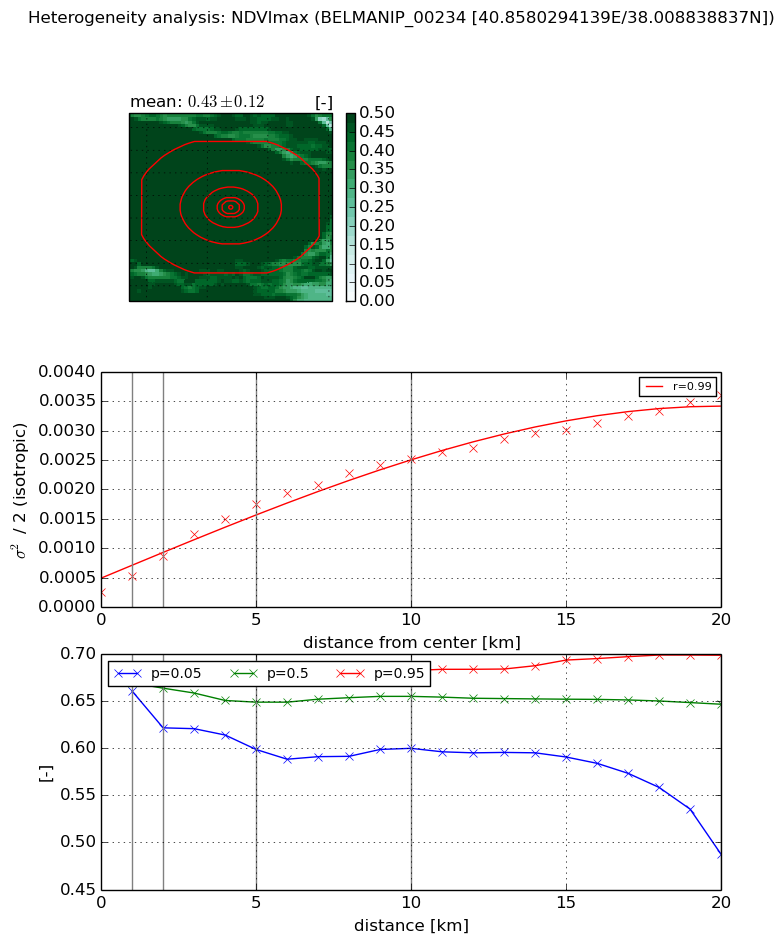
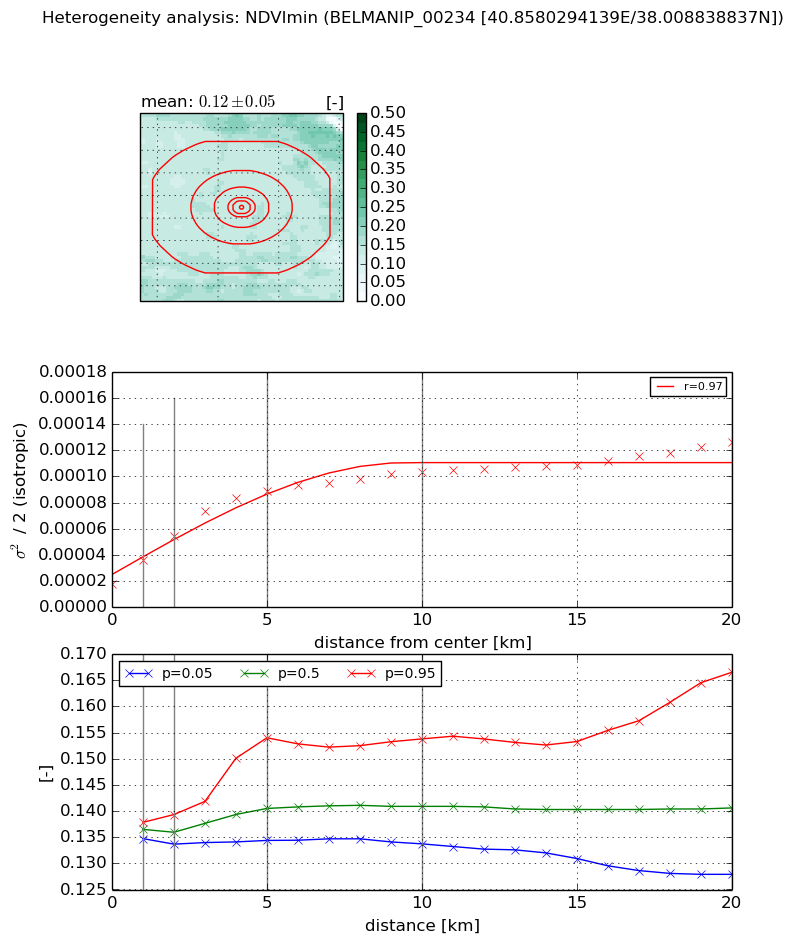
Heterogeneity analysis

The heterogeneity analysis provides information about the spatial and temporal heterogeneity of the site.

Topography


Roman et al. (2009) index


St

2.22760443926

Rcv

0.571862036465

Rse

0.0

Rst

0.0137440402945

Rsv

0.761132126451


Height range @ 1km [m]

42

Height range @ 2km [m]

66

Height range @ 5km [m]

129

Height range @ 10km [m]

-999

Height range @ 20km [m]

-999


Variance slope @ 1 km

395

Variance slope @ 2 km

479

Variance slope @ 5 km

493

Variance slope @ 10 km

-999

Variance slope @ 20 km

-999


NDVI (max. NDVI composite)


Roman et al. (2009) index


St

1.61962404441

Rcv

0.520486489644

Rse

0.0

Rst

-0.331795355941

Rsv

-0.999999867788


NDVI range @ 1km [-]

0.02

NDVI range @ 2km [-]

0.06

NDVI range @ 5km [-]

0.08

NDVI range @ 10km [-]

0.08

NDVI range @ 20km [-]

0.21


Variance slope @ 1 km

0.000271035127092

Variance slope @ 2 km

0.00029908880188

Variance slope @ 5 km

0.000305588952983

Variance slope @ 10 km

0.000228009131928

Variance slope @ 20 km

0.000152490814865


NDVI (min. NDVI composite)I


Roman et al. (2009) index


St

2.09054518062

Rcv

1.21957728526

Rse

0.0

Rst

-0.0461611031637

Rsv

0.16929397912


NDVI range @ 1km [-]

0.0

NDVI range @ 2km [-]

0.01

NDVI range @ 5km [-]

0.02

NDVI range @ 10km [-]

0.02

NDVI range @ 20km [-]

0.04


NDVI slope @ 1 km

1.82341061541e-05

NDVI slope @ 2 km

1.83748068729e-05

NDVI slope @ 5 km

1.47941271975e-05

NDVI slope @ 10 km

7.93761018898e-06

NDVI slope @ 20 km

3.95741605863e-06


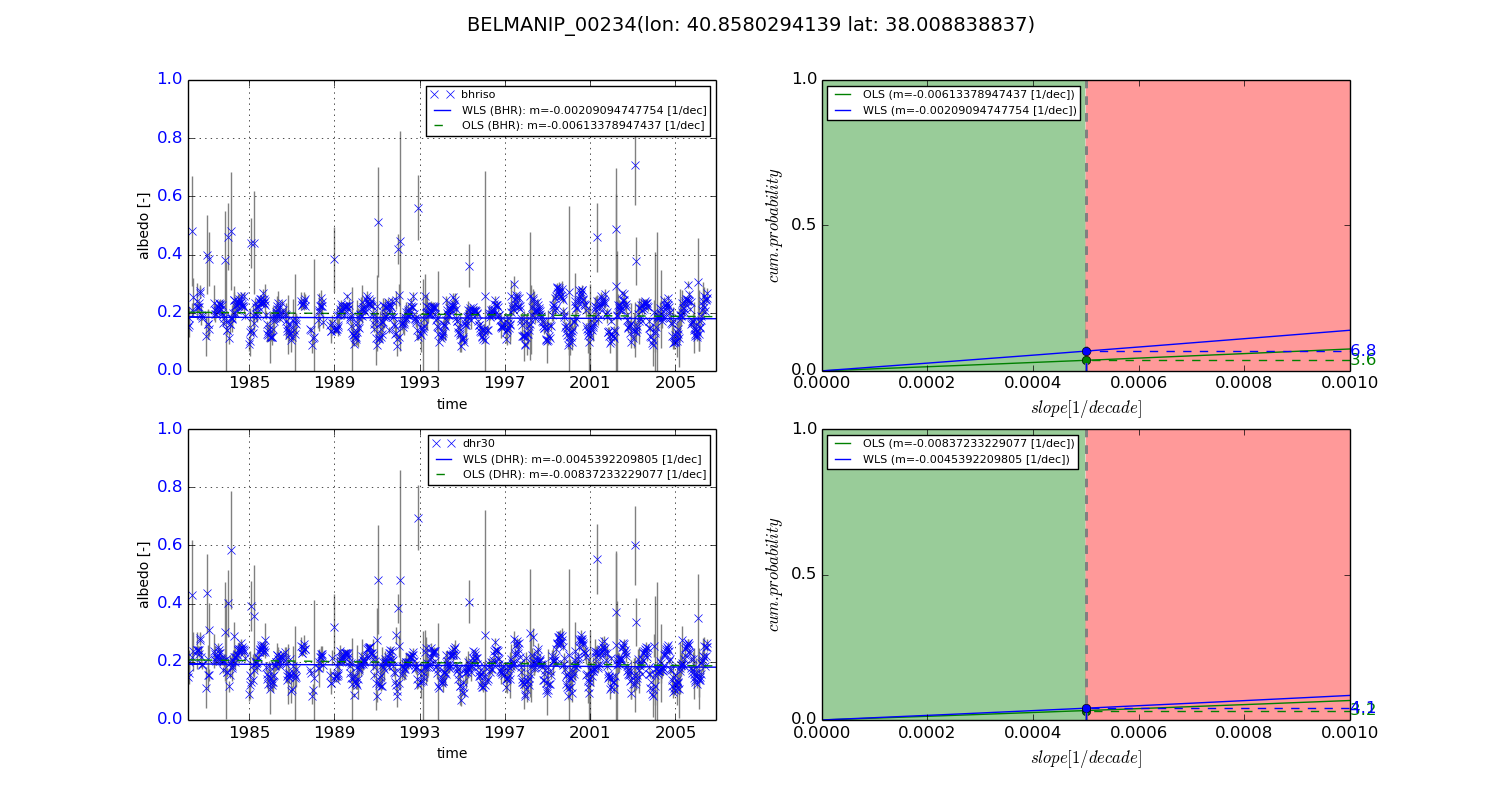
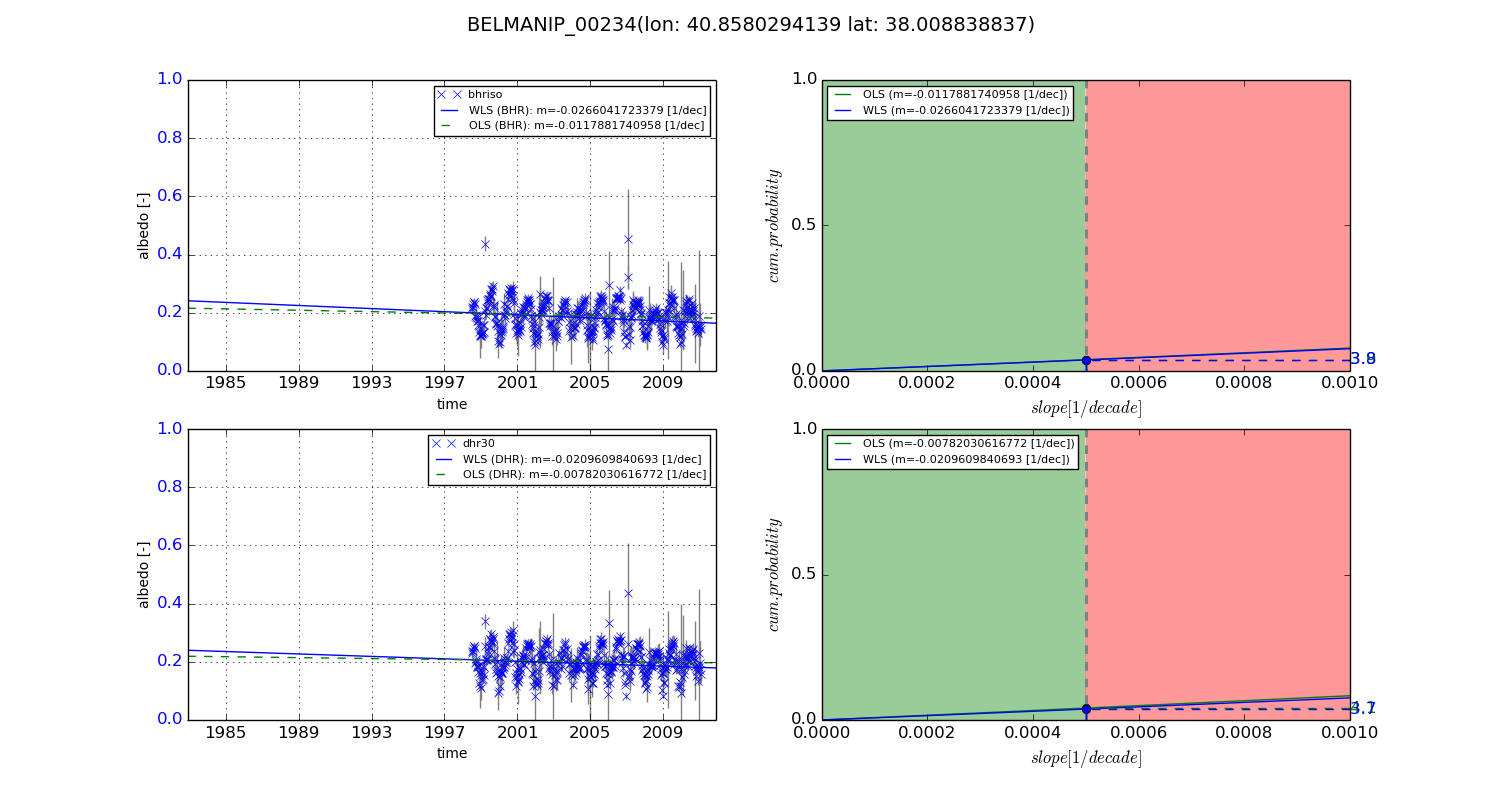
Temporal stability analysis

+000 deg (BHR)


BHR statistics

Temporal stability [1/decade]:


abs

rel


Weighted least square:

-0.00209094747754


Ordinary least square:

-0.00613378947437


Probabilities that GCOS criteria is met:

Weighted least square:

6.8 %

Ordinary least square:

3.6 %


DHR statistics

Temporal stability [1/decade]:


abs

rel


Weighted least square:

-0.0045392209805


Ordinary least square:

-0.00837233229077


Probabilities that GCOS criteria is met:

Weighted least square:

4.1 %

Ordinary least square:

3.2 %


+057/+063 deg (BHR)


BHR statistics

Temporal stability [1/decade]:


abs

rel


Weighted least square:

-0.0266041723379


Ordinary least square:

-0.0117881740958


Probabilities that GCOS criteria is met:

Weighted least square:

3.8 %

Ordinary least square:

3.9 %


DHR statistics

Temporal stability [1/decade]:


abs

rel


Weighted least square:

-0.0209609840693


Ordinary least square:

-0.00782030616772


Probabilities that GCOS criteria is met:

Weighted least square:

3.7 %

Ordinary least square:

4.1 %


Temporal anomaly analyis

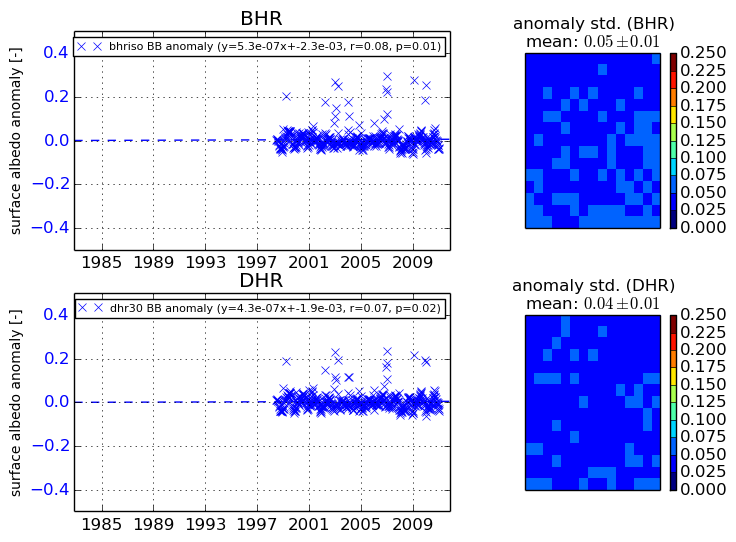
The variance of the temporal anomalies provides an additional measure about the stability of the signal AFTER removal of the mean seasonal cylce.
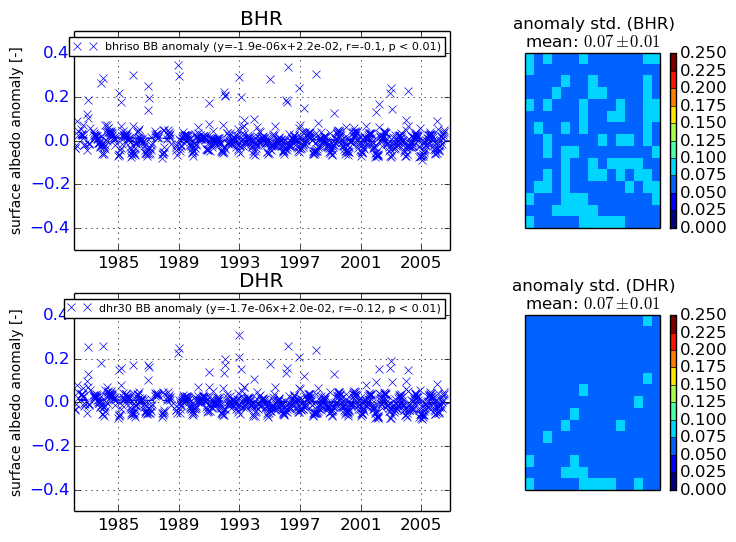
+000 deg


+057/+063 deg