BELMANIP_00236


Location

lon / lat [deg]: 7.4672 / 32.9457

Source network: BELMANIP


Geostationary surface albedo (GSA) data


“+000”


“+057/+063”


Landcover information (based on ESA CCI landcover data)


Landcover fractions @ 2km distance


Landcover fractions @ 20 km distance


Legend


Distance to open water bodies [km]:

none in region

Distance to urban areas [km]:

none in region


Radius: 1 km

Number of landcover classes:

1

Dominant landcover type:

200: bare areas

Fraction of dominant landcover type [%]:

100.0


Radius: 2 km

Number of landcover classes:

1

Dominant landcover type:

200: bare areas

Fraction of dominant landcover type [%]:

100.0


Radius: 5 km

Number of landcover classes:

1

Dominant landcover type:

200: bare areas

Fraction of dominant landcover type [%]:

100.0


Radius: 10 km

Number of landcover classes:

1

Dominant landcover type:

200: bare areas

Fraction of dominant landcover type [%]:

100.0


Radius: 20 km

Number of landcover classes:

1

Dominant landcover type:

200: bare areas

Fraction of dominant landcover type [%]:

100.0


Disturbances


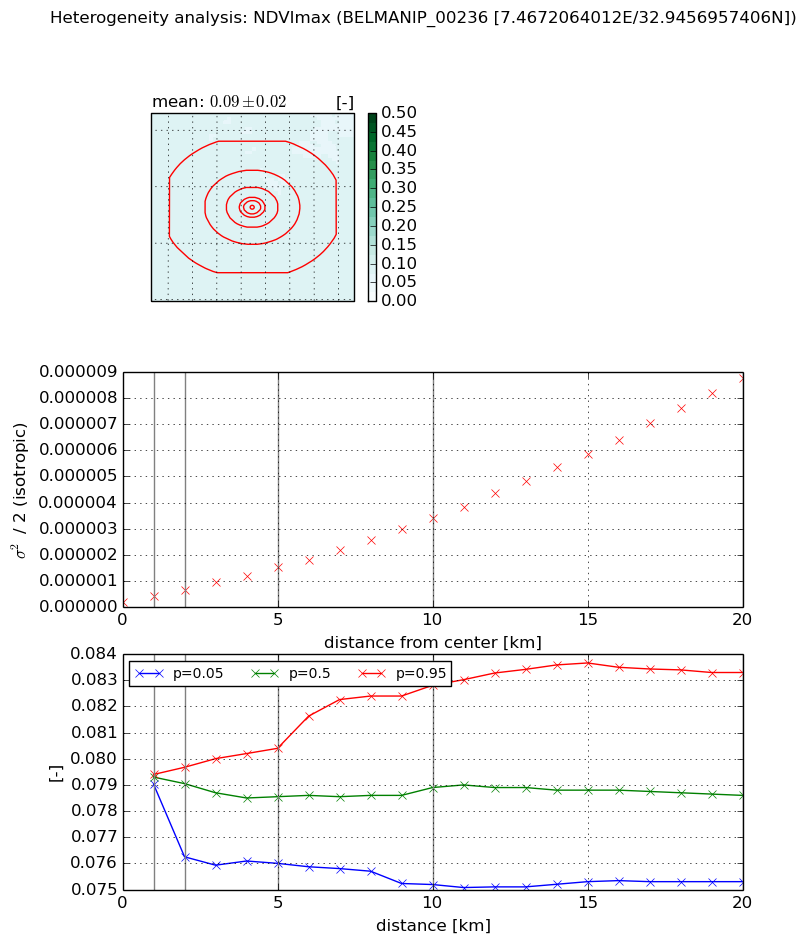
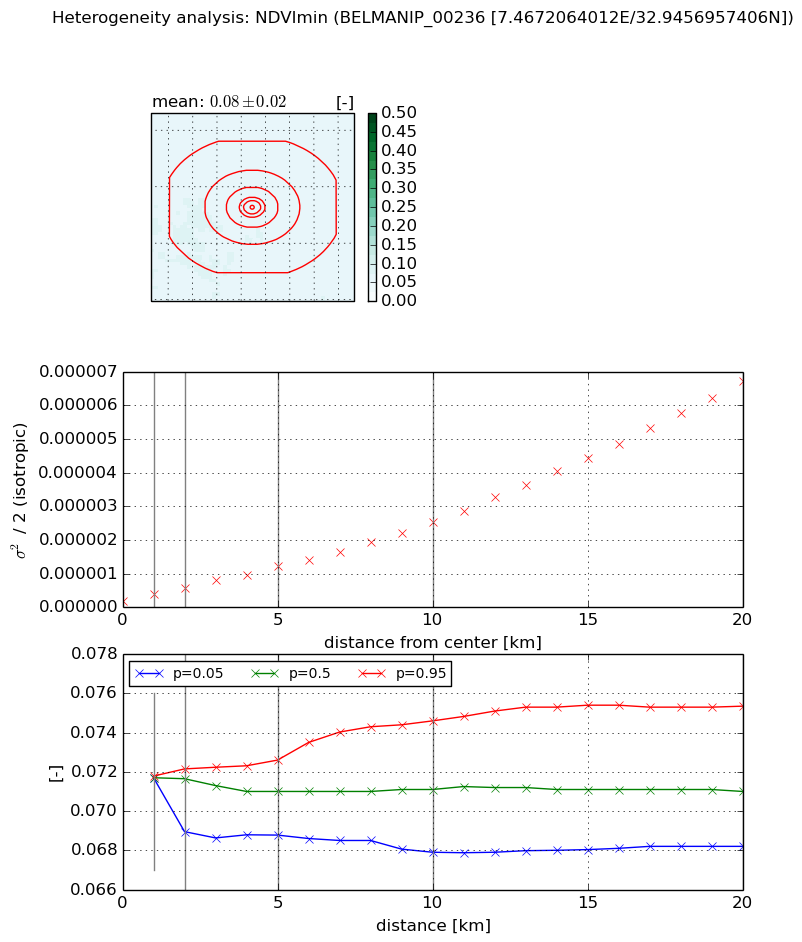
Heterogeneity analysis

The heterogeneity analysis provides information about the spatial and temporal heterogeneity of the site.

Topography


Roman et al. (2009) index


St

24.849498848

Rcv

0.0898336258802

Rse

0.0

Rst

0.024227546856

Rsv

0.00666560804736


Height range @ 1km [m]

13

Height range @ 2km [m]

19

Height range @ 5km [m]

23

Height range @ 10km [m]

-999

Height range @ 20km [m]

-999


Variance slope @ 1 km

31

Variance slope @ 2 km

23

Variance slope @ 5 km

4

Variance slope @ 10 km

-999

Variance slope @ 20 km

-999


NDVI (max. NDVI composite)


Roman et al. (2009) index


St

2.1139952068

Rcv

0.174545485342

Rse

0.0

Rst

-0.244568824002

Rsv

-0.999999598935


NDVI range @ 1km [-]

0.0

NDVI range @ 2km [-]

0.0

NDVI range @ 5km [-]

0.0

NDVI range @ 10km [-]

0.01

NDVI range @ 20km [-]

0.01


Variance slope @ 1 km

2.32618541014e-07

Variance slope @ 2 km

2.3610361329e-07

Variance slope @ 5 km

2.64512458294e-07

Variance slope @ 10 km

3.18171770784e-07

Variance slope @ 20 km

4.33369989809e-07


NDVI (min. NDVI composite)I


Roman et al. (2009) index


St

2.2377638808

Rcv

0.0595902321283

Rse

0.0

Rst

-0.281034031035

Rsv

-0.999999752504


NDVI range @ 1km [-]

0.0

NDVI range @ 2km [-]

0.0

NDVI range @ 5km [-]

0.0

NDVI range @ 10km [-]

0.01

NDVI range @ 20km [-]

0.01


NDVI slope @ 1 km

2.02978199137e-07

NDVI slope @ 2 km

1.96681146848e-07

NDVI slope @ 5 km

2.02823364033e-07

NDVI slope @ 10 km

2.30060758361e-07

NDVI slope @ 20 km

3.2541769335e-07


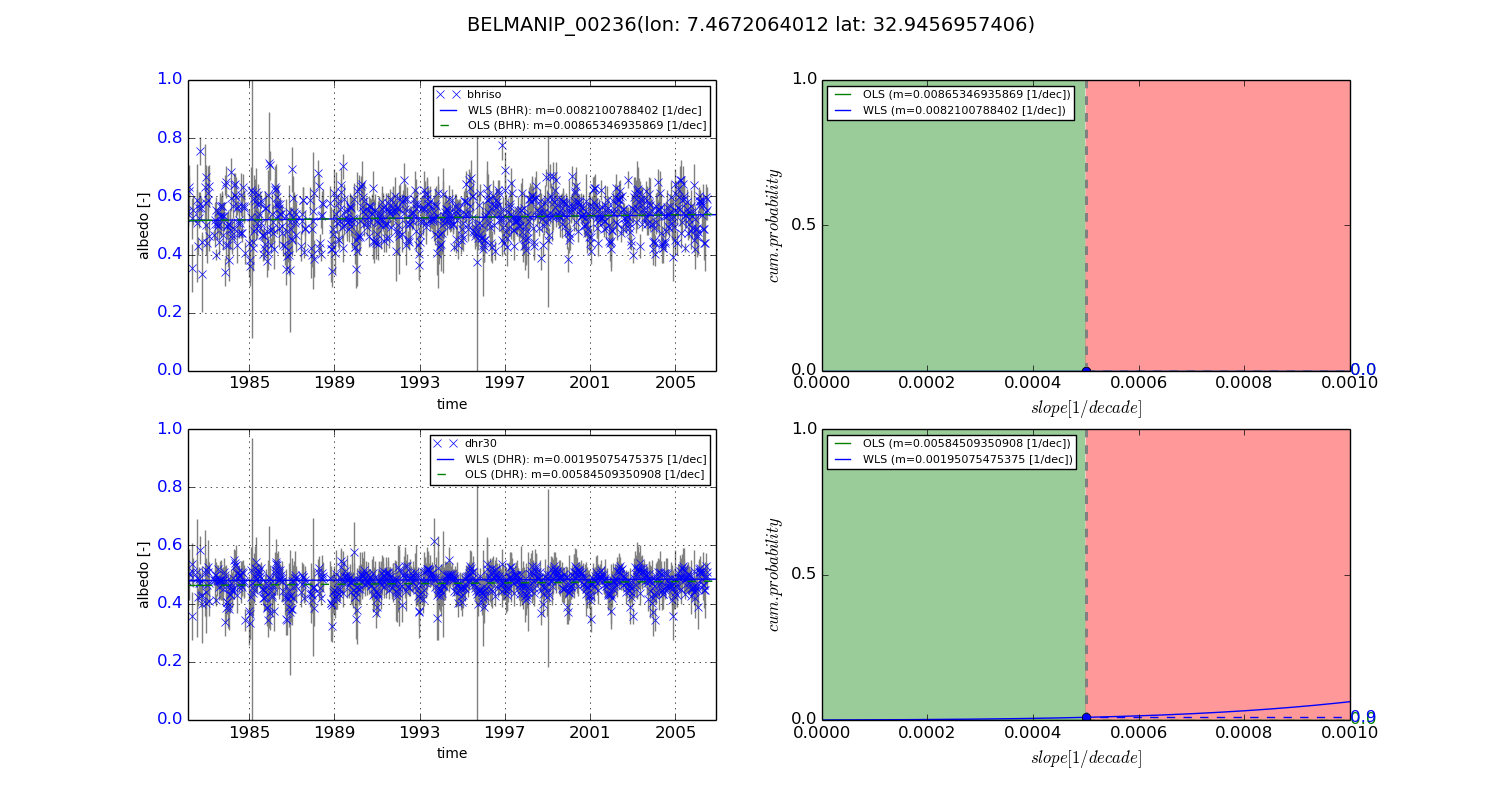
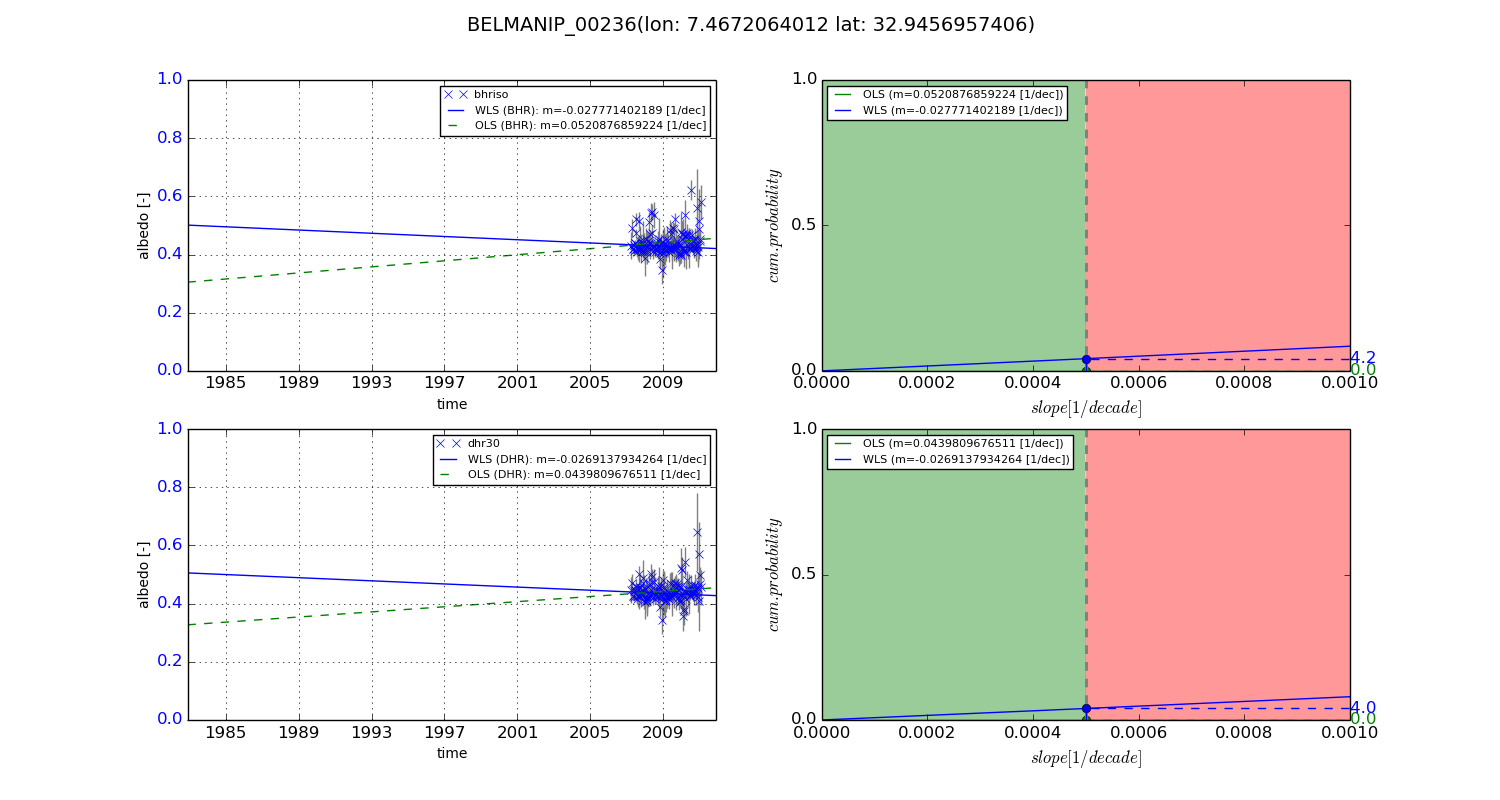
Temporal stability analysis

+000 deg (BHR)


BHR statistics

Temporal stability [1/decade]:


abs

rel


Weighted least square:

0.0082100788402


Ordinary least square:

0.00865346935869


Probabilities that GCOS criteria is met:

Weighted least square:

0.0 %

Ordinary least square:

0.0 %


DHR statistics

Temporal stability [1/decade]:


abs

rel


Weighted least square:

0.00195075475375


Ordinary least square:

0.00584509350908


Probabilities that GCOS criteria is met:

Weighted least square:

0.9 %

Ordinary least square:

0.0 %


+057/+063 deg (BHR)


BHR statistics

Temporal stability [1/decade]:


abs

rel


Weighted least square:

-0.027771402189


Ordinary least square:

0.0520876859224


Probabilities that GCOS criteria is met:

Weighted least square:

4.2 %

Ordinary least square:

0.0 %


DHR statistics

Temporal stability [1/decade]:


abs

rel


Weighted least square:

-0.0269137934264


Ordinary least square:

0.0439809676511


Probabilities that GCOS criteria is met:

Weighted least square:

4.0 %

Ordinary least square:

0.0 %


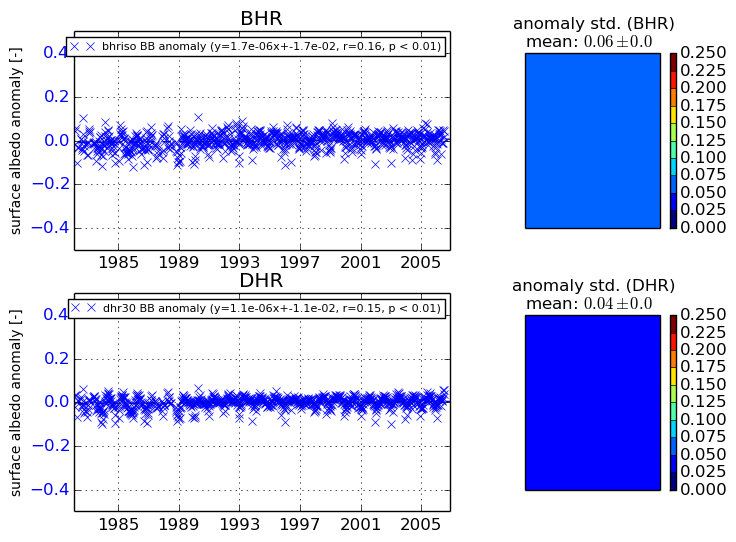
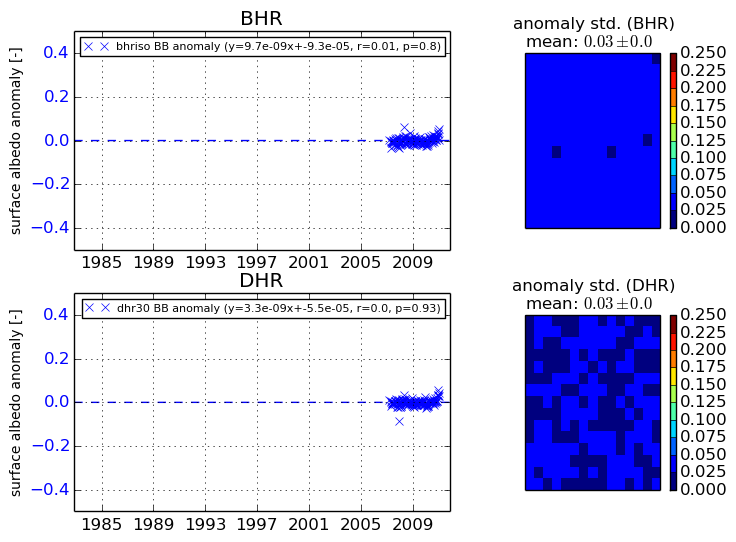
Temporal anomaly analyis

The variance of the temporal anomalies provides an additional measure about the stability of the signal AFTER removal of the mean seasonal cylce.
+000 deg


+057/+063 deg