BELMANIP_00237


Location

lon / lat [deg]: 5.3702 / 30.4644

Source network: BELMANIP


Geostationary surface albedo (GSA) data


“+000”


“+057/+063”


Landcover information (based on ESA CCI landcover data)


Landcover fractions @ 2km distance


Landcover fractions @ 20 km distance


Legend


Distance to open water bodies [km]:

none in region

Distance to urban areas [km]:

none in region


Radius: 1 km

Number of landcover classes:

1

Dominant landcover type:

200: bare areas

Fraction of dominant landcover type [%]:

100.0


Radius: 2 km

Number of landcover classes:

1

Dominant landcover type:

200: bare areas

Fraction of dominant landcover type [%]:

100.0


Radius: 5 km

Number of landcover classes:

1

Dominant landcover type:

200: bare areas

Fraction of dominant landcover type [%]:

100.0


Radius: 10 km

Number of landcover classes:

1

Dominant landcover type:

200: bare areas

Fraction of dominant landcover type [%]:

100.0


Radius: 20 km

Number of landcover classes:

1

Dominant landcover type:

200: bare areas

Fraction of dominant landcover type [%]:

100.0


Disturbances


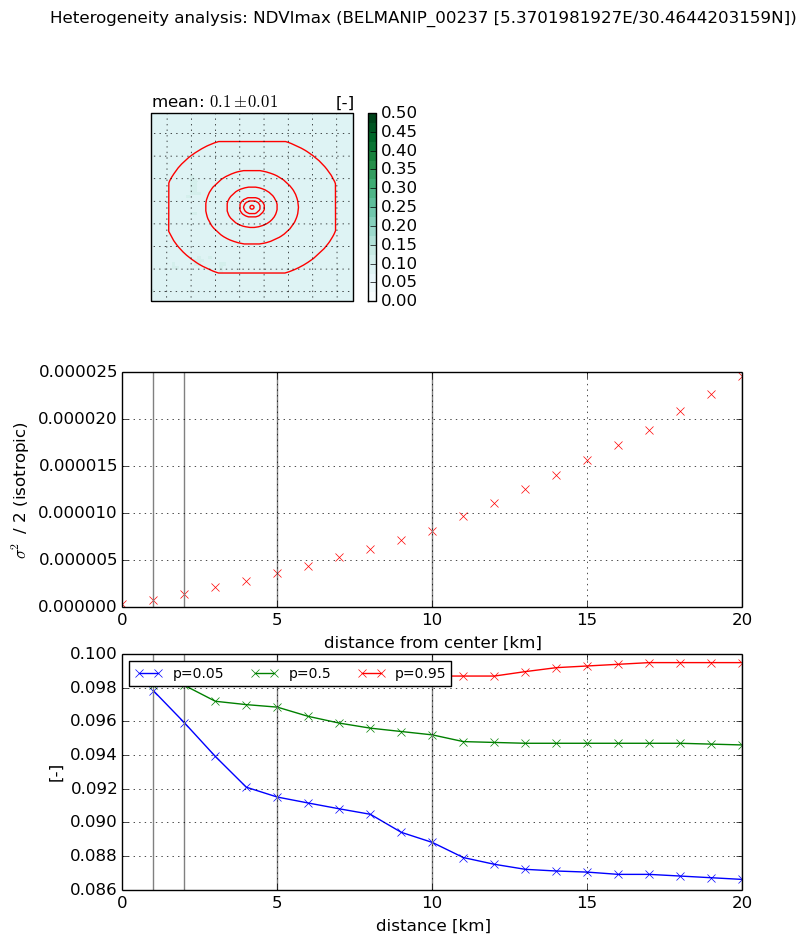
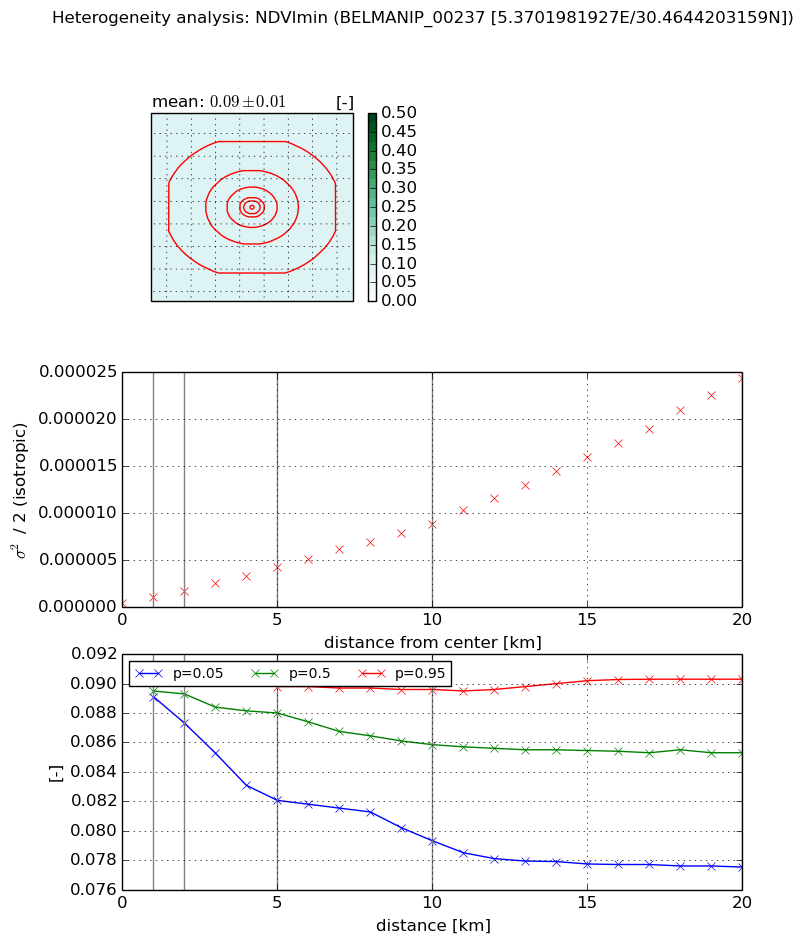
Heterogeneity analysis

The heterogeneity analysis provides information about the spatial and temporal heterogeneity of the site.

Topography


Roman et al. (2009) index


St

4.74116186003

Rcv

0.211008272973

Rse

0.0

Rst

0.0733112417221

Rsv

-0.348436777658


Height range @ 1km [m]

4

Height range @ 2km [m]

5

Height range @ 5km [m]

9

Height range @ 10km [m]

-999

Height range @ 20km [m]

-999


Variance slope @ 1 km

3

Variance slope @ 2 km

2

Variance slope @ 5 km

1

Variance slope @ 10 km

-999

Variance slope @ 20 km

-999


NDVI (max. NDVI composite)


Roman et al. (2009) index


St

1.64967872244

Rcv

0.359846276814

Rse

0.0

Rst

-0.000549681805546

Rsv

1.45813995337


NDVI range @ 1km [-]

0.0

NDVI range @ 2km [-]

0.0

NDVI range @ 5km [-]

0.01

NDVI range @ 10km [-]

0.01

NDVI range @ 20km [-]

0.01


Variance slope @ 1 km

4.88255141652e-07

Variance slope @ 2 km

5.17299769283e-07

Variance slope @ 5 km

6.55152370708e-07

Variance slope @ 10 km

7.89568425223e-07

Variance slope @ 20 km

1.20863582882e-06


NDVI (min. NDVI composite)I


Roman et al. (2009) index


St

5.61016127739e-07

Rcv

0.489216243096

Rse

0.0

Rst

0.118926146815

Rsv

5347439.24549


NDVI range @ 1km [-]

0.0

NDVI range @ 2km [-]

0.0

NDVI range @ 5km [-]

0.01

NDVI range @ 10km [-]

0.01

NDVI range @ 20km [-]

0.01


NDVI slope @ 1 km

6.15071631856e-07

NDVI slope @ 2 km

6.36012931956e-07

NDVI slope @ 5 km

7.62042342458e-07

NDVI slope @ 10 km

8.5310899481e-07

NDVI slope @ 20 km

1.18666757677e-06


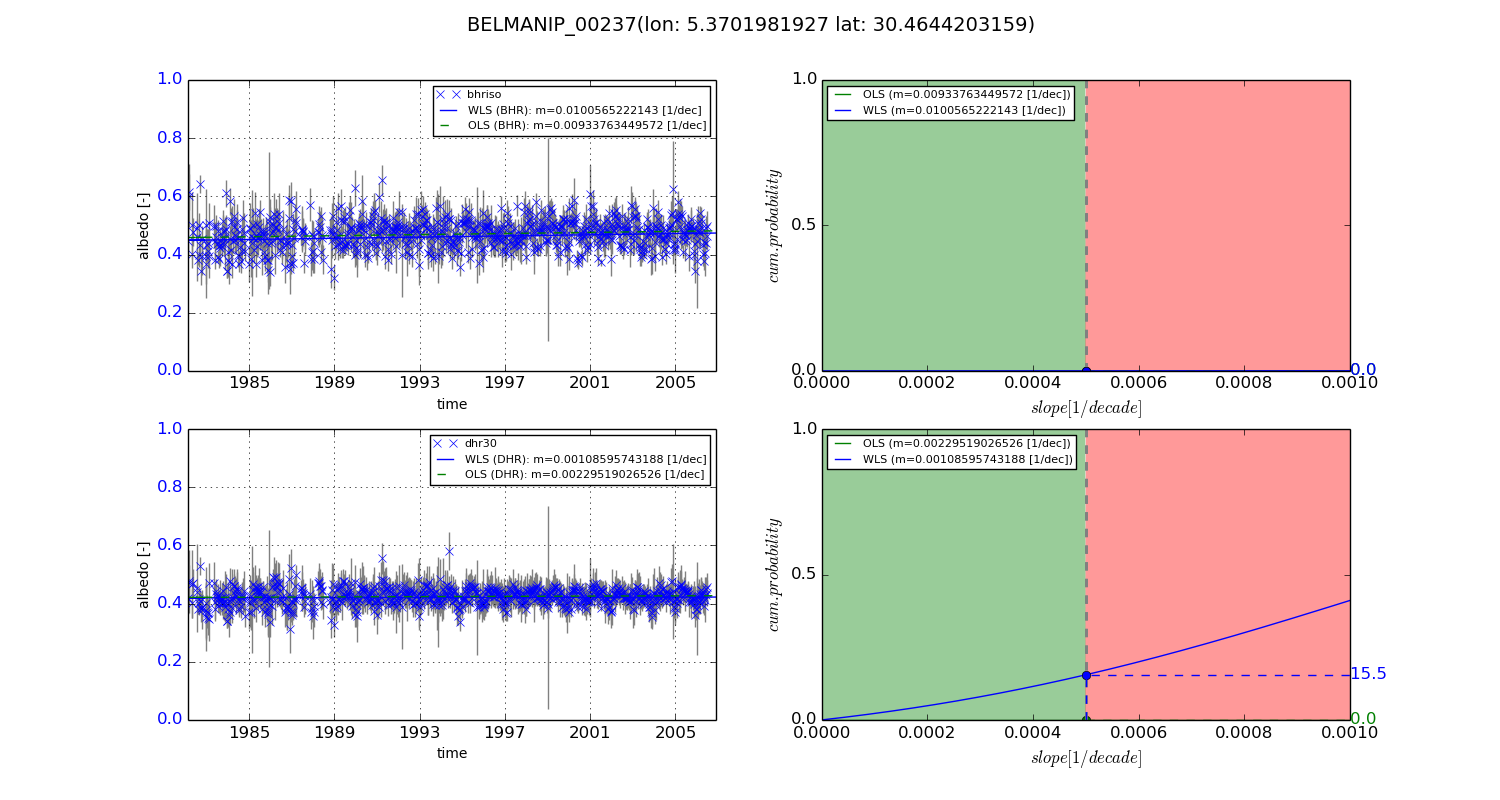
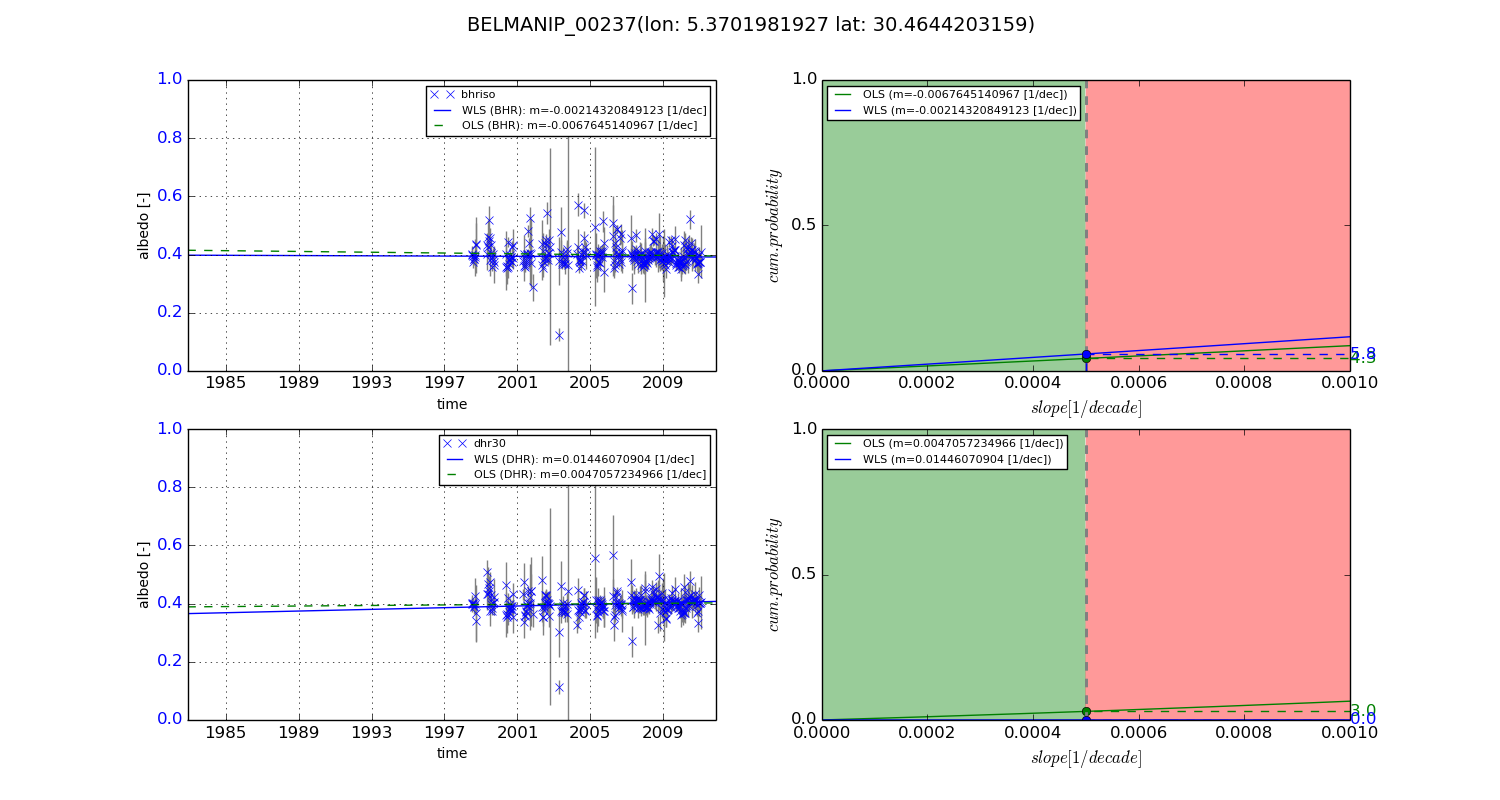
Temporal stability analysis

+000 deg (BHR)


BHR statistics

Temporal stability [1/decade]:


abs

rel


Weighted least square:

0.0100565222143


Ordinary least square:

0.00933763449572


Probabilities that GCOS criteria is met:

Weighted least square:

0.0 %

Ordinary least square:

0.0 %


DHR statistics

Temporal stability [1/decade]:


abs

rel


Weighted least square:

0.00108595743188


Ordinary least square:

0.00229519026526


Probabilities that GCOS criteria is met:

Weighted least square:

15.5 %

Ordinary least square:

0.0 %


+057/+063 deg (BHR)


BHR statistics

Temporal stability [1/decade]:


abs

rel


Weighted least square:

-0.00214320849123


Ordinary least square:

-0.0067645140967


Probabilities that GCOS criteria is met:

Weighted least square:

5.8 %

Ordinary least square:

4.3 %


DHR statistics

Temporal stability [1/decade]:


abs

rel


Weighted least square:

0.01446070904


Ordinary least square:

0.0047057234966


Probabilities that GCOS criteria is met:

Weighted least square:

0.0 %

Ordinary least square:

3.0 %


Temporal anomaly analyis

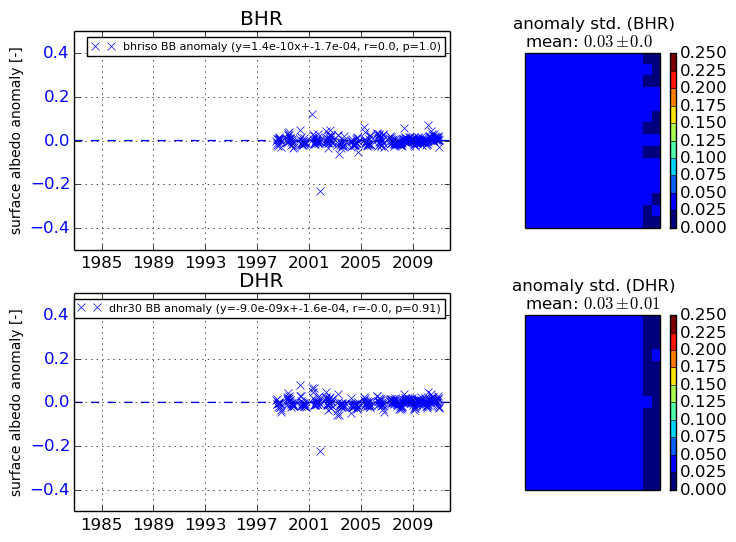
The variance of the temporal anomalies provides an additional measure about the stability of the signal AFTER removal of the mean seasonal cylce.
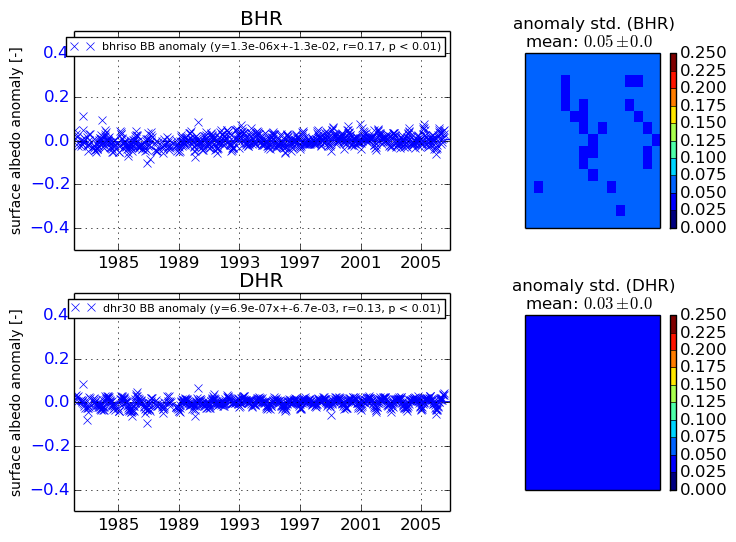
+000 deg


+057/+063 deg