BELMANIP_00239


Location

lon / lat [deg]: 40.4548 / 30.4309

Source network: BELMANIP


Geostationary surface albedo (GSA) data


“+000”


“+057/+063”


Landcover information (based on ESA CCI landcover data)


Landcover fractions @ 2km distance


Landcover fractions @ 20 km distance


Legend


Distance to open water bodies [km]:

none in region

Distance to urban areas [km]:

36.26


Radius: 1 km

Number of landcover classes:

1

Dominant landcover type:

200: bare areas

Fraction of dominant landcover type [%]:

100.0


Radius: 2 km

Number of landcover classes:

1

Dominant landcover type:

200: bare areas

Fraction of dominant landcover type [%]:

100.0


Radius: 5 km

Number of landcover classes:

1

Dominant landcover type:

200: bare areas

Fraction of dominant landcover type [%]:

100.0


Radius: 10 km

Number of landcover classes:

1

Dominant landcover type:

200: bare areas

Fraction of dominant landcover type [%]:

100.0


Radius: 20 km

Number of landcover classes:

1

Dominant landcover type:

200: bare areas

Fraction of dominant landcover type [%]:

100.0


Disturbances


Heterogeneity analysis

The heterogeneity analysis provides information about the spatial and temporal heterogeneity of the site.

Topography


Roman et al. (2009) index


St

2.84191120273

Rcv

0.00861983644228

Rse

0.0

Rst

-0.047335915576

Rsv

-0.999671882343


Height range @ 1km [m]

16

Height range @ 2km [m]

56

Height range @ 5km [m]

56

Height range @ 10km [m]

-999

Height range @ 20km [m]

-999


Variance slope @ 1 km

72

Variance slope @ 2 km

81

Variance slope @ 5 km

88

Variance slope @ 10 km

-999

Variance slope @ 20 km

-999


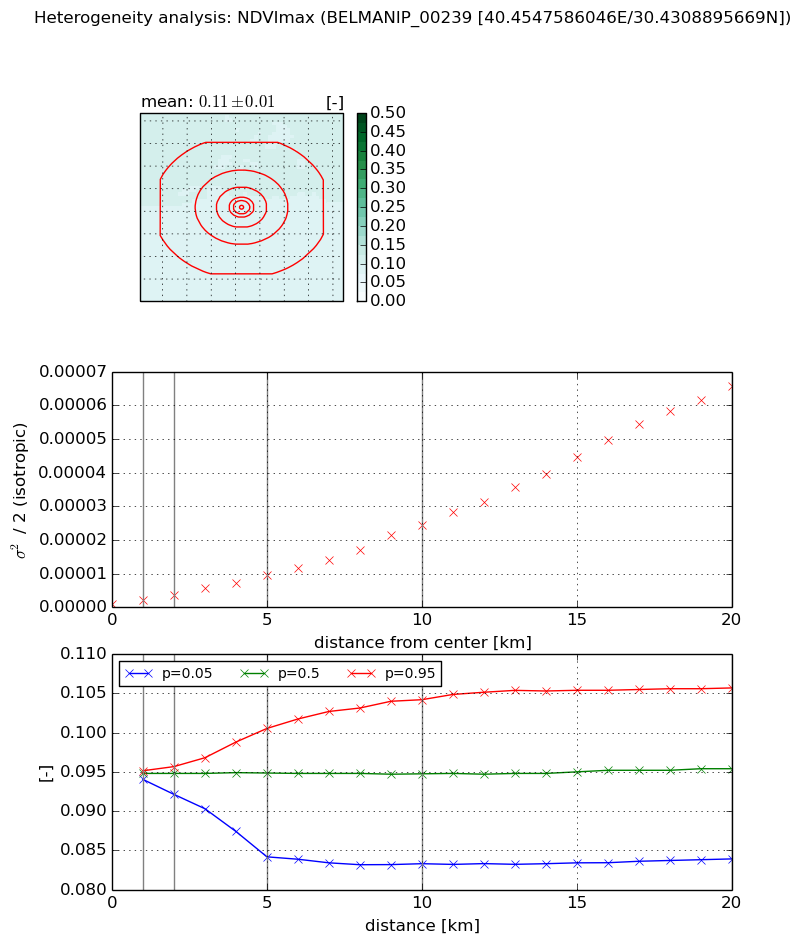
NDVI (max. NDVI composite)


Roman et al. (2009) index


St

8.24791848061e-07

Rcv

1.20476240831

Rse

0.0

Rst

0.214389942267

Rsv

3637279.92287


NDVI range @ 1km [-]

0.0

NDVI range @ 2km [-]

0.0

NDVI range @ 5km [-]

0.02

NDVI range @ 10km [-]

0.02

NDVI range @ 20km [-]

0.02


Variance slope @ 1 km

1.09933052854e-06

Variance slope @ 2 km

1.26151676069e-06

Variance slope @ 5 km

1.70813736458e-06

Variance slope @ 10 km

2.32552629181e-06

Variance slope @ 20 km

3.38690138201e-06


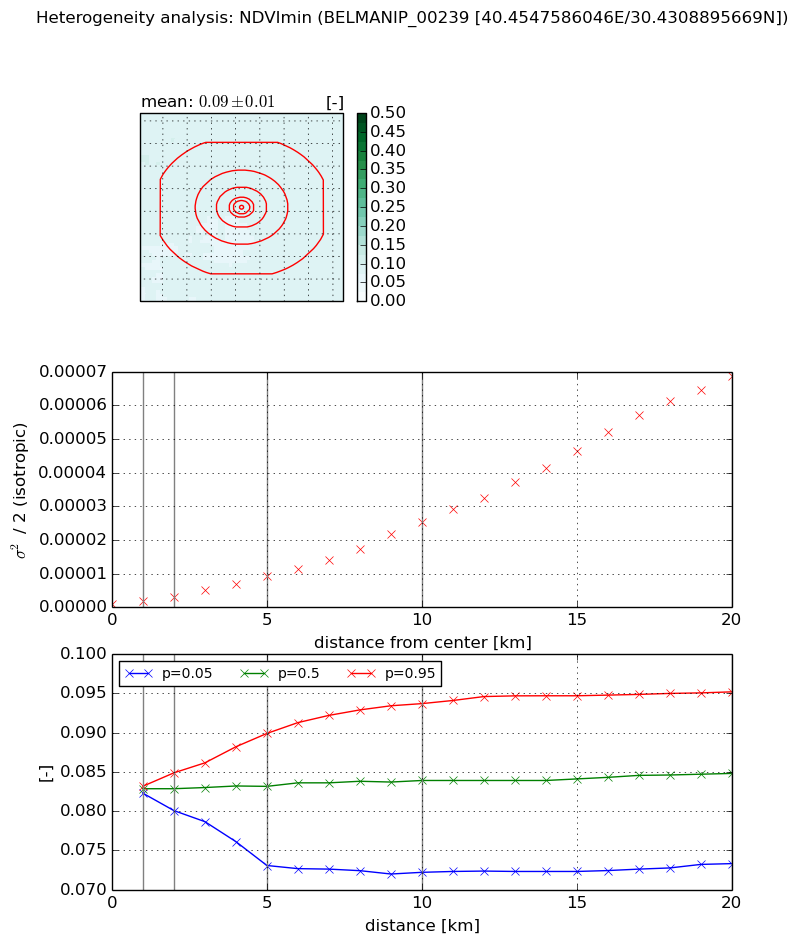
NDVI (min. NDVI composite)I


Roman et al. (2009) index


St

0.622048990143

Rcv

1.07044082225

Rse

0.0

Rst

0.126354012516

Rsv

3.62597643814


NDVI range @ 1km [-]

0.0

NDVI range @ 2km [-]

0.0

NDVI range @ 5km [-]

0.02

NDVI range @ 10km [-]

0.02

NDVI range @ 20km [-]

0.02


NDVI slope @ 1 km

9.78599452675e-07

NDVI slope @ 2 km

1.13562981089e-06

NDVI slope @ 5 km

1.66362181063e-06

NDVI slope @ 10 km

2.42879599853e-06

NDVI slope @ 20 km

3.58345764922e-06


Temporal stability analysis

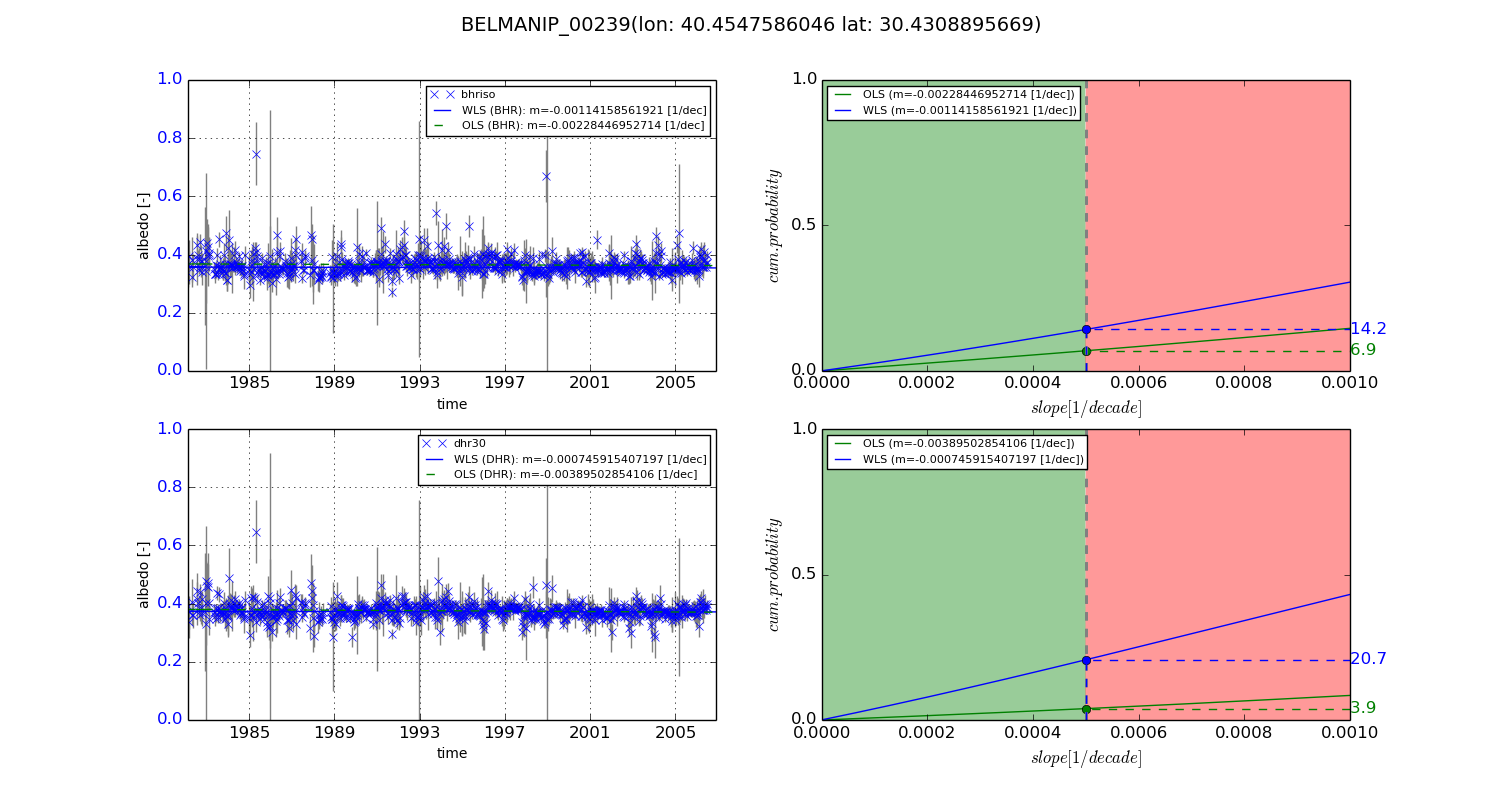
+000 deg (BHR)


BHR statistics

Temporal stability [1/decade]:


abs

rel


Weighted least square:

-0.00114158561921


Ordinary least square:

-0.00228446952714


Probabilities that GCOS criteria is met:

Weighted least square:

14.2 %

Ordinary least square:

6.9 %


DHR statistics

Temporal stability [1/decade]:


abs

rel


Weighted least square:

-0.000745915407197


Ordinary least square:

-0.00389502854106


Probabilities that GCOS criteria is met:

Weighted least square:

20.7 %

Ordinary least square:

3.9 %


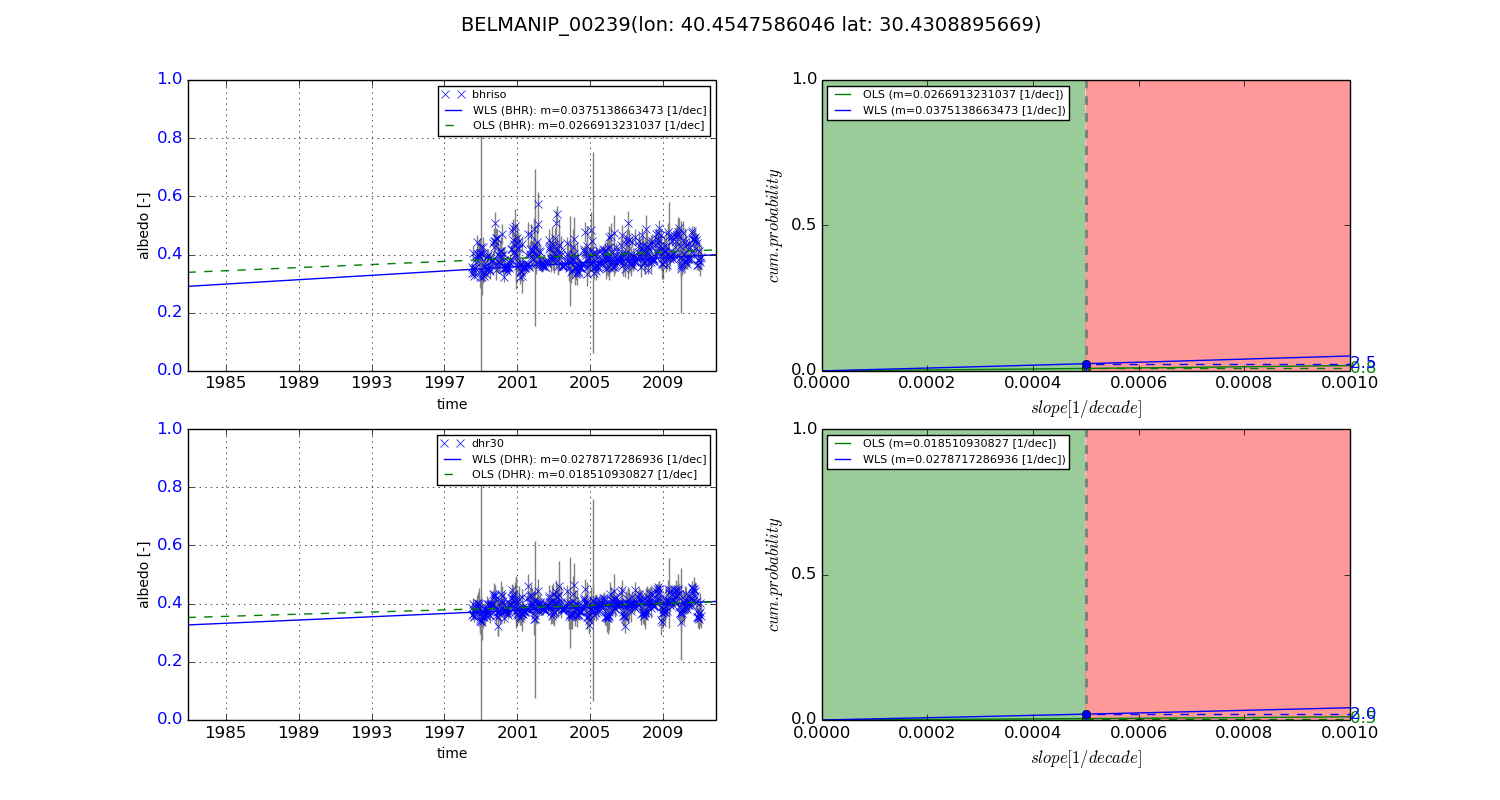
+057/+063 deg (BHR)


BHR statistics

Temporal stability [1/decade]:


abs

rel


Weighted least square:

0.0375138663473


Ordinary least square:

0.0266913231037


Probabilities that GCOS criteria is met:

Weighted least square:

2.5 %

Ordinary least square:

0.8 %


DHR statistics

Temporal stability [1/decade]:


abs

rel


Weighted least square:

0.0278717286936


Ordinary least square:

0.018510930827


Probabilities that GCOS criteria is met:

Weighted least square:

2.0 %

Ordinary least square:

0.5 %


Temporal anomaly analyis

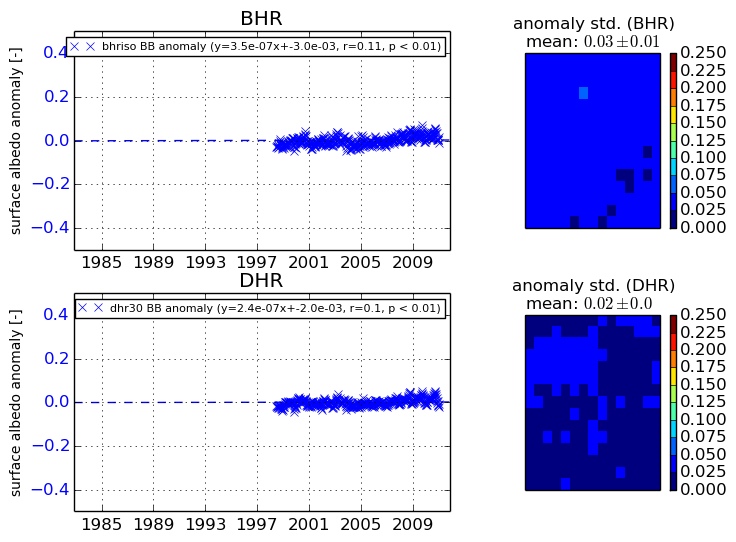
The variance of the temporal anomalies provides an additional measure about the stability of the signal AFTER removal of the mean seasonal cylce.
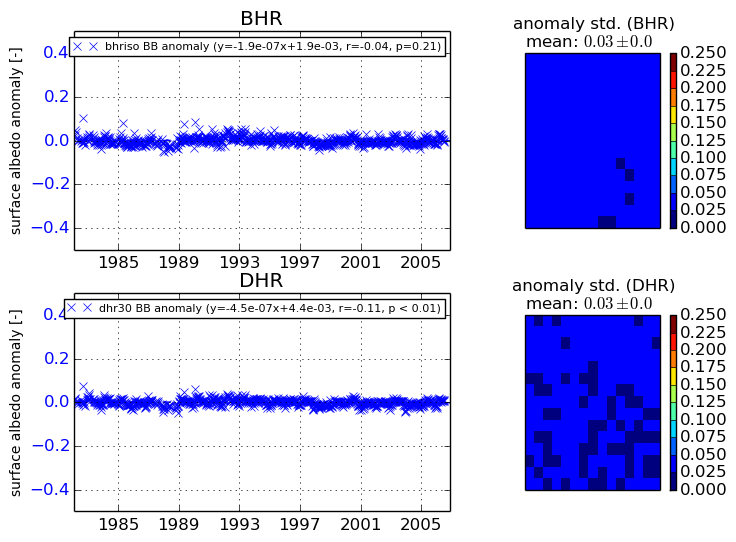
+000 deg


+057/+063 deg