BELMANIP_00245


Location

lon / lat [deg]: 25.695 / 47.1203

Source network: BELMANIP


Geostationary surface albedo (GSA) data


“+000”


“+057/+063”


Landcover information (based on ESA CCI landcover data)


Landcover fractions @ 2km distance


Landcover fractions @ 20 km distance


Legend


Distance to open water bodies [km]:

9.84

Distance to urban areas [km]:

7.1


Radius: 1 km

Number of landcover classes:

1

Dominant landcover type:

70: Tree cover, needleleaved, evergreen, closed to open (>15%)

Fraction of dominant landcover type [%]:

100.0


Radius: 2 km

Number of landcover classes:

4

Dominant landcover type:

70: Tree cover, needleleaved, evergreen, closed to open (>15%)

Fraction of dominant landcover type [%]:

87.0


Radius: 5 km

Number of landcover classes:

4

Dominant landcover type:

70: Tree cover, needleleaved, evergreen, closed to open (>15%)

Fraction of dominant landcover type [%]:

84.0


Radius: 10 km

Number of landcover classes:

5

Dominant landcover type:

70: Tree cover, needleleaved, evergreen, closed to open (>15%)

Fraction of dominant landcover type [%]:

65.0


Radius: 20 km

Number of landcover classes:

7

Dominant landcover type:

70: Tree cover, needleleaved, evergreen, closed to open (>15%)

Fraction of dominant landcover type [%]:

53.0


Disturbances


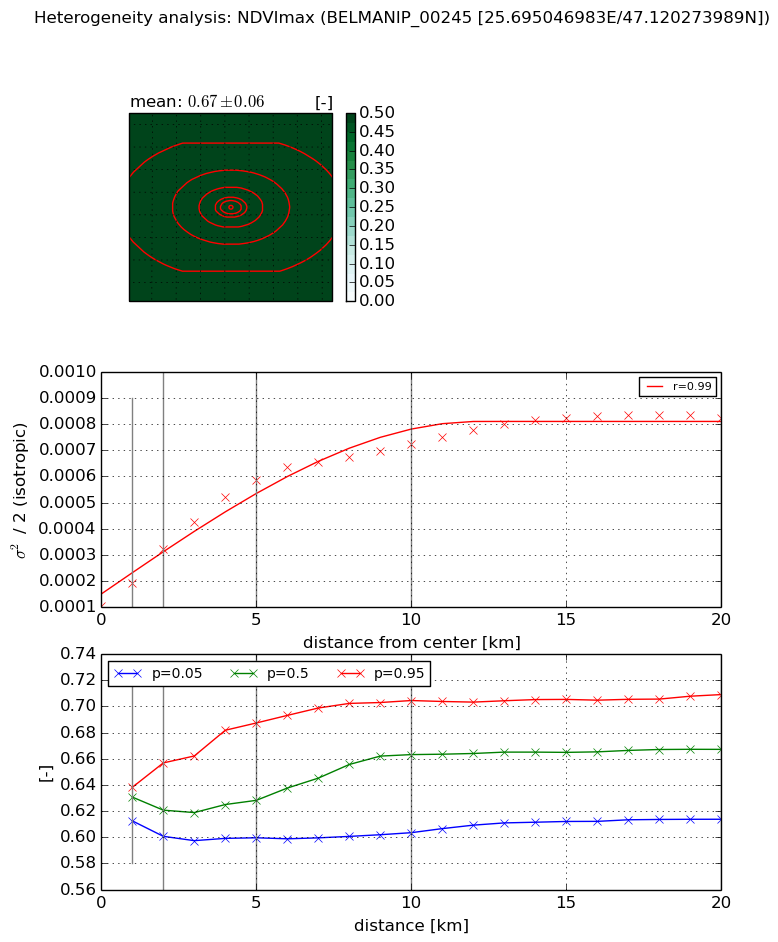
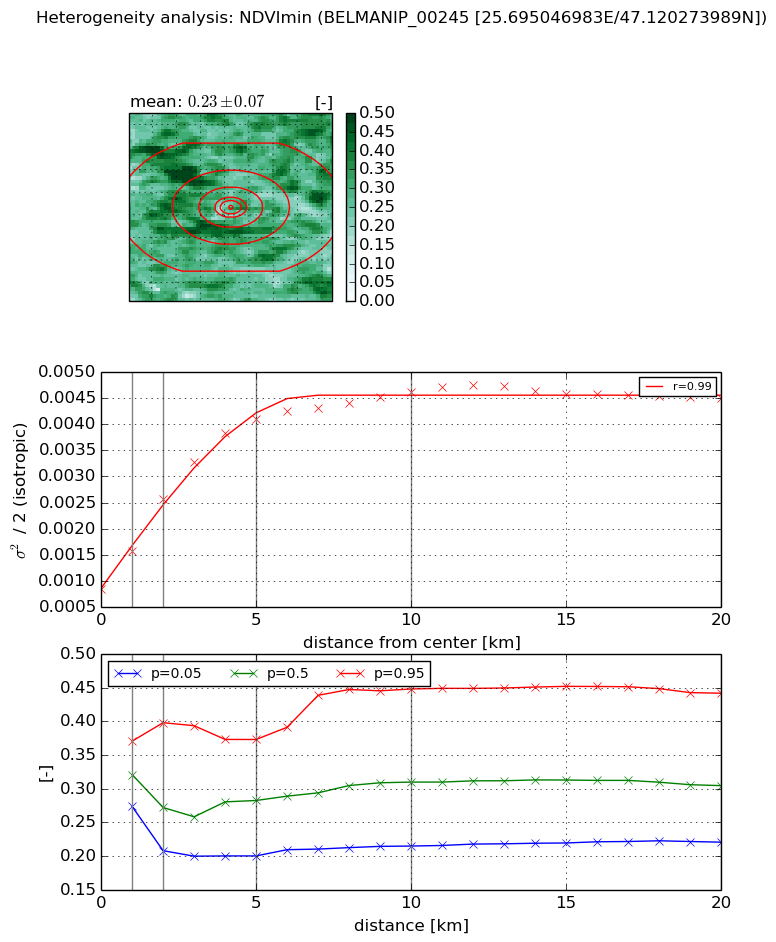
Heterogeneity analysis

The heterogeneity analysis provides information about the spatial and temporal heterogeneity of the site.

Topography


Roman et al. (2009) index


St

7.25480037103

Rcv

0.172826365452

Rse

0.0

Rst

-0.0533799516954

Rsv

0.18731298684


Height range @ 1km [m]

452

Height range @ 2km [m]

641

Height range @ 5km [m]

741

Height range @ 10km [m]

-999

Height range @ 20km [m]

-999


Variance slope @ 1 km

18929

Variance slope @ 2 km

18698

Variance slope @ 5 km

13126

Variance slope @ 10 km

-999

Variance slope @ 20 km

-999


NDVI (max. NDVI composite)


Roman et al. (2009) index


St

1.07399642903e-06

Rcv

0.179006190635

Rse

0.0

Rst

0.00318378409455

Rsv

2793305.19472


NDVI range @ 1km [-]

0.03

NDVI range @ 2km [-]

0.06

NDVI range @ 5km [-]

0.09

NDVI range @ 10km [-]

0.1

NDVI range @ 20km [-]

0.1


Variance slope @ 1 km

8.65209691837e-05

Variance slope @ 2 km

0.00010873899891

Variance slope @ 5 km

9.96671025463e-05

Variance slope @ 10 km

6.14061217287e-05

Variance slope @ 20 km

3.17041630445e-05


NDVI (min. NDVI composite)I


Roman et al. (2009) index


St

nan

Rcv

nan

Rse

nan

Rst

nan

Rsv

nan


NDVI range @ 1km [-]

0.1

NDVI range @ 2km [-]

0.19

NDVI range @ 5km [-]

0.17

NDVI range @ 10km [-]

0.23

NDVI range @ 20km [-]

0.22


NDVI slope @ 1 km

0.000730027003165

NDVI slope @ 2 km

0.00086086418275

NDVI slope @ 5 km

0.000680235555492

NDVI slope @ 10 km

0.000351579858824

NDVI slope @ 20 km

0.00012780997417


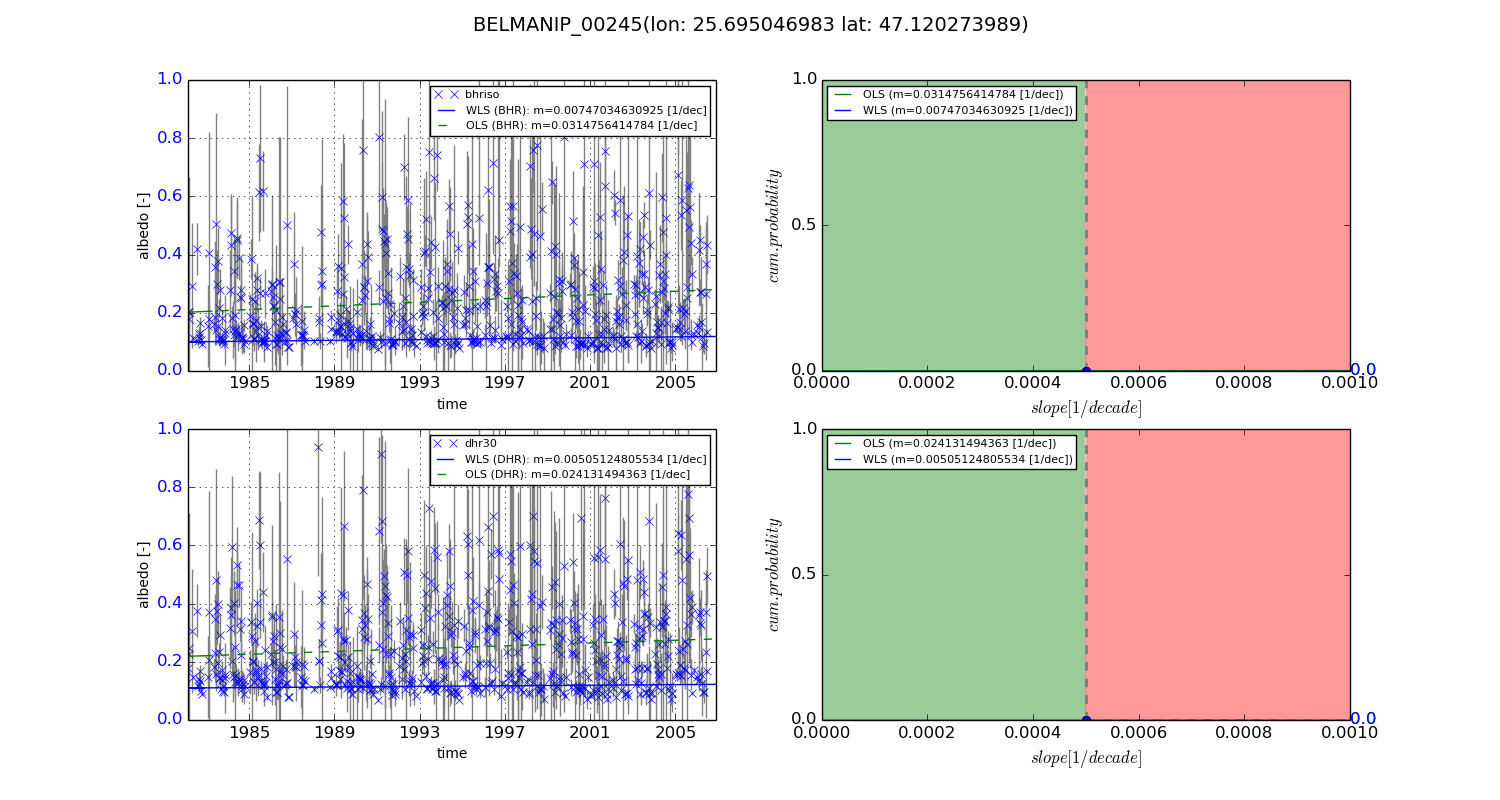
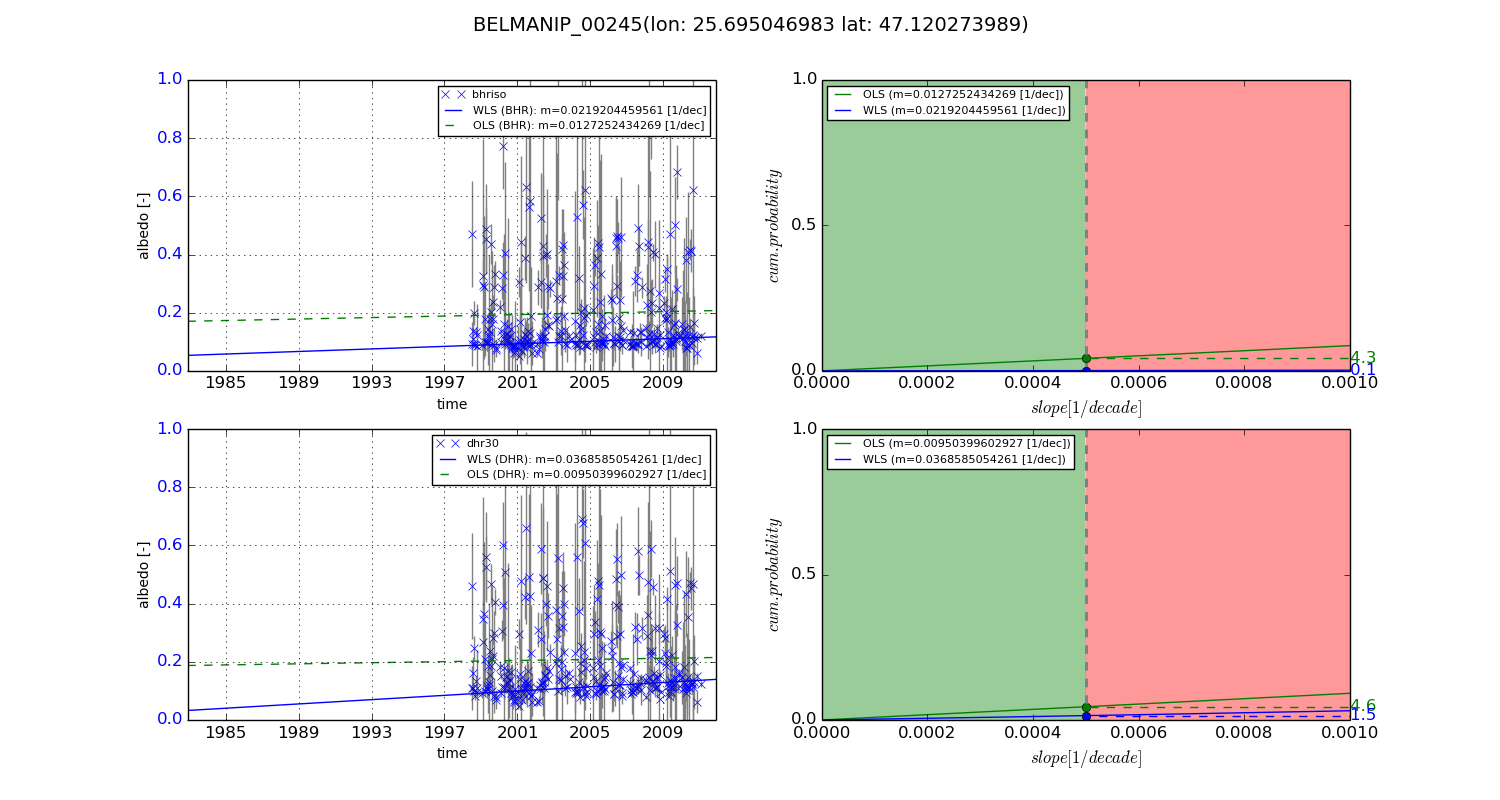
Temporal stability analysis

+000 deg (BHR)


BHR statistics

Temporal stability [1/decade]:


abs

rel


Weighted least square:

0.00747034630925


Ordinary least square:

0.0314756414784


Probabilities that GCOS criteria is met:

Weighted least square:

0.0 %

Ordinary least square:

0.0 %


DHR statistics

Temporal stability [1/decade]:


abs

rel


Weighted least square:

0.00505124805534


Ordinary least square:

0.024131494363


Probabilities that GCOS criteria is met:

Weighted least square:

0.0 %

Ordinary least square:

0.0 %


+057/+063 deg (BHR)


BHR statistics

Temporal stability [1/decade]:


abs

rel


Weighted least square:

0.0219204459561


Ordinary least square:

0.0127252434269


Probabilities that GCOS criteria is met:

Weighted least square:

0.1 %

Ordinary least square:

4.3 %


DHR statistics

Temporal stability [1/decade]:


abs

rel


Weighted least square:

0.0368585054261


Ordinary least square:

0.00950399602927


Probabilities that GCOS criteria is met:

Weighted least square:

1.5 %

Ordinary least square:

4.6 %


Temporal anomaly analyis

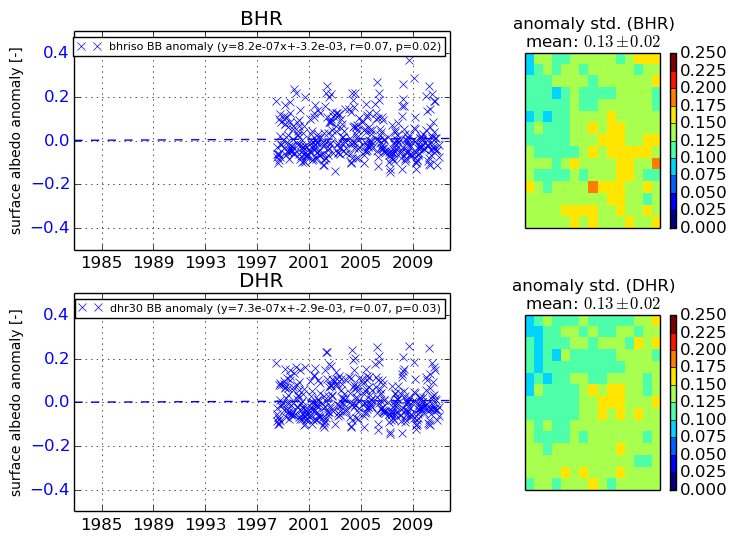
The variance of the temporal anomalies provides an additional measure about the stability of the signal AFTER removal of the mean seasonal cylce.
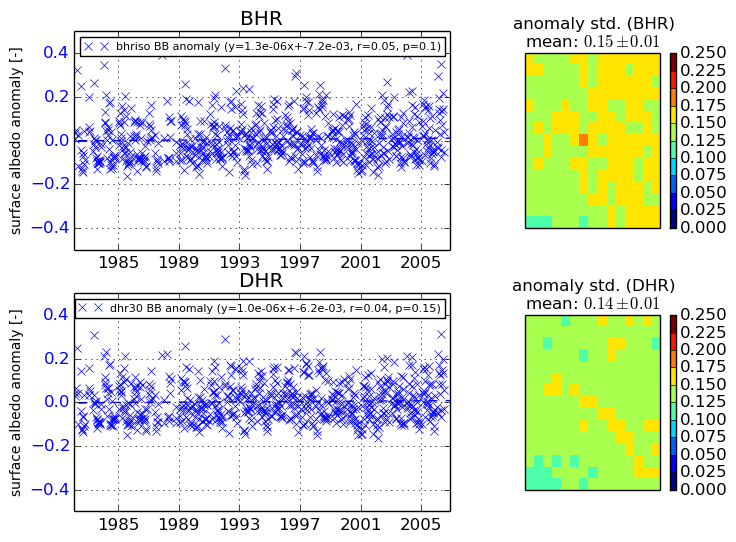
+000 deg


+057/+063 deg