BELMANIP_00248


Location

lon / lat [deg]: -5.1148 / 42.1242

Source network: BELMANIP


Geostationary surface albedo (GSA) data


“+000”


“+057/+063”


Landcover information (based on ESA CCI landcover data)


Landcover fractions @ 2km distance


Landcover fractions @ 20 km distance


Legend


Distance to open water bodies [km]:

25.68

Distance to urban areas [km]:

6.8


Radius: 1 km

Number of landcover classes:

2

Dominant landcover type:

10: cropland, rainfed

Fraction of dominant landcover type [%]:

98.0


Radius: 2 km

Number of landcover classes:

2

Dominant landcover type:

10: cropland, rainfed

Fraction of dominant landcover type [%]:

91.0


Radius: 5 km

Number of landcover classes:

2

Dominant landcover type:

10: cropland, rainfed

Fraction of dominant landcover type [%]:

97.0


Radius: 10 km

Number of landcover classes:

2

Dominant landcover type:

10: cropland, rainfed

Fraction of dominant landcover type [%]:

94.0


Radius: 20 km

Number of landcover classes:

2

Dominant landcover type:

10: cropland, rainfed

Fraction of dominant landcover type [%]:

91.0


Disturbances


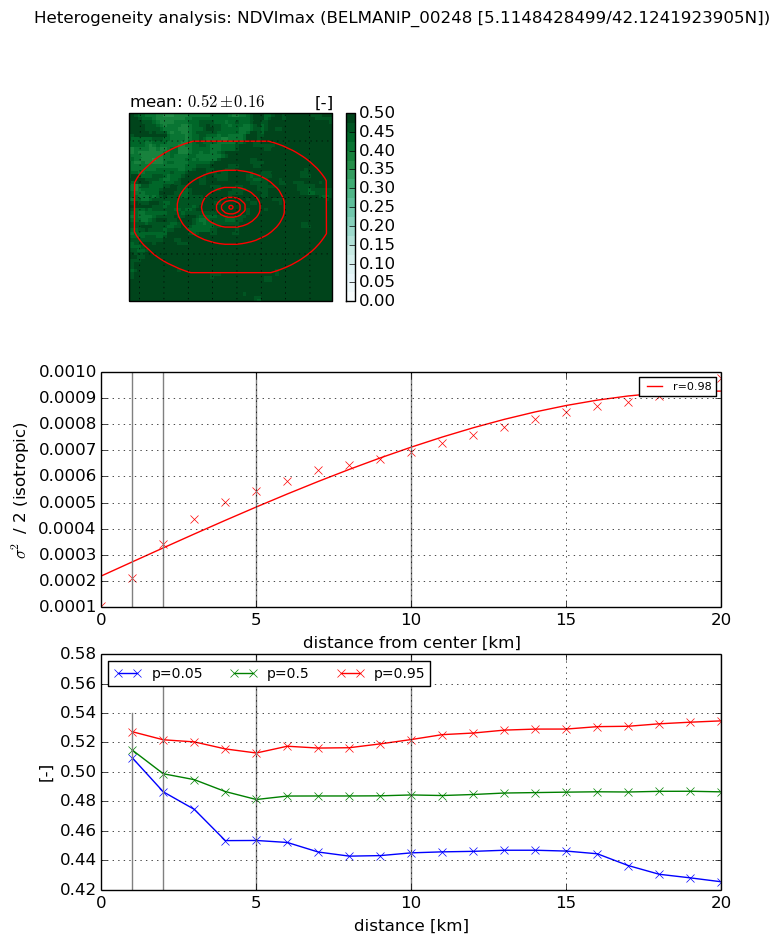
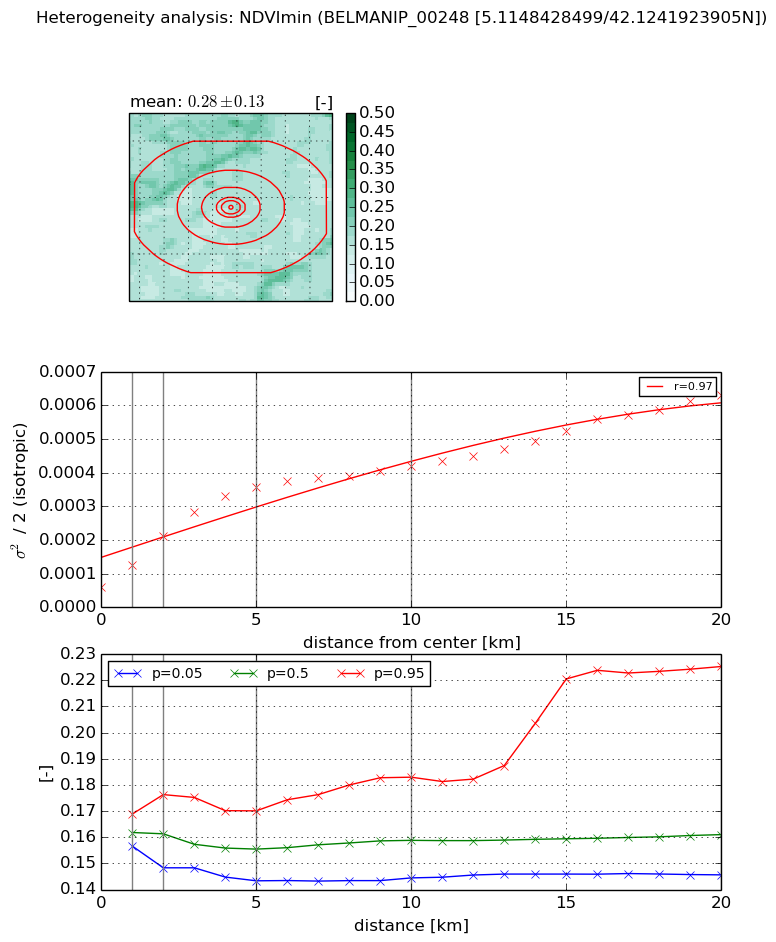
Heterogeneity analysis

The heterogeneity analysis provides information about the spatial and temporal heterogeneity of the site.

Topography


Roman et al. (2009) index


St

2.39502700091

Rcv

0.54744833596

Rse

0.0

Rst

-1.1544076105e-05

Rsv

-0.705135601711


Height range @ 1km [m]

23

Height range @ 2km [m]

35

Height range @ 5km [m]

78

Height range @ 10km [m]

-999

Height range @ 20km [m]

-999


Variance slope @ 1 km

65

Variance slope @ 2 km

81

Variance slope @ 5 km

118

Variance slope @ 10 km

-999

Variance slope @ 20 km

-999


NDVI (max. NDVI composite)


Roman et al. (2009) index


St

2.72478304008

Rcv

0.275625898226

Rse

0.0

Rst

-0.16453690517

Rsv

0.660842287971


NDVI range @ 1km [-]

0.02

NDVI range @ 2km [-]

0.04

NDVI range @ 5km [-]

0.06

NDVI range @ 10km [-]

0.08

NDVI range @ 20km [-]

0.11


Variance slope @ 1 km

0.000105903346864

Variance slope @ 2 km

0.000117824930679

Variance slope @ 5 km

8.99920235392e-05

Variance slope @ 10 km

5.55659649821e-05

Variance slope @ 20 km

3.69571579925e-05


NDVI (min. NDVI composite)I


Roman et al. (2009) index


St

4.64201070377

Rcv

0.00955330570423

Rse

0.0

Rst

-0.152861579068

Rsv

0.483856783142


NDVI range @ 1km [-]

0.01

NDVI range @ 2km [-]

0.03

NDVI range @ 5km [-]

0.03

NDVI range @ 10km [-]

0.04

NDVI range @ 20km [-]

0.08


NDVI slope @ 1 km

6.58611841691e-05

NDVI slope @ 2 km

7.62902920208e-05

NDVI slope @ 5 km

6.23305662493e-05

NDVI slope @ 10 km

3.35652226672e-05

NDVI slope @ 20 km

2.36250313684e-05


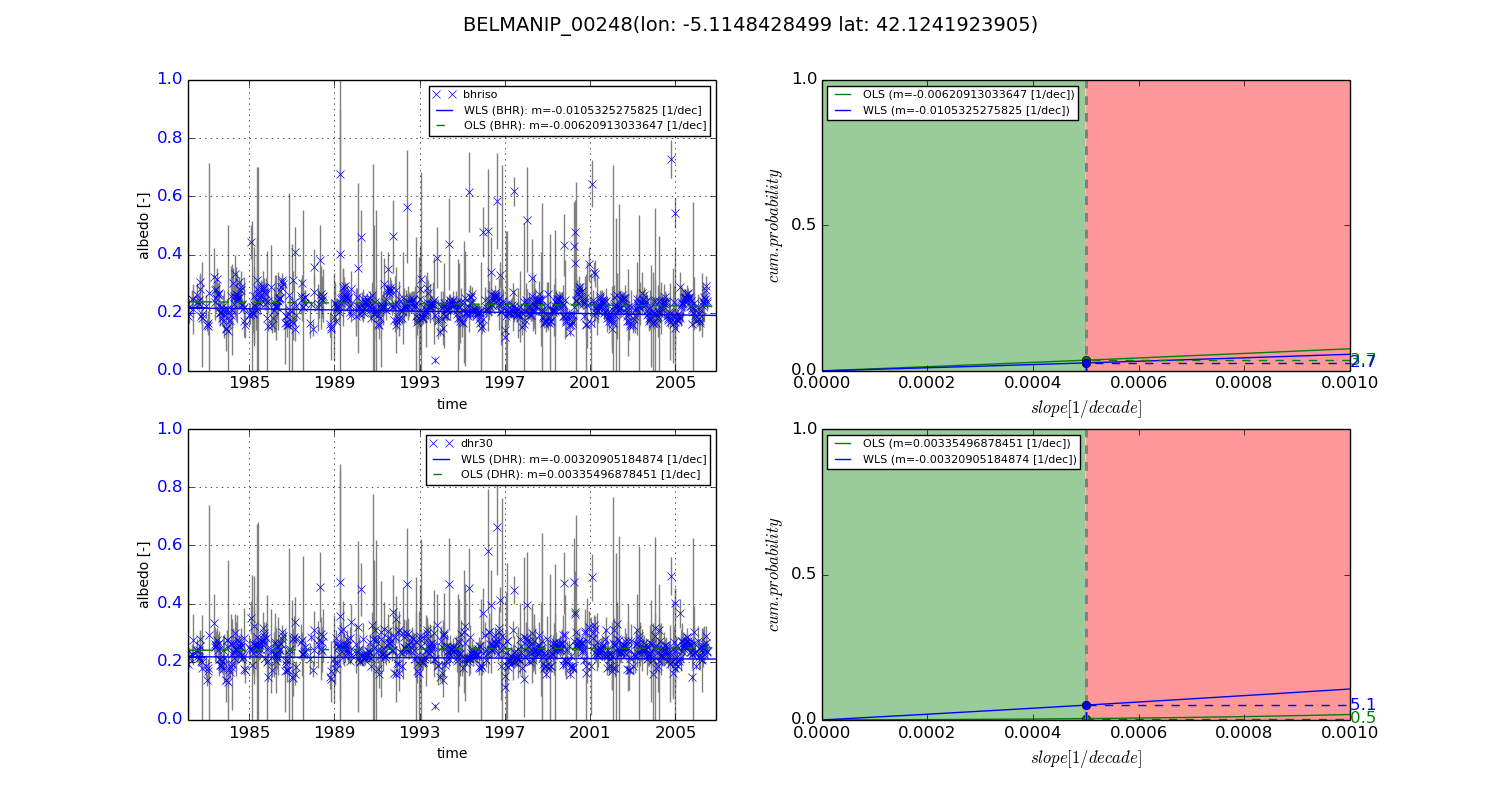
Temporal stability analysis

+000 deg (BHR)


BHR statistics

Temporal stability [1/decade]:


abs

rel


Weighted least square:

-0.0105325275825


Ordinary least square:

-0.00620913033647


Probabilities that GCOS criteria is met:

Weighted least square:

2.7 %

Ordinary least square:

3.7 %


DHR statistics

Temporal stability [1/decade]:


abs

rel


Weighted least square:

-0.00320905184874


Ordinary least square:

0.00335496878451


Probabilities that GCOS criteria is met:

Weighted least square:

5.1 %

Ordinary least square:

0.5 %


+057/+063 deg (BHR)


BHR statistics

Temporal stability [1/decade]:


abs

rel


Weighted least square:

-99999.0


Ordinary least square:

-99999.0


Probabilities that GCOS criteria is met:

Weighted least square:

-99999.0 %

Ordinary least square:

-99999.0 %


DHR statistics

Temporal stability [1/decade]:


abs

rel


Weighted least square:

-99999.0


Ordinary least square:

-99999.0


Probabilities that GCOS criteria is met:

Weighted least square:

-99999.0 %

Ordinary least square:

-99999.0 %


Temporal anomaly analyis

The variance of the temporal anomalies provides an additional measure about the stability of the signal AFTER removal of the mean seasonal cylce.
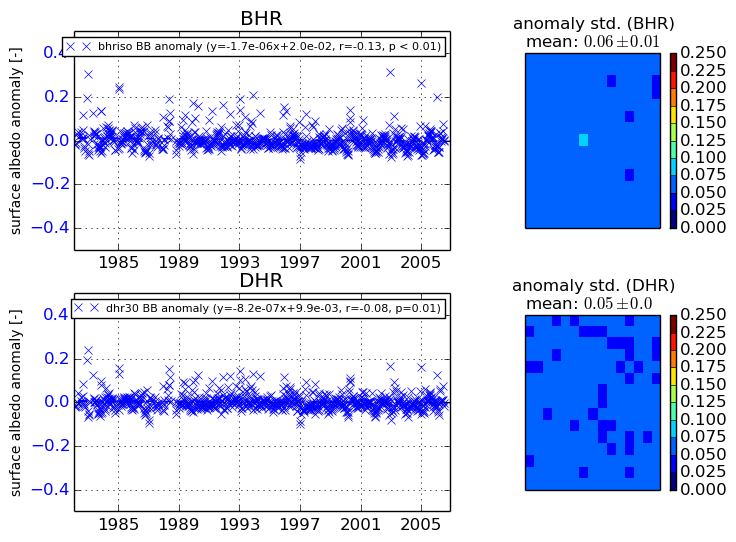
+000 deg


+057/+063 deg