BELMANIP_00250


Location

lon / lat [deg]: 11.9698 / 44.8702

Source network: BELMANIP


Geostationary surface albedo (GSA) data


“+000”


“+057/+063”


Landcover information (based on ESA CCI landcover data)


Landcover fractions @ 2km distance


Landcover fractions @ 20 km distance


Legend


Distance to open water bodies [km]:

8.33

Distance to urban areas [km]:

1.24


Radius: 1 km

Number of landcover classes:

2

Dominant landcover type:

20: cropland, irrigated or post-flooded

Fraction of dominant landcover type [%]:

59.0


Radius: 2 km

Number of landcover classes:

3

Dominant landcover type:

10: cropland, rainfed

Fraction of dominant landcover type [%]:

59.0


Radius: 5 km

Number of landcover classes:

3

Dominant landcover type:

10: cropland, rainfed

Fraction of dominant landcover type [%]:

72.0


Radius: 10 km

Number of landcover classes:

4

Dominant landcover type:

10: cropland, rainfed

Fraction of dominant landcover type [%]:

75.0


Radius: 20 km

Number of landcover classes:

4

Dominant landcover type:

10: cropland, rainfed

Fraction of dominant landcover type [%]:

82.0


Disturbances


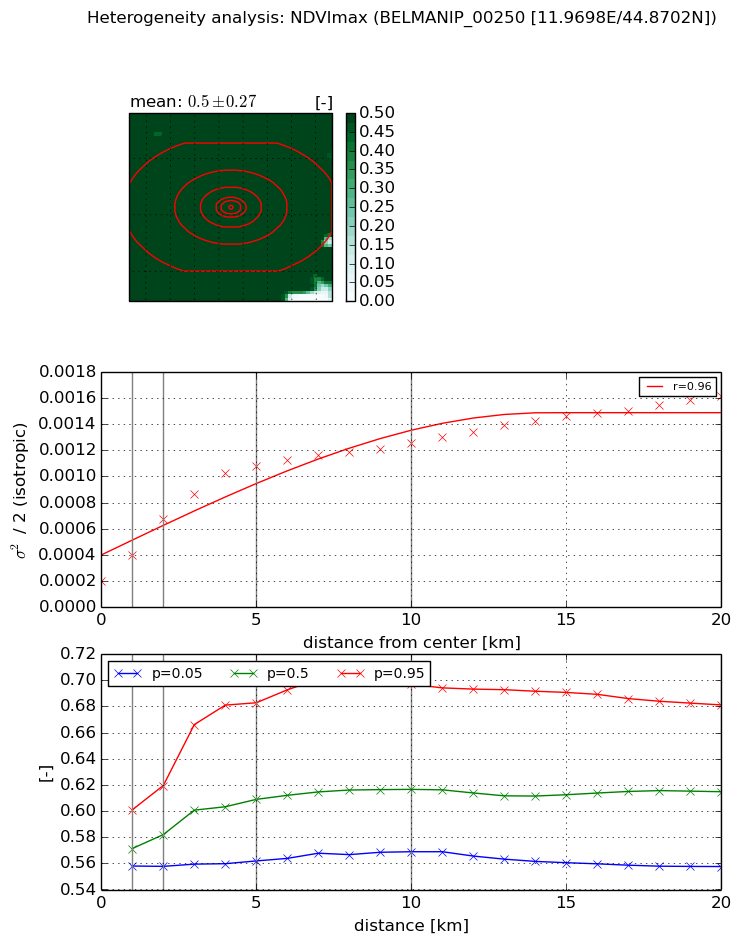
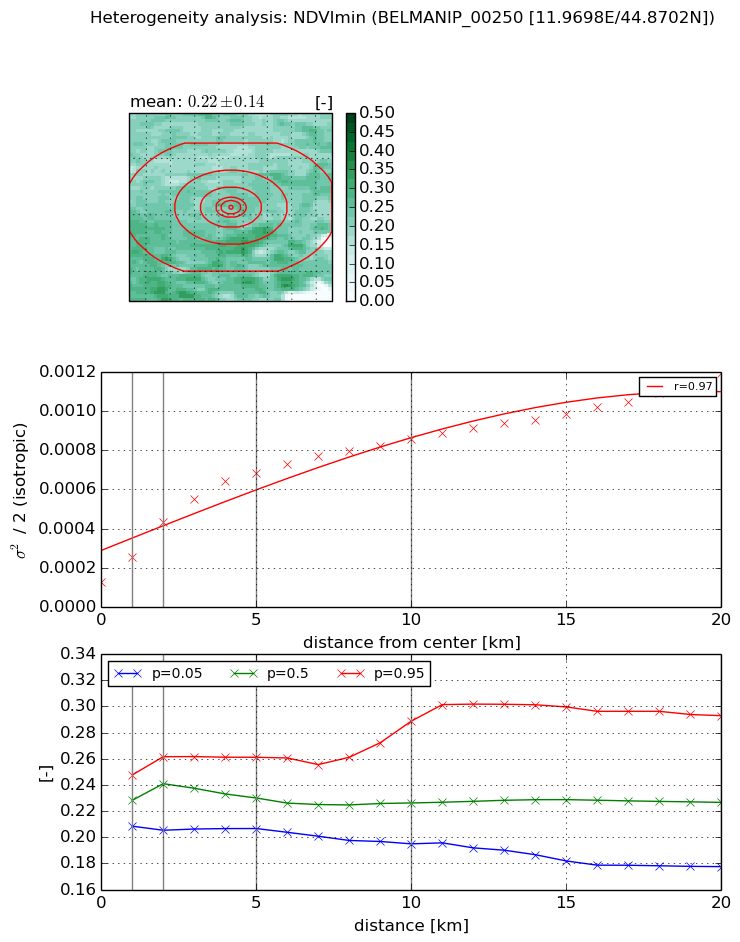
Heterogeneity analysis

The heterogeneity analysis provides information about the spatial and temporal heterogeneity of the site.

Topography


Roman et al. (2009) index


St

nan

Rcv

-0.0178502047563

Rse

nan

Rst

nan

Rsv

-0.367275754544


Height range @ 1km [m]

-99999

Height range @ 2km [m]

-99999

Height range @ 5km [m]

-99999

Height range @ 10km [m]

-99999

Height range @ 20km [m]

-99999


Variance slope @ 1 km

0

Variance slope @ 2 km

0

Variance slope @ 5 km

0

Variance slope @ 10 km

-999

Variance slope @ 20 km

-999


NDVI (max. NDVI composite)


Roman et al. (2009) index


St

2.57966068715e-07

Rcv

0.217533760999

Rse

0.0

Rst

0.0535158046831

Rsv

11629436.1697


NDVI range @ 1km [-]

0.04

NDVI range @ 2km [-]

0.06

NDVI range @ 5km [-]

0.12

NDVI range @ 10km [-]

0.13

NDVI range @ 20km [-]

0.12


Variance slope @ 1 km

0.000200127816484

Variance slope @ 2 km

0.000238311843438

Variance slope @ 5 km

0.000185975929393

Variance slope @ 10 km

9.7640160633e-05

Variance slope @ 20 km

5.60524788005e-05


NDVI (min. NDVI composite)I


Roman et al. (2009) index


St

5.1544239583

Rcv

-0.143961586099

Rse

0.0

Rst

0.194604220948

Rsv

-0.243458493684


NDVI range @ 1km [-]

0.04

NDVI range @ 2km [-]

0.06

NDVI range @ 5km [-]

0.05

NDVI range @ 10km [-]

0.09

NDVI range @ 20km [-]

0.12


NDVI slope @ 1 km

0.000127377266644

NDVI slope @ 2 km

0.000150828116888

NDVI slope @ 5 km

0.000115832197331

NDVI slope @ 10 km

6.82488409384e-05

NDVI slope @ 20 km

4.24532436072e-05


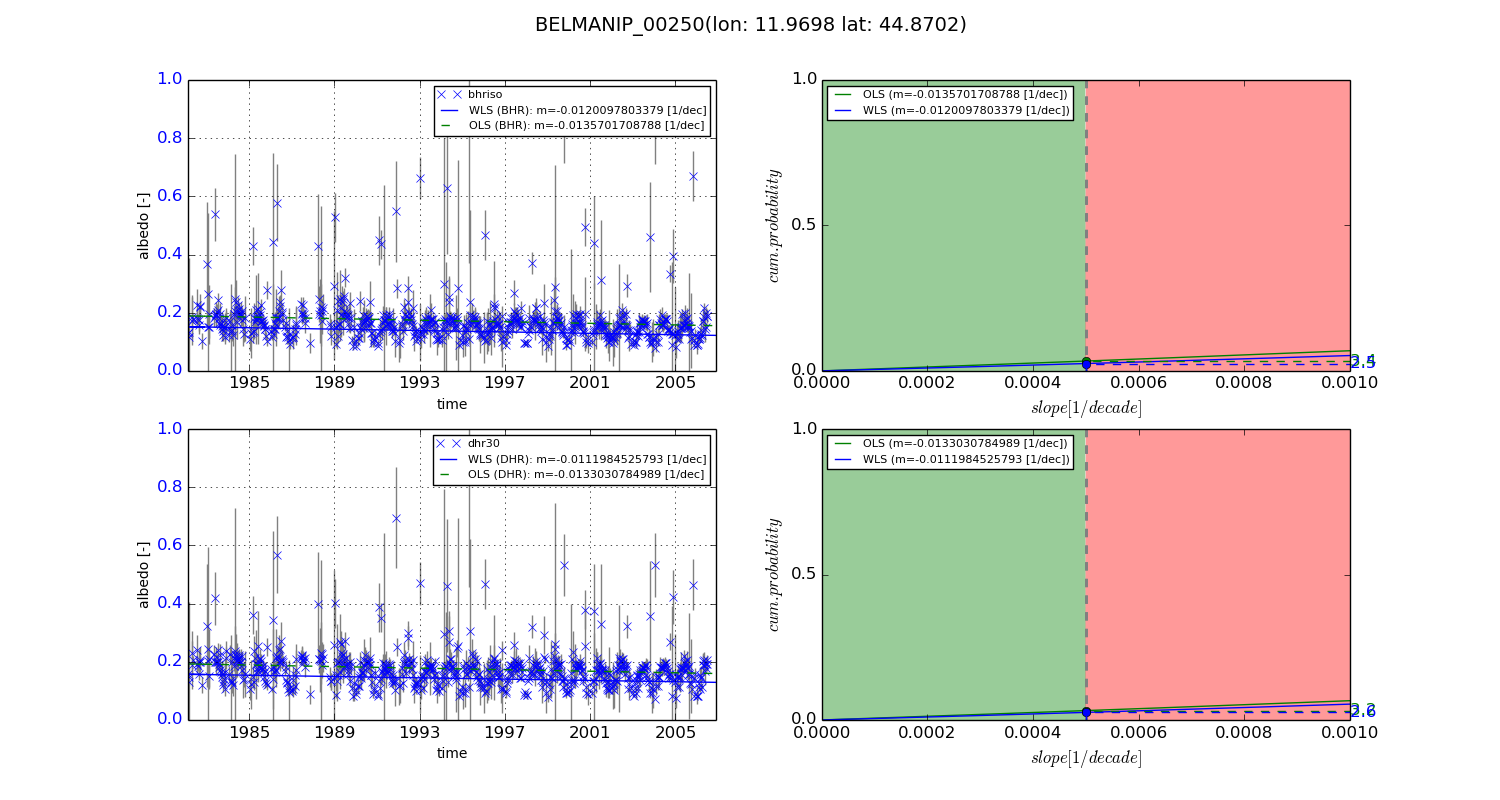
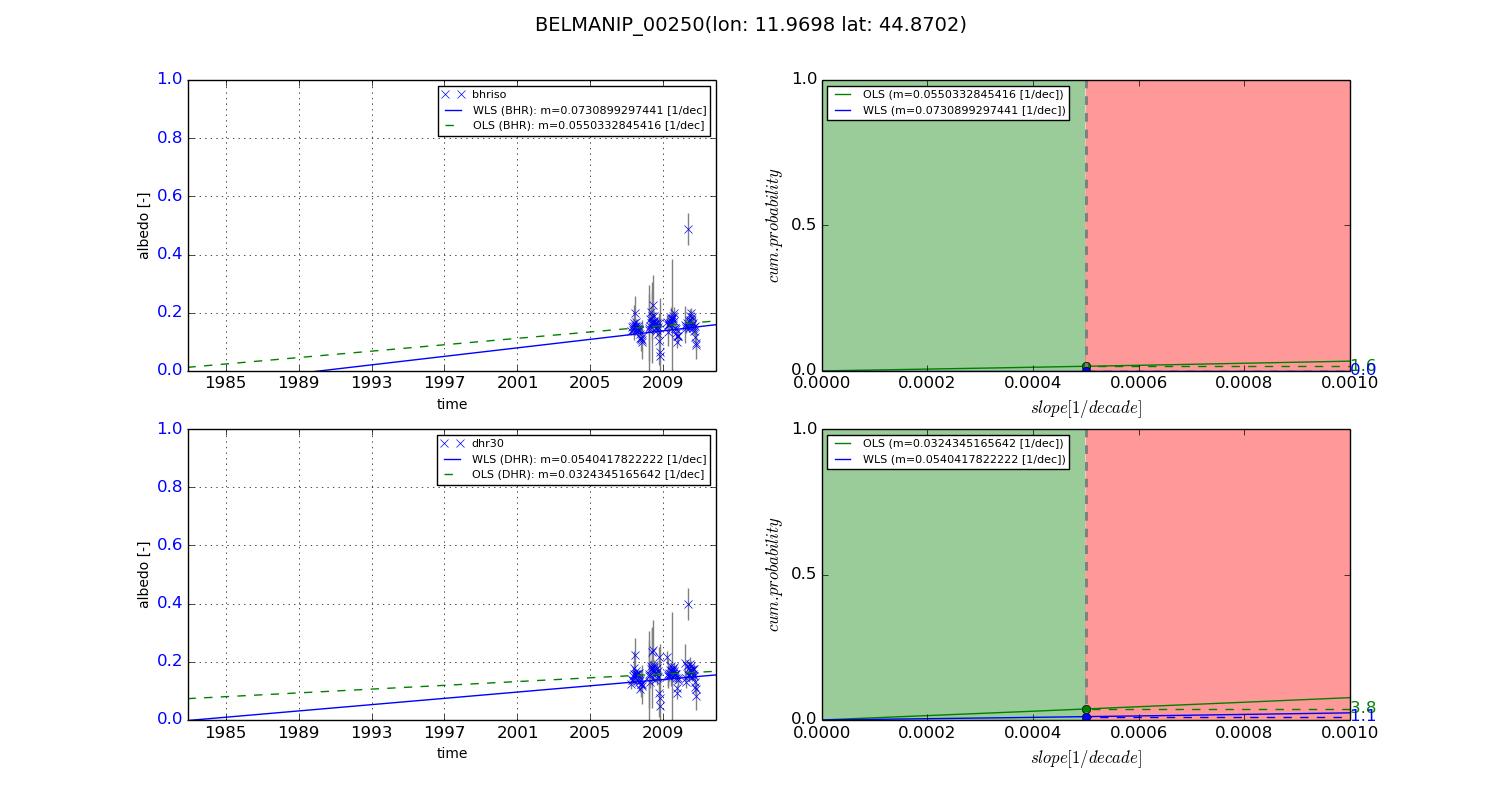
Temporal stability analysis

+000 deg (BHR)


BHR statistics

Temporal stability [1/decade]:


abs

rel


Weighted least square:

-0.0120097803379


Ordinary least square:

-0.0135701708788


Probabilities that GCOS criteria is met:

Weighted least square:

2.5 %

Ordinary least square:

3.4 %


DHR statistics

Temporal stability [1/decade]:


abs

rel


Weighted least square:

-0.0111984525793


Ordinary least square:

-0.0133030784989


Probabilities that GCOS criteria is met:

Weighted least square:

2.6 %

Ordinary least square:

3.2 %


+057/+063 deg (BHR)


BHR statistics

Temporal stability [1/decade]:


abs

rel


Weighted least square:

0.0730899297441


Ordinary least square:

0.0550332845416


Probabilities that GCOS criteria is met:

Weighted least square:

0.0 %

Ordinary least square:

1.6 %


DHR statistics

Temporal stability [1/decade]:


abs

rel


Weighted least square:

0.0540417822222


Ordinary least square:

0.0324345165642


Probabilities that GCOS criteria is met:

Weighted least square:

1.1 %

Ordinary least square:

3.8 %


Temporal anomaly analyis

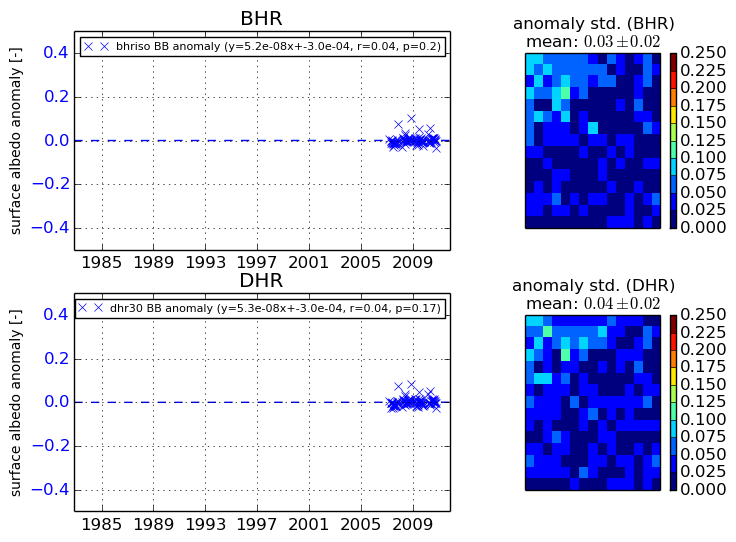
The variance of the temporal anomalies provides an additional measure about the stability of the signal AFTER removal of the mean seasonal cylce.
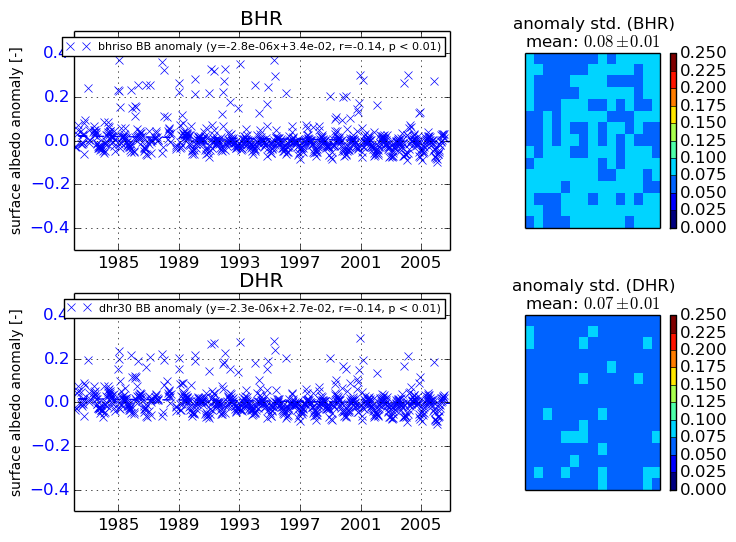
+000 deg


+057/+063 deg