BELMANIP_00251


Location

lon / lat [deg]: 19.9447 / 46.1107

Source network: BELMANIP


Geostationary surface albedo (GSA) data


“+000”


“+057/+063”


Landcover information (based on ESA CCI landcover data)


Landcover fractions @ 2km distance


Landcover fractions @ 20 km distance


Legend


Distance to open water bodies [km]:

5.5

Distance to urban areas [km]:

3.65


Radius: 1 km

Number of landcover classes:

1

Dominant landcover type:

10: cropland, rainfed

Fraction of dominant landcover type [%]:

100.0


Radius: 2 km

Number of landcover classes:

1

Dominant landcover type:

10: cropland, rainfed

Fraction of dominant landcover type [%]:

99.0


Radius: 5 km

Number of landcover classes:

4

Dominant landcover type:

10: cropland, rainfed

Fraction of dominant landcover type [%]:

89.0


Radius: 10 km

Number of landcover classes:

5

Dominant landcover type:

10: cropland, rainfed

Fraction of dominant landcover type [%]:

83.0


Radius: 20 km

Number of landcover classes:

6

Dominant landcover type:

10: cropland, rainfed

Fraction of dominant landcover type [%]:

82.0


Disturbances


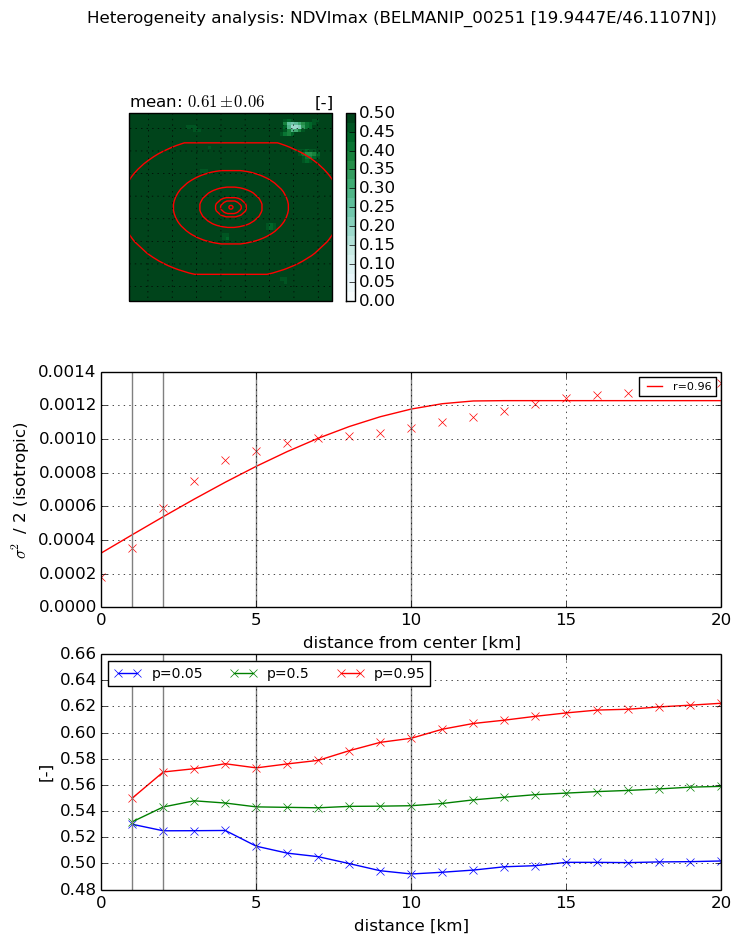
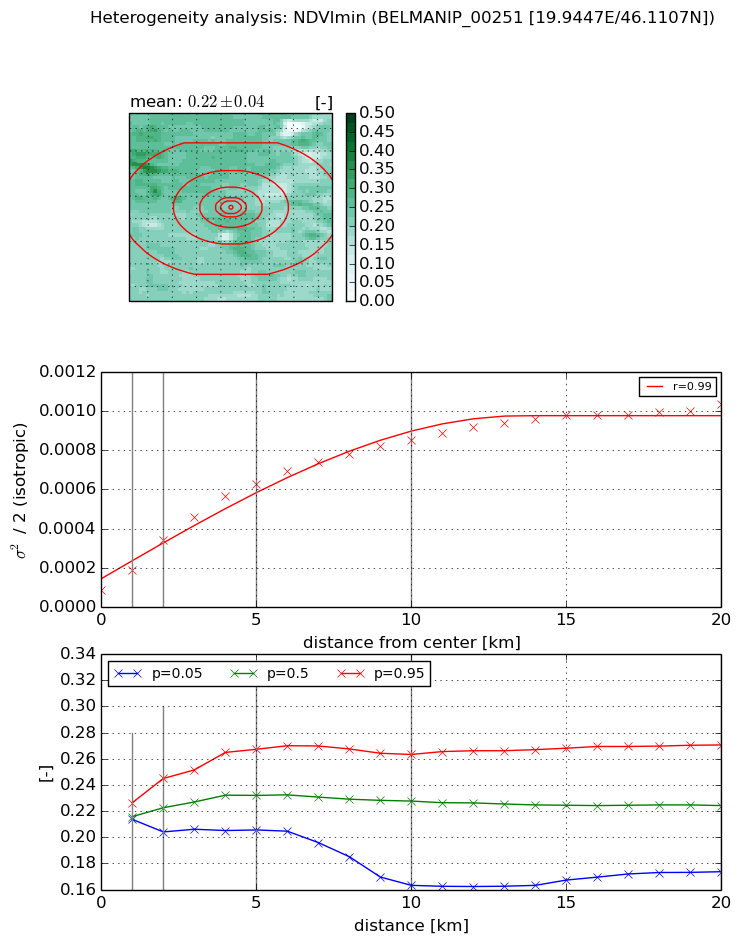
Heterogeneity analysis

The heterogeneity analysis provides information about the spatial and temporal heterogeneity of the site.

Topography


Roman et al. (2009) index


St

4.75372075624

Rcv

0.56577187152

Rse

0.0

Rst

-4.98315387626e-10

Rsv

0.0653127359827


Height range @ 1km [m]

3

Height range @ 2km [m]

5

Height range @ 5km [m]

11

Height range @ 10km [m]

-999

Height range @ 20km [m]

-999


Variance slope @ 1 km

3

Variance slope @ 2 km

2

Variance slope @ 5 km

2

Variance slope @ 10 km

-999

Variance slope @ 20 km

-999


NDVI (max. NDVI composite)


Roman et al. (2009) index


St

7.52715783146

Rcv

0.0720553439652

Rse

0.0

Rst

0.112026813355

Rsv

-0.214474650863


NDVI range @ 1km [-]

0.02

NDVI range @ 2km [-]

0.05

NDVI range @ 5km [-]

0.06

NDVI range @ 10km [-]

0.1

NDVI range @ 20km [-]

0.12


Variance slope @ 1 km

0.000173490336107

Variance slope @ 2 km

0.000204422728802

Variance slope @ 5 km

0.00015632050746

Variance slope @ 10 km

8.23029655756e-05

Variance slope @ 20 km

4.53101537375e-05


NDVI (min. NDVI composite)I


Roman et al. (2009) index


St

3.24852315642

Rcv

0.236137342243

Rse

0.0

Rst

-0.10087919276

Rsv

0.586480037301


NDVI range @ 1km [-]

0.01

NDVI range @ 2km [-]

0.04

NDVI range @ 5km [-]

0.06

NDVI range @ 10km [-]

0.1

NDVI range @ 20km [-]

0.1


NDVI slope @ 1 km

0.000100024787959

NDVI slope @ 2 km

0.000126128386447

NDVI slope @ 5 km

0.000112401029294

NDVI slope @ 10 km

7.60683644335e-05

NDVI slope @ 20 km

4.14831621197e-05


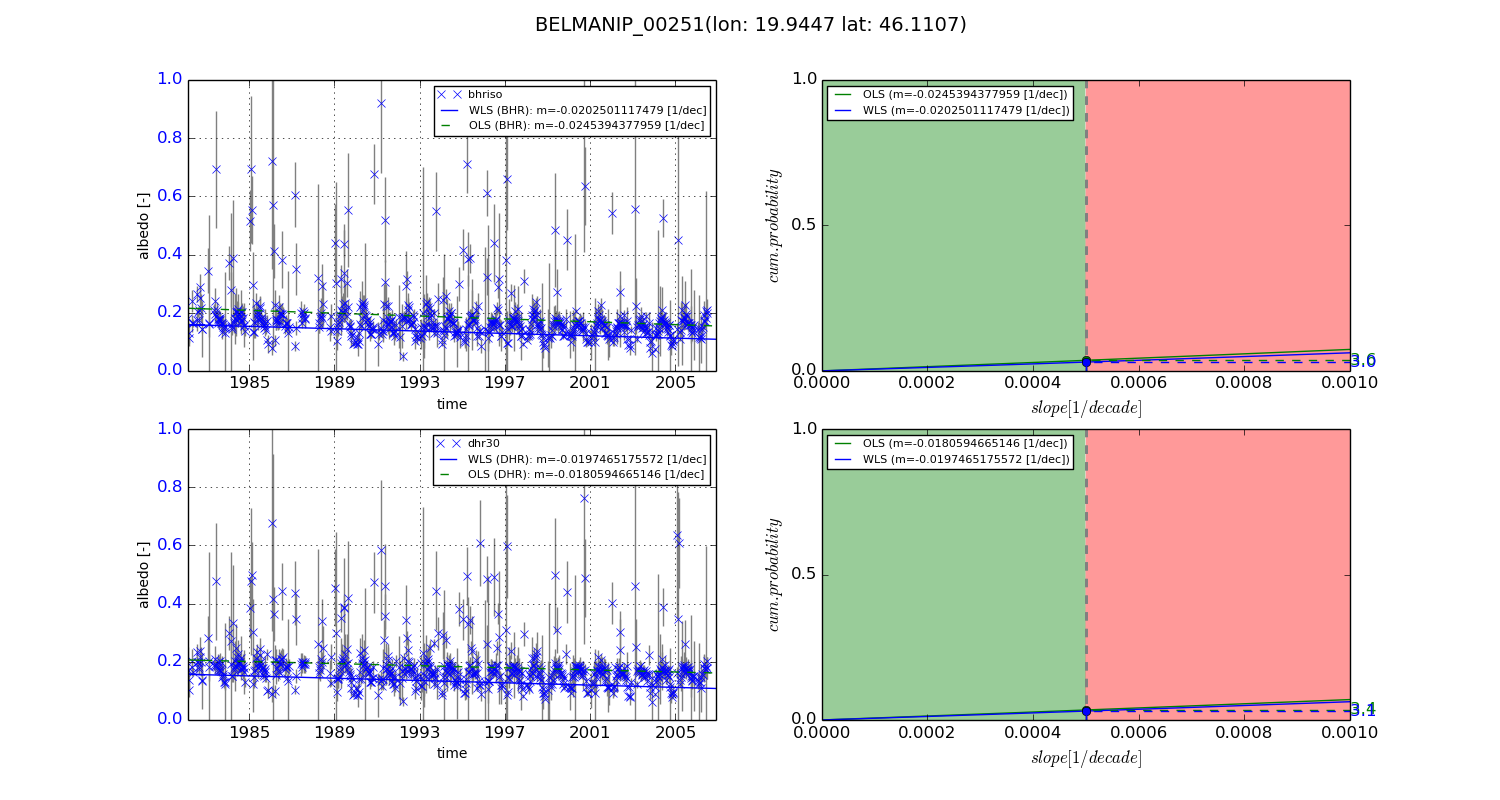
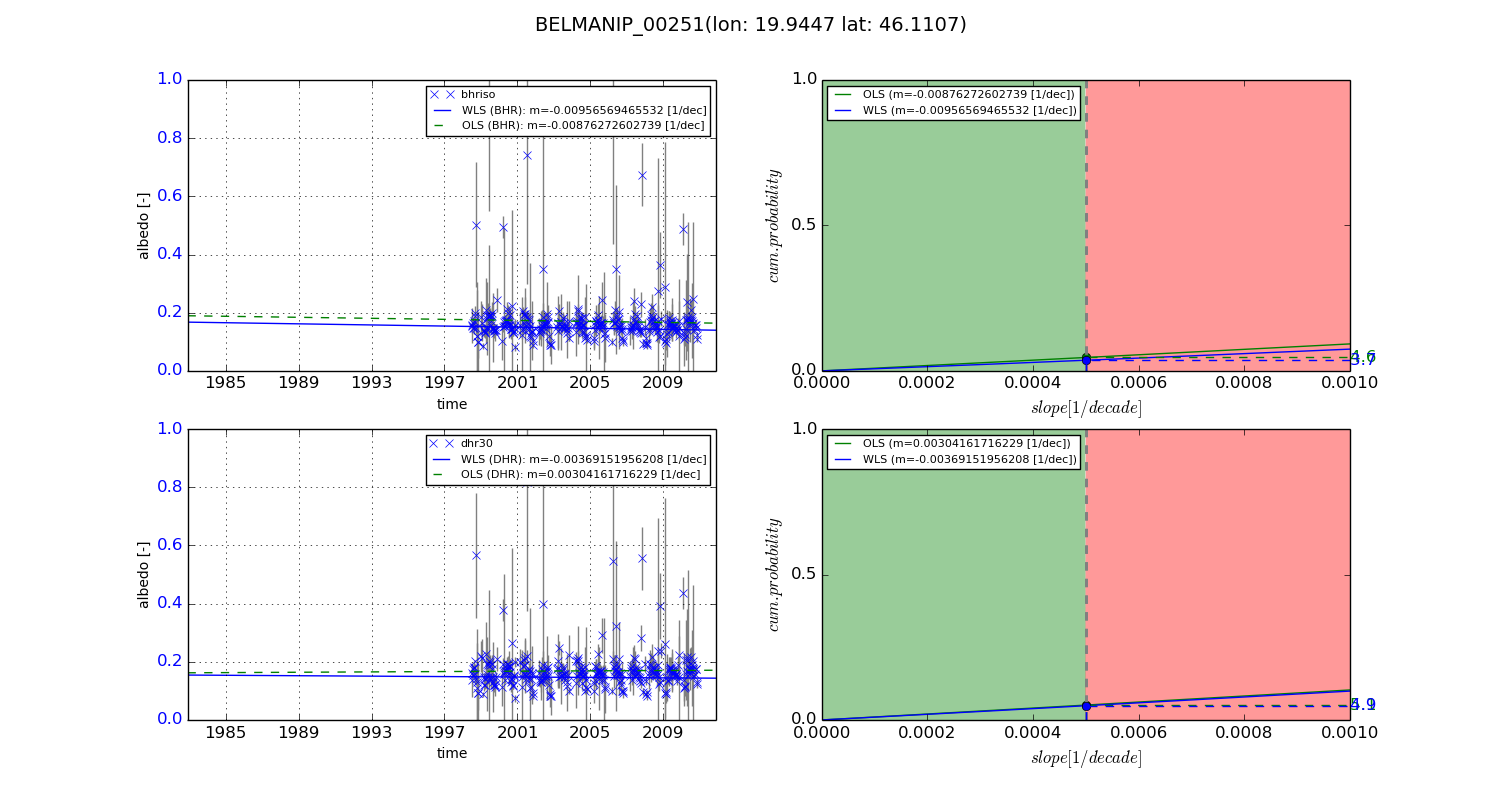
Temporal stability analysis

+000 deg (BHR)


BHR statistics

Temporal stability [1/decade]:


abs

rel


Weighted least square:

-0.0202501117479


Ordinary least square:

-0.0245394377959


Probabilities that GCOS criteria is met:

Weighted least square:

3.0 %

Ordinary least square:

3.6 %


DHR statistics

Temporal stability [1/decade]:


abs

rel


Weighted least square:

-0.0197465175572


Ordinary least square:

-0.0180594665146


Probabilities that GCOS criteria is met:

Weighted least square:

3.1 %

Ordinary least square:

3.4 %


+057/+063 deg (BHR)


BHR statistics

Temporal stability [1/decade]:


abs

rel


Weighted least square:

-0.00956569465532


Ordinary least square:

-0.00876272602739


Probabilities that GCOS criteria is met:

Weighted least square:

3.7 %

Ordinary least square:

4.6 %


DHR statistics

Temporal stability [1/decade]:


abs

rel


Weighted least square:

-0.00369151956208


Ordinary least square:

0.00304161716229


Probabilities that GCOS criteria is met:

Weighted least square:

4.9 %

Ordinary least square:

5.1 %


Temporal anomaly analyis

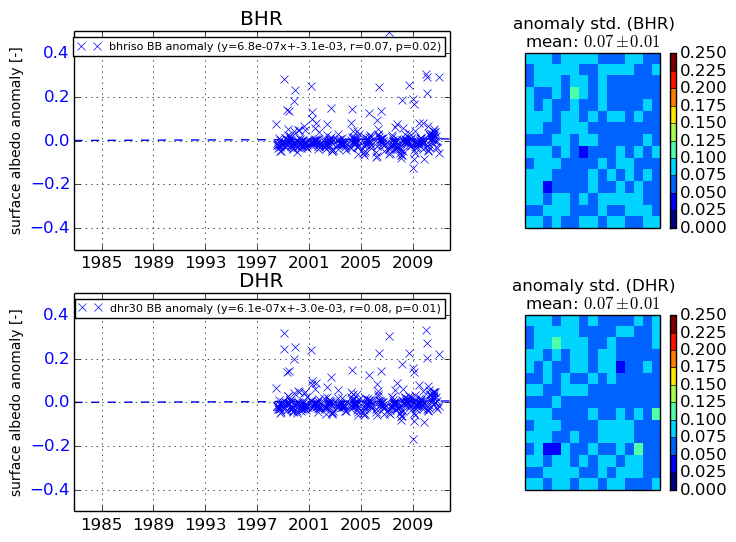
The variance of the temporal anomalies provides an additional measure about the stability of the signal AFTER removal of the mean seasonal cylce.
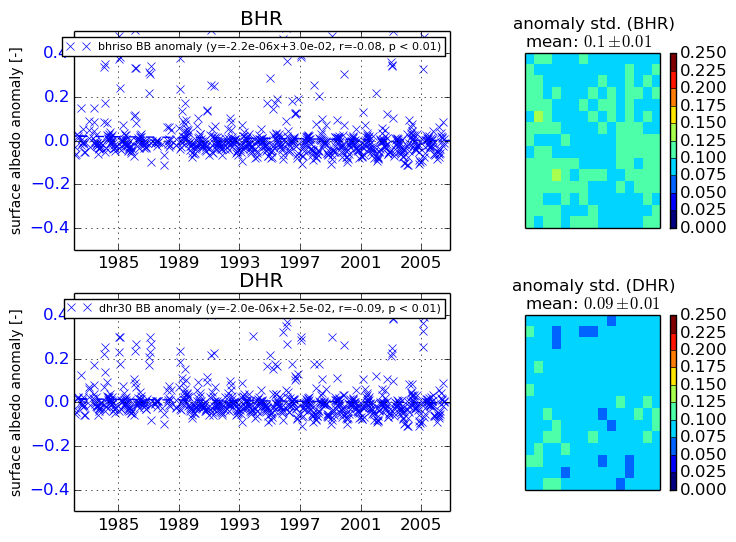
+000 deg


+057/+063 deg