BELMANIP_00252


Location

lon / lat [deg]: 27.1468 / 41.4703

Source network: BELMANIP


Geostationary surface albedo (GSA) data


“+000”


“+057/+063”


Landcover information (based on ESA CCI landcover data)


Landcover fractions @ 2km distance


Landcover fractions @ 20 km distance


Legend


Distance to open water bodies [km]:

1.0

Distance to urban areas [km]:

0.16


Radius: 1 km

Number of landcover classes:

3

Dominant landcover type:

10: cropland, rainfed

Fraction of dominant landcover type [%]:

81.0


Radius: 2 km

Number of landcover classes:

3

Dominant landcover type:

10: cropland, rainfed

Fraction of dominant landcover type [%]:

91.0


Radius: 5 km

Number of landcover classes:

3

Dominant landcover type:

10: cropland, rainfed

Fraction of dominant landcover type [%]:

79.0


Radius: 10 km

Number of landcover classes:

3

Dominant landcover type:

10: cropland, rainfed

Fraction of dominant landcover type [%]:

79.0


Radius: 20 km

Number of landcover classes:

3

Dominant landcover type:

10: cropland, rainfed

Fraction of dominant landcover type [%]:

73.0


Disturbances


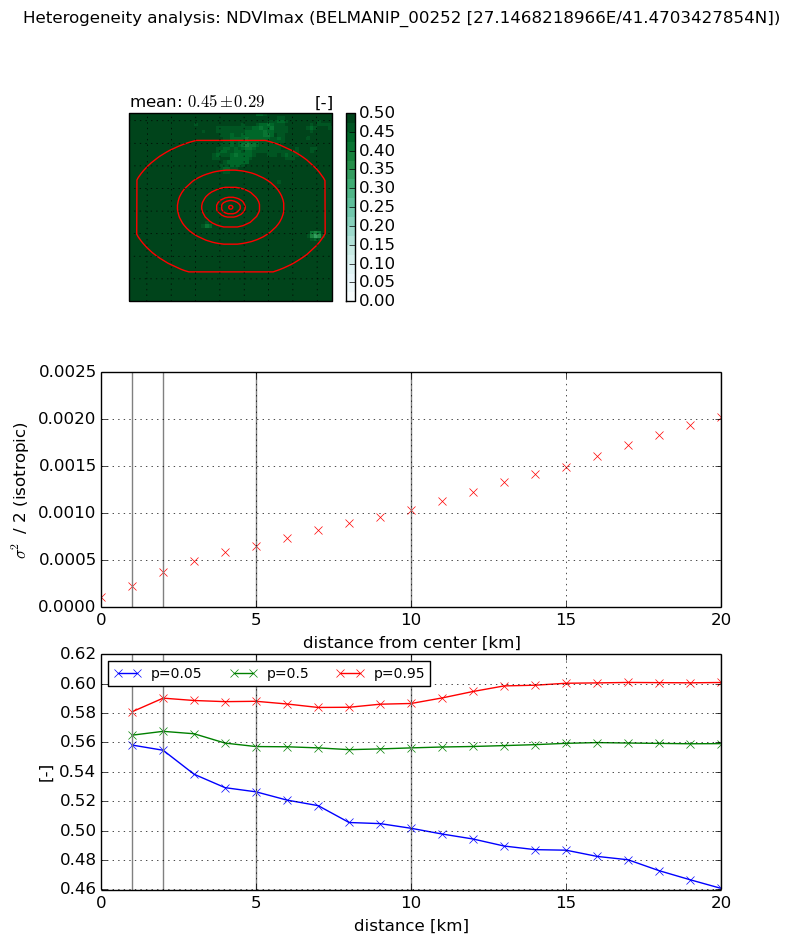
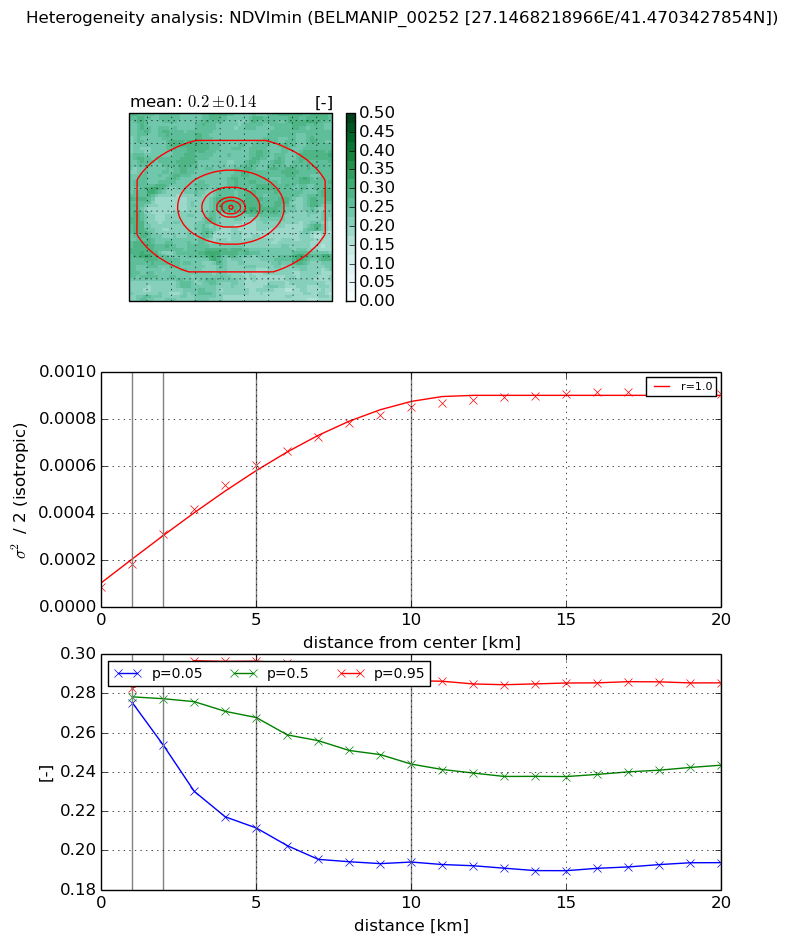
Heterogeneity analysis

The heterogeneity analysis provides information about the spatial and temporal heterogeneity of the site.

Topography


Roman et al. (2009) index


St

11.5582554205

Rcv

0.174209992443

Rse

0.0

Rst

0.0713273248252

Rsv

0.0140174244177


Height range @ 1km [m]

46

Height range @ 2km [m]

65

Height range @ 5km [m]

85

Height range @ 10km [m]

-999

Height range @ 20km [m]

-999


Variance slope @ 1 km

232

Variance slope @ 2 km

215

Variance slope @ 5 km

125

Variance slope @ 10 km

-999

Variance slope @ 20 km

-999


NDVI (max. NDVI composite)


Roman et al. (2009) index


St

nan

Rcv

nan

Rse

nan

Rst

nan

Rsv

nan


NDVI range @ 1km [-]

0.02

NDVI range @ 2km [-]

0.04

NDVI range @ 5km [-]

0.06

NDVI range @ 10km [-]

0.08

NDVI range @ 20km [-]

0.14


Variance slope @ 1 km

0.000112325810573

Variance slope @ 2 km

0.000130521493163

Variance slope @ 5 km

0.000111243270225

Variance slope @ 10 km

9.02055007361e-05

Variance slope @ 20 km

9.11497903663e-05


NDVI (min. NDVI composite)I


Roman et al. (2009) index


St

2.92058345917e-07

Rcv

0.357909858196

Rse

0.0

Rst

0.190115819678

Rsv

10271919.5732


NDVI range @ 1km [-]

0.01

NDVI range @ 2km [-]

0.04

NDVI range @ 5km [-]

0.09

NDVI range @ 10km [-]

0.09

NDVI range @ 20km [-]

0.09


NDVI slope @ 1 km

9.69853355904e-05

NDVI slope @ 2 km

0.000111611566063

NDVI slope @ 5 km

0.000105403903259

NDVI slope @ 10 km

7.7477469622e-05

NDVI slope @ 20 km

3.72460432715e-05


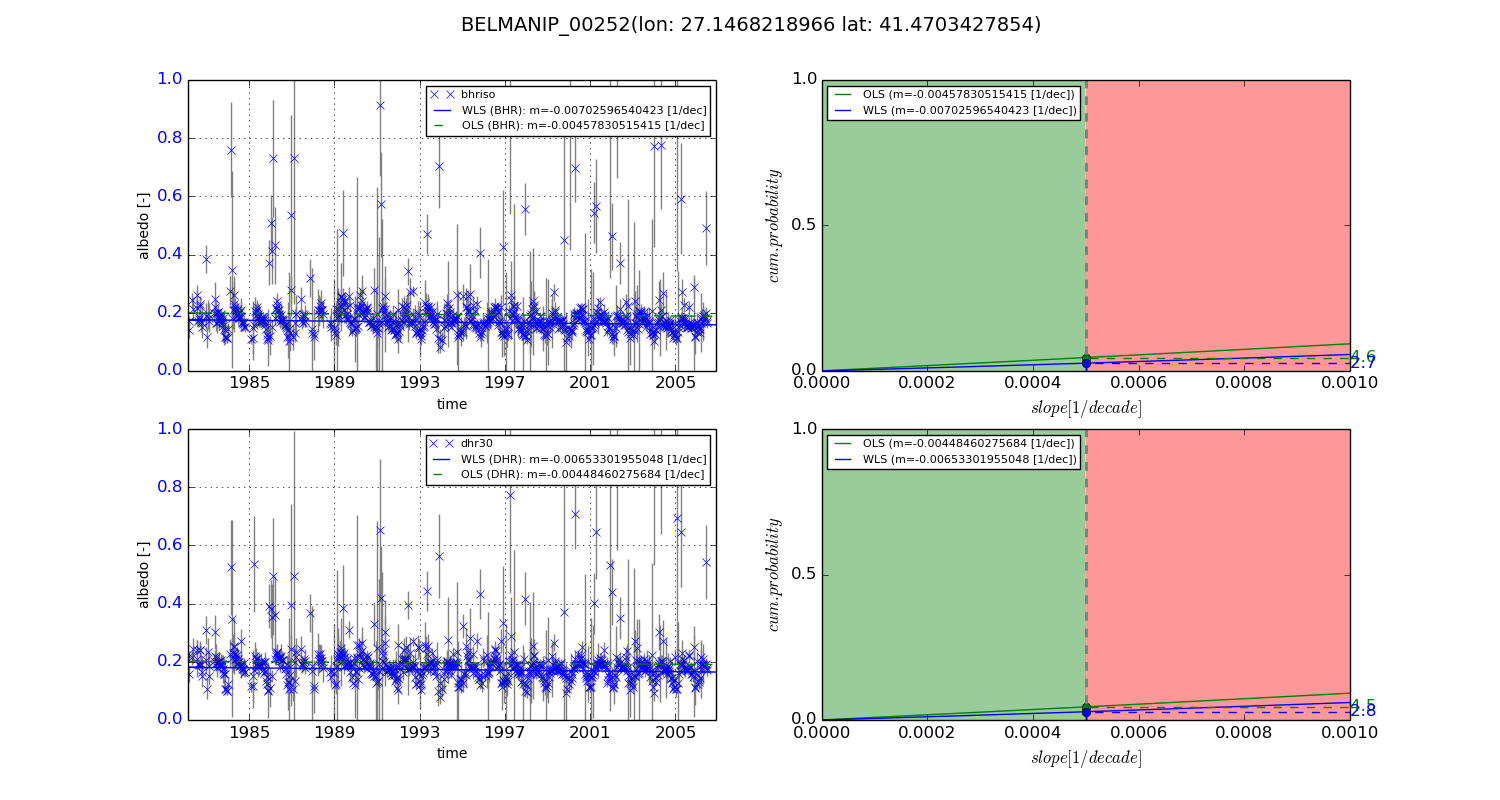
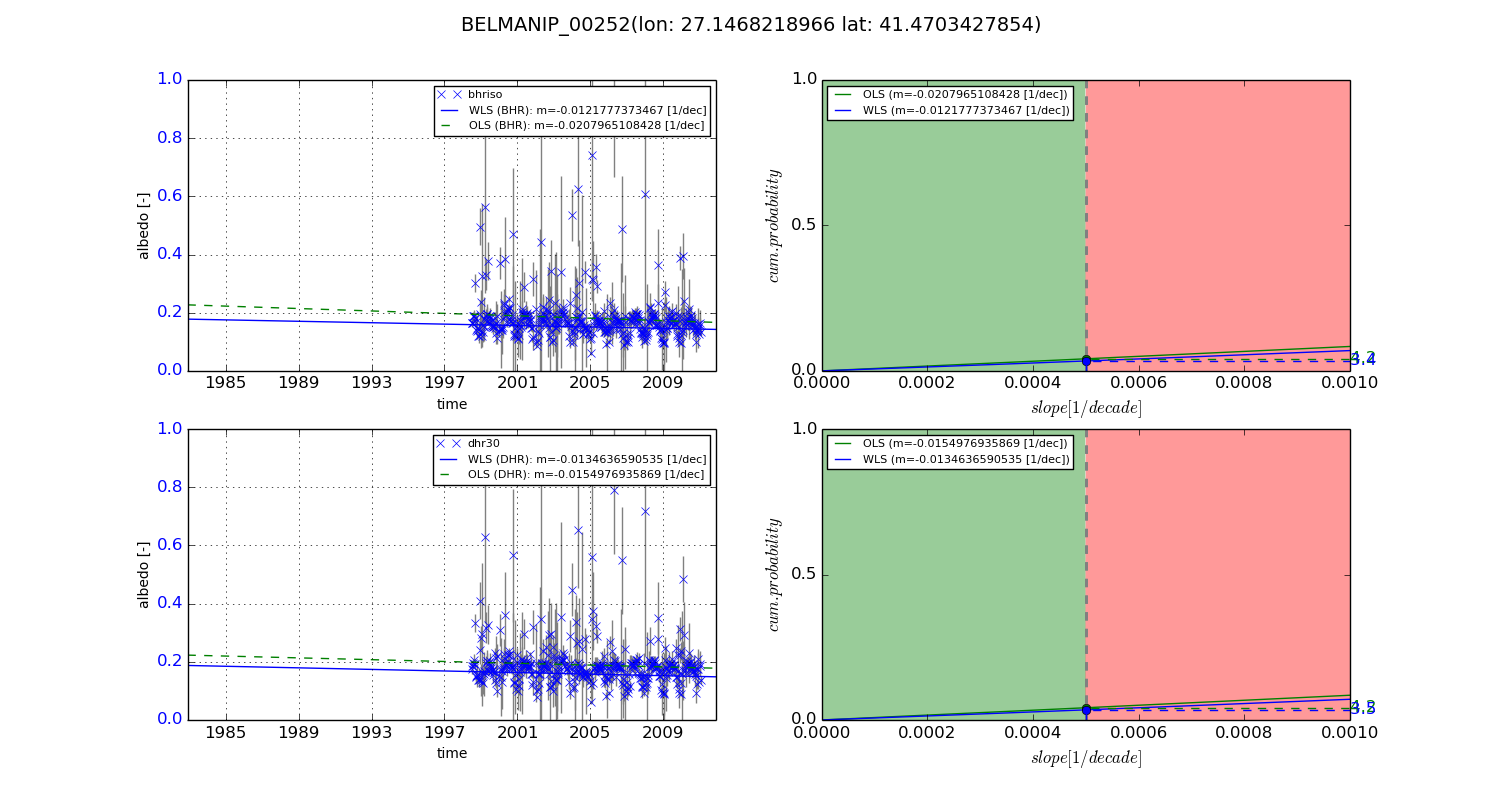
Temporal stability analysis

+000 deg (BHR)


BHR statistics

Temporal stability [1/decade]:


abs

rel


Weighted least square:

-0.00702596540423


Ordinary least square:

-0.00457830515415


Probabilities that GCOS criteria is met:

Weighted least square:

2.7 %

Ordinary least square:

4.6 %


DHR statistics

Temporal stability [1/decade]:


abs

rel


Weighted least square:

-0.00653301955048


Ordinary least square:

-0.00448460275684


Probabilities that GCOS criteria is met:

Weighted least square:

2.8 %

Ordinary least square:

4.5 %


+057/+063 deg (BHR)


BHR statistics

Temporal stability [1/decade]:


abs

rel


Weighted least square:

-0.0121777373467


Ordinary least square:

-0.0207965108428


Probabilities that GCOS criteria is met:

Weighted least square:

3.4 %

Ordinary least square:

4.2 %


DHR statistics

Temporal stability [1/decade]:


abs

rel


Weighted least square:

-0.0134636590535


Ordinary least square:

-0.0154976935869


Probabilities that GCOS criteria is met:

Weighted least square:

3.5 %

Ordinary least square:

4.2 %


Temporal anomaly analyis

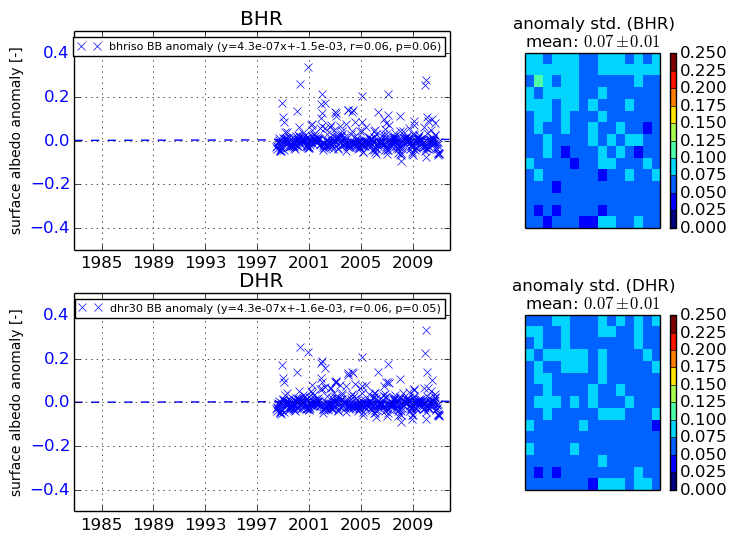
The variance of the temporal anomalies provides an additional measure about the stability of the signal AFTER removal of the mean seasonal cylce.
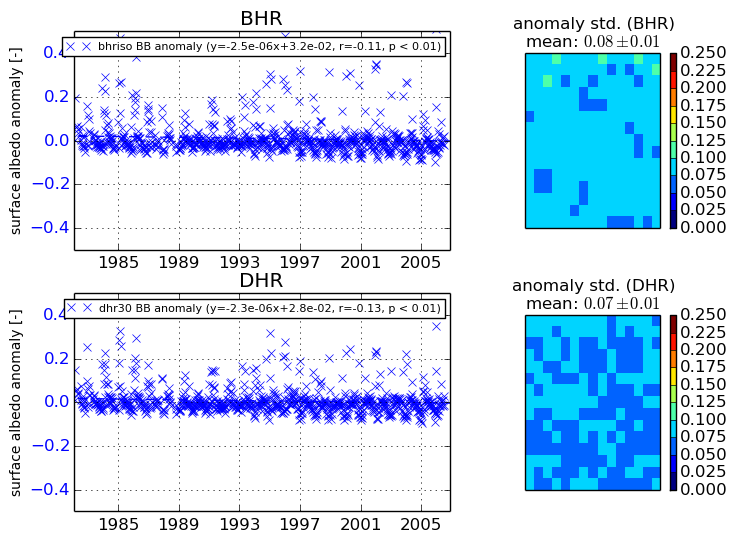
+000 deg


+057/+063 deg