BELMANIP_00254


Location

lon / lat [deg]: 46.1005 / 45.427

Source network: BELMANIP


Geostationary surface albedo (GSA) data


“+000”


“+057/+063”


Landcover information (based on ESA CCI landcover data)


Landcover fractions @ 2km distance


Landcover fractions @ 20 km distance


Legend


Distance to open water bodies [km]:

0.62

Distance to urban areas [km]:

11.61


Radius: 1 km

Number of landcover classes:

3

Dominant landcover type:

130: grassland

Fraction of dominant landcover type [%]:

60.0


Radius: 2 km

Number of landcover classes:

4

Dominant landcover type:

130: grassland

Fraction of dominant landcover type [%]:

76.0


Radius: 5 km

Number of landcover classes:

4

Dominant landcover type:

130: grassland

Fraction of dominant landcover type [%]:

84.0


Radius: 10 km

Number of landcover classes:

4

Dominant landcover type:

130: grassland

Fraction of dominant landcover type [%]:

75.0


Radius: 20 km

Number of landcover classes:

4

Dominant landcover type:

130: grassland

Fraction of dominant landcover type [%]:

76.0


Disturbances


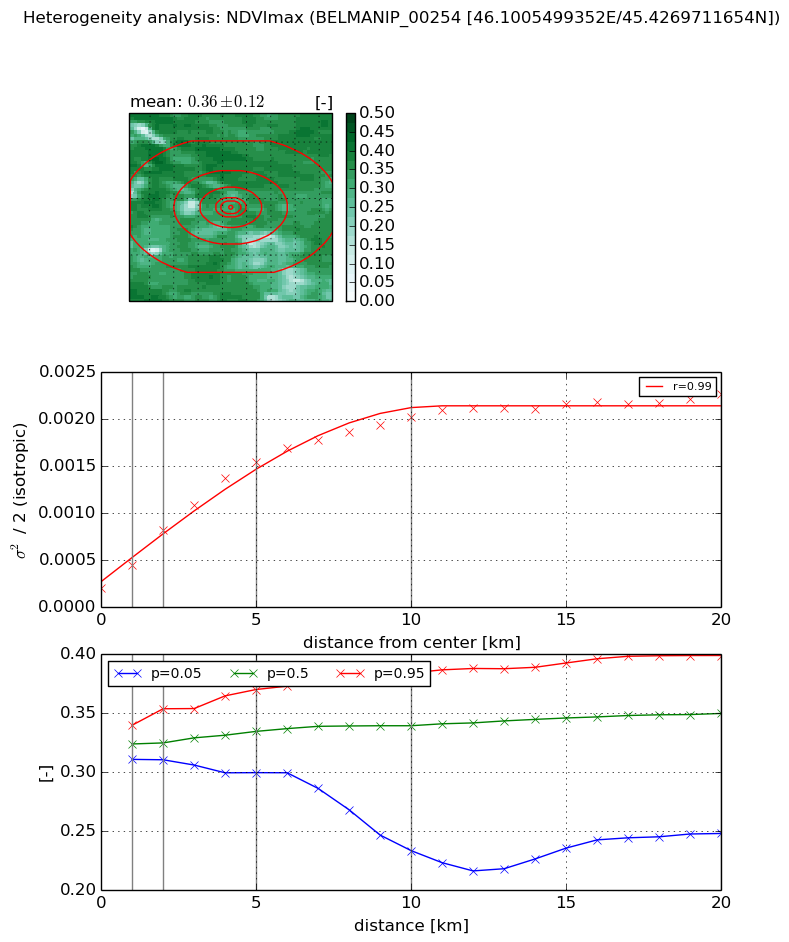
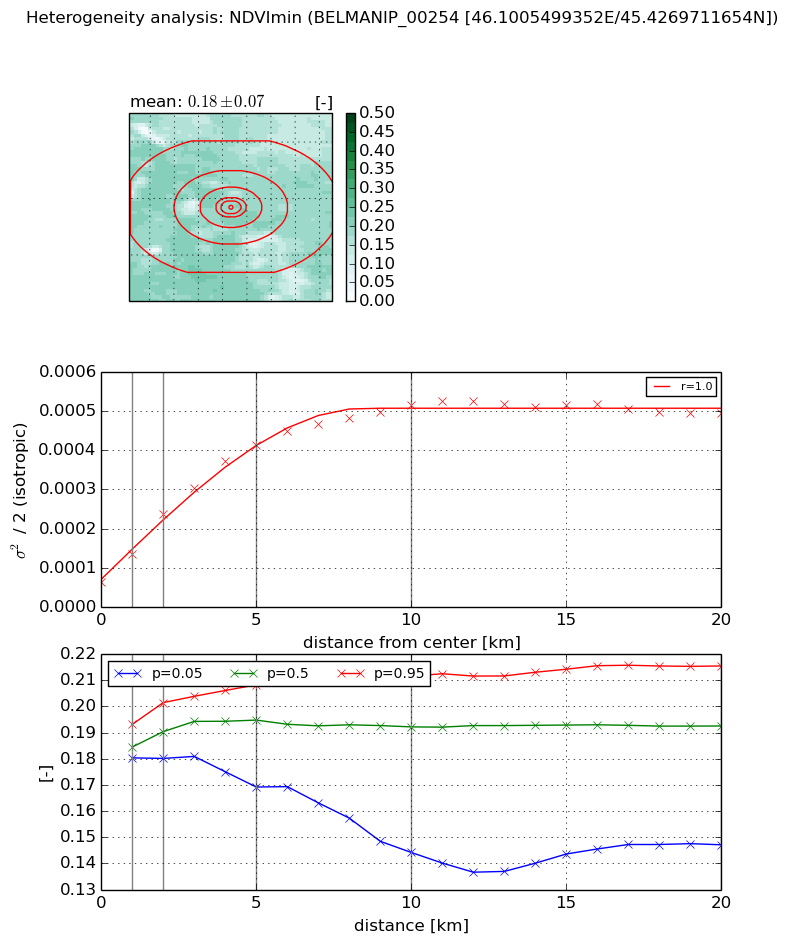
Heterogeneity analysis

The heterogeneity analysis provides information about the spatial and temporal heterogeneity of the site.

Topography


Roman et al. (2009) index


St

nan

Rcv

nan

Rse

nan

Rst

nan

Rsv

nan


Height range @ 1km [m]

-99999

Height range @ 2km [m]

-99999

Height range @ 5km [m]

-99999

Height range @ 10km [m]

-99999

Height range @ 20km [m]

-99999


Variance slope @ 1 km

-999

Variance slope @ 2 km

-999

Variance slope @ 5 km

-999

Variance slope @ 10 km

-999

Variance slope @ 20 km

-999


NDVI (max. NDVI composite)


Roman et al. (2009) index


St

7.04499871955

Rcv

0.353004439232

Rse

0.0

Rst

0.0121883843607

Rsv

0.0606411785736


NDVI range @ 1km [-]

0.03

NDVI range @ 2km [-]

0.04

NDVI range @ 5km [-]

0.07

NDVI range @ 10km [-]

0.15

NDVI range @ 20km [-]

0.15


Variance slope @ 1 km

0.000236233855463

Variance slope @ 2 km

0.000304188560109

Variance slope @ 5 km

0.000278973389958

Variance slope @ 10 km

0.0001808304114

Variance slope @ 20 km

8.57564008492e-05


NDVI (min. NDVI composite)I


Roman et al. (2009) index


St

1.80170337691

Rcv

0.750150540023

Rse

0.0

Rst

0.121524877554

Rsv

0.793415539378


NDVI range @ 1km [-]

0.01

NDVI range @ 2km [-]

0.02

NDVI range @ 5km [-]

0.04

NDVI range @ 10km [-]

0.07

NDVI range @ 20km [-]

0.07


NDVI slope @ 1 km

6.92307910082e-05

NDVI slope @ 2 km

8.56035588469e-05

NDVI slope @ 5 km

7.22062199824e-05

NDVI slope @ 10 km

4.40479168398e-05

NDVI slope @ 20 km

1.67919050913e-05


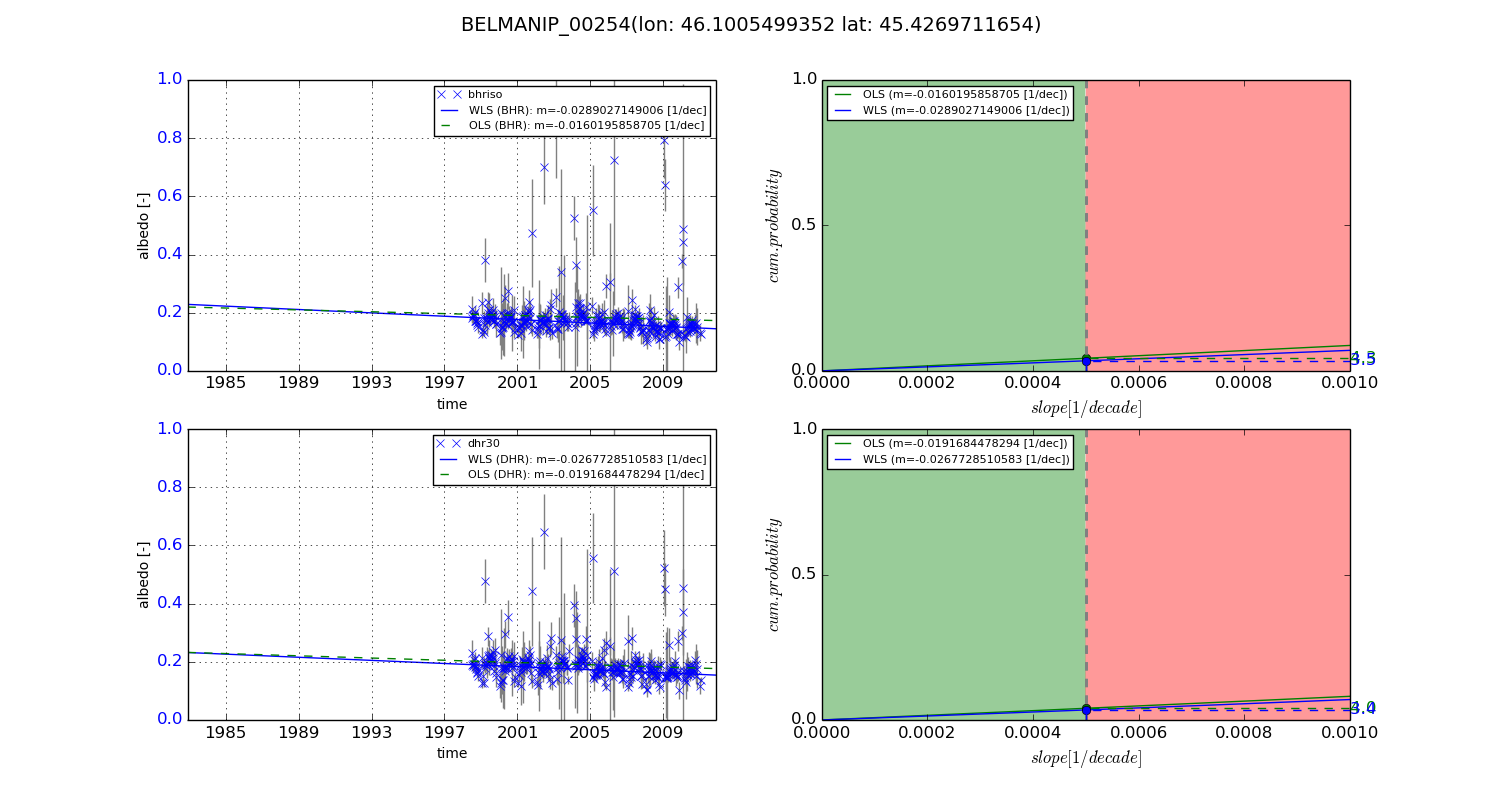
Temporal stability analysis

+000 deg (BHR)


BHR statistics

Temporal stability [1/decade]:


abs

rel


Weighted least square:

-99999.0


Ordinary least square:

-99999.0


Probabilities that GCOS criteria is met:

Weighted least square:

-99999.0 %

Ordinary least square:

-99999.0 %


DHR statistics

Temporal stability [1/decade]:


abs

rel


Weighted least square:

-99999.0


Ordinary least square:

-99999.0


Probabilities that GCOS criteria is met:

Weighted least square:

-99999.0 %

Ordinary least square:

-99999.0 %


+057/+063 deg (BHR)


BHR statistics

Temporal stability [1/decade]:


abs

rel


Weighted least square:

-0.0289027149006


Ordinary least square:

-0.0160195858705


Probabilities that GCOS criteria is met:

Weighted least square:

3.5 %

Ordinary least square:

4.3 %


DHR statistics

Temporal stability [1/decade]:


abs

rel


Weighted least square:

-0.0267728510583


Ordinary least square:

-0.0191684478294


Probabilities that GCOS criteria is met:

Weighted least square:

3.4 %

Ordinary least square:

4.0 %


Temporal anomaly analyis

The variance of the temporal anomalies provides an additional measure about the stability of the signal AFTER removal of the mean seasonal cylce.
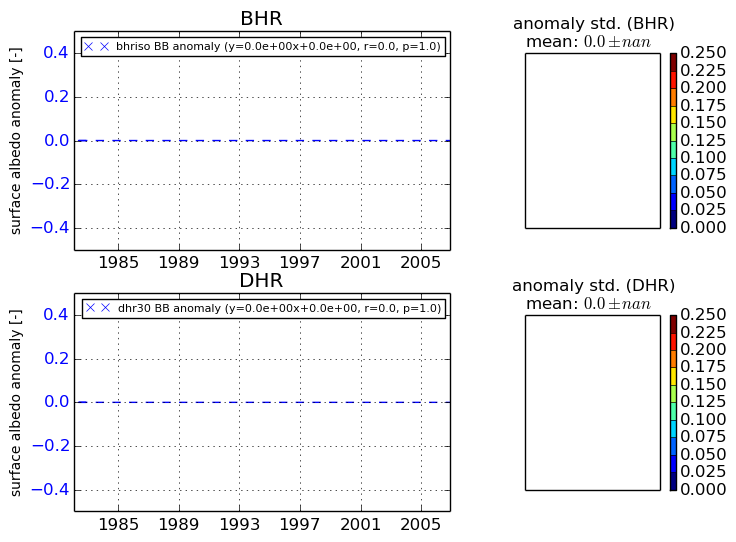
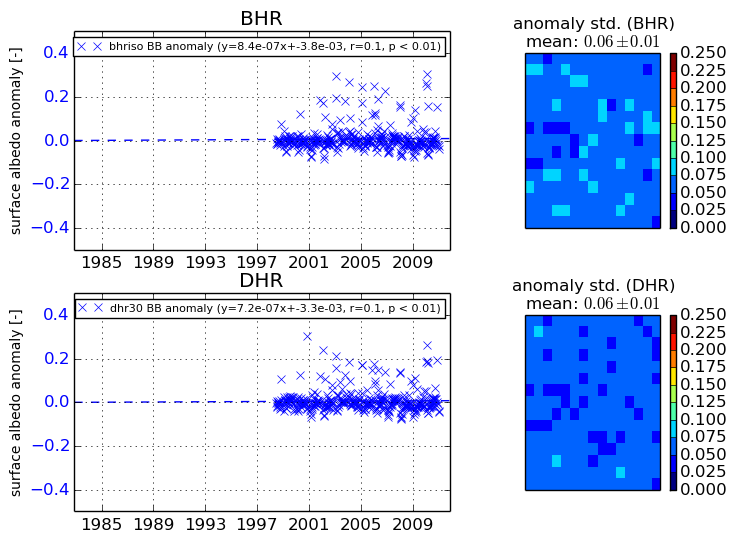
+000 deg


+057/+063 deg