BELMANIP_00256


Location

lon / lat [deg]: 55.5371 / 41.9733

Source network: BELMANIP


Geostationary surface albedo (GSA) data


“+000”


“+057/+063”


Landcover information (based on ESA CCI landcover data)


Landcover fractions @ 2km distance


Landcover fractions @ 20 km distance


Legend


Distance to open water bodies [km]:

58.78

Distance to urban areas [km]:

none in region


Radius: 1 km

Number of landcover classes:

1

Dominant landcover type:

200: bare areas

Fraction of dominant landcover type [%]:

100.0


Radius: 2 km

Number of landcover classes:

1

Dominant landcover type:

200: bare areas

Fraction of dominant landcover type [%]:

100.0


Radius: 5 km

Number of landcover classes:

1

Dominant landcover type:

200: bare areas

Fraction of dominant landcover type [%]:

100.0


Radius: 10 km

Number of landcover classes:

1

Dominant landcover type:

200: bare areas

Fraction of dominant landcover type [%]:

100.0


Radius: 20 km

Number of landcover classes:

1

Dominant landcover type:

200: bare areas

Fraction of dominant landcover type [%]:

100.0


Disturbances


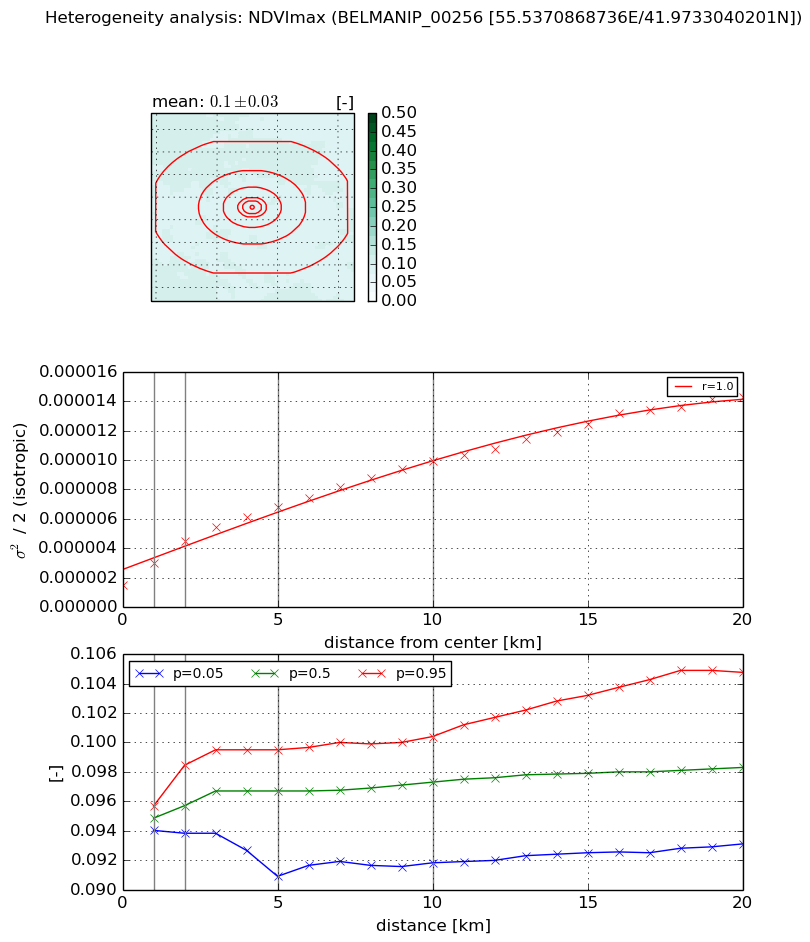
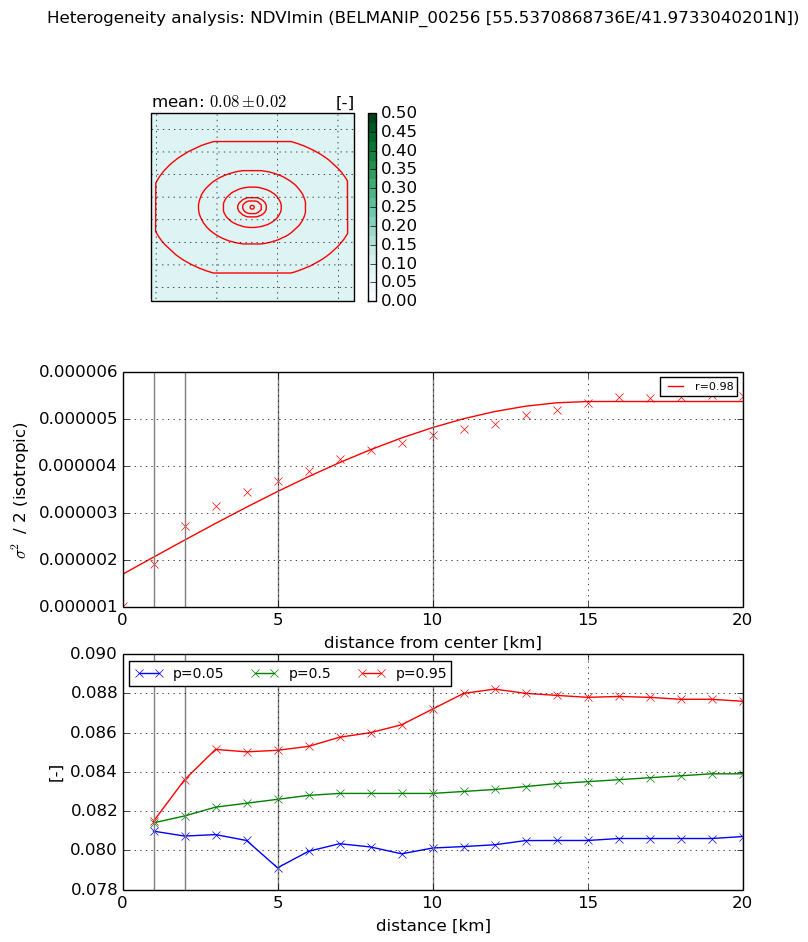
Heterogeneity analysis

The heterogeneity analysis provides information about the spatial and temporal heterogeneity of the site.

Topography


Roman et al. (2009) index


St

5.95036190545e-07

Rcv

0.205031298048

Rse

0.0

Rst

0.0309342635275

Rsv

5041709.91153


Height range @ 1km [m]

9

Height range @ 2km [m]

10

Height range @ 5km [m]

16

Height range @ 10km [m]

-999

Height range @ 20km [m]

-999


Variance slope @ 1 km

6

Variance slope @ 2 km

6

Variance slope @ 5 km

4

Variance slope @ 10 km

-999

Variance slope @ 20 km

-999


NDVI (max. NDVI composite)


Roman et al. (2009) index


St

1.98672389116

Rcv

0.458921776696

Rse

0.0

Rst

-0.0511024122143

Rsv

-0.999999430048


NDVI range @ 1km [-]

0.0

NDVI range @ 2km [-]

0.0

NDVI range @ 5km [-]

0.01

NDVI range @ 10km [-]

0.01

NDVI range @ 20km [-]

0.01


Variance slope @ 1 km

1.49017905656e-06

Variance slope @ 2 km

1.49729311285e-06

Variance slope @ 5 km

1.04756780345e-06

Variance slope @ 10 km

7.93346072775e-07

Variance slope @ 20 km

5.97174540422e-07


NDVI (min. NDVI composite)I


Roman et al. (2009) index


St

2.832708939

Rcv

0.339669226204

Rse

0.0

Rst

-0.258558367597

Rsv

-0.460829324717


NDVI range @ 1km [-]

0.0

NDVI range @ 2km [-]

0.0

NDVI range @ 5km [-]

0.01

NDVI range @ 10km [-]

0.01

NDVI range @ 20km [-]

0.01


NDVI slope @ 1 km

9.06581923895e-07

NDVI slope @ 2 km

8.59293270736e-07

NDVI slope @ 5 km

5.22817854386e-07

NDVI slope @ 10 km

3.24966029263e-07

NDVI slope @ 20 km

1.88016770049e-07


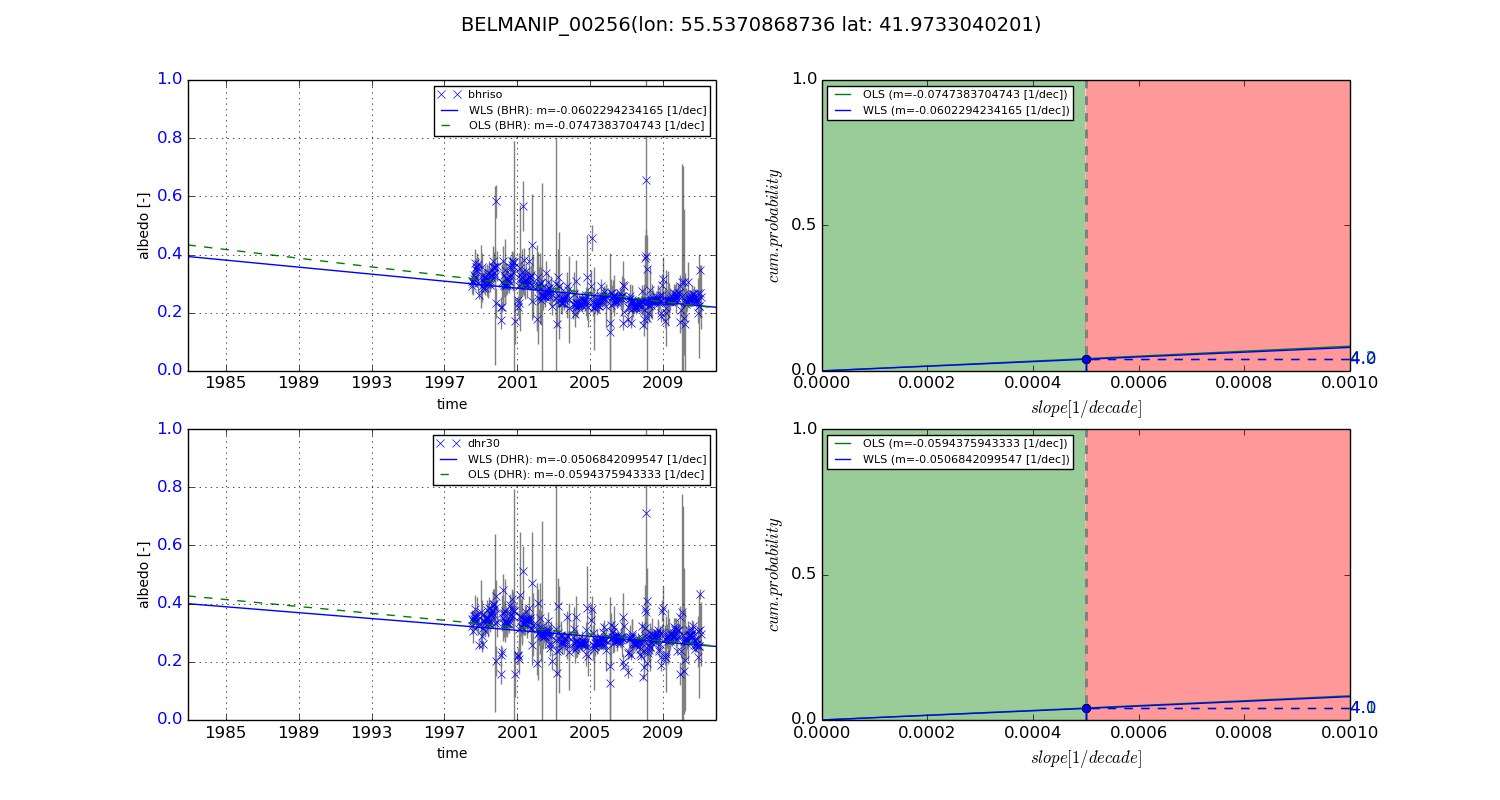
Temporal stability analysis

+000 deg (BHR)


BHR statistics

Temporal stability [1/decade]:


abs

rel


Weighted least square:

-99999.0


Ordinary least square:

-99999.0


Probabilities that GCOS criteria is met:

Weighted least square:

-99999.0 %

Ordinary least square:

-99999.0 %


DHR statistics

Temporal stability [1/decade]:


abs

rel


Weighted least square:

-99999.0


Ordinary least square:

-99999.0


Probabilities that GCOS criteria is met:

Weighted least square:

-99999.0 %

Ordinary least square:

-99999.0 %


+057/+063 deg (BHR)


BHR statistics

Temporal stability [1/decade]:


abs

rel


Weighted least square:

-0.0602294234165


Ordinary least square:

-0.0747383704743


Probabilities that GCOS criteria is met:

Weighted least square:

4.0 %

Ordinary least square:

4.2 %


DHR statistics

Temporal stability [1/decade]:


abs

rel


Weighted least square:

-0.0506842099547


Ordinary least square:

-0.0594375943333


Probabilities that GCOS criteria is met:

Weighted least square:

4.0 %

Ordinary least square:

4.1 %


Temporal anomaly analyis

The variance of the temporal anomalies provides an additional measure about the stability of the signal AFTER removal of the mean seasonal cylce.
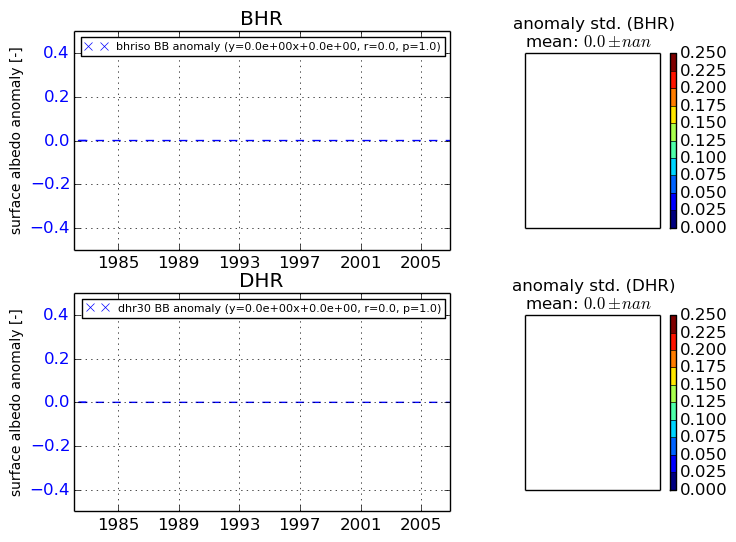
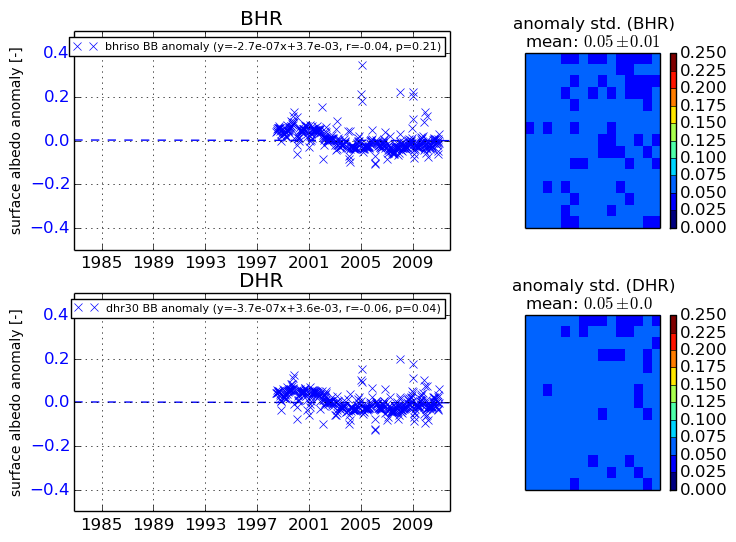
+000 deg


+057/+063 deg