BELMANIP_00266


Location

lon / lat [deg]: 2.5721 / 50.8836

Source network: BELMANIP


Geostationary surface albedo (GSA) data


“+000”


“+057/+063”


Landcover information (based on ESA CCI landcover data)


Landcover fractions @ 2km distance


Landcover fractions @ 20 km distance


Legend


Distance to open water bodies [km]:

19.2

Distance to urban areas [km]:

1.68


Radius: 1 km

Number of landcover classes:

1

Dominant landcover type:

10: cropland, rainfed

Fraction of dominant landcover type [%]:

100.0


Radius: 2 km

Number of landcover classes:

1

Dominant landcover type:

10: cropland, rainfed

Fraction of dominant landcover type [%]:

99.0


Radius: 5 km

Number of landcover classes:

2

Dominant landcover type:

10: cropland, rainfed

Fraction of dominant landcover type [%]:

98.0


Radius: 10 km

Number of landcover classes:

2

Dominant landcover type:

10: cropland, rainfed

Fraction of dominant landcover type [%]:

96.0


Radius: 20 km

Number of landcover classes:

3

Dominant landcover type:

10: cropland, rainfed

Fraction of dominant landcover type [%]:

90.0


Disturbances


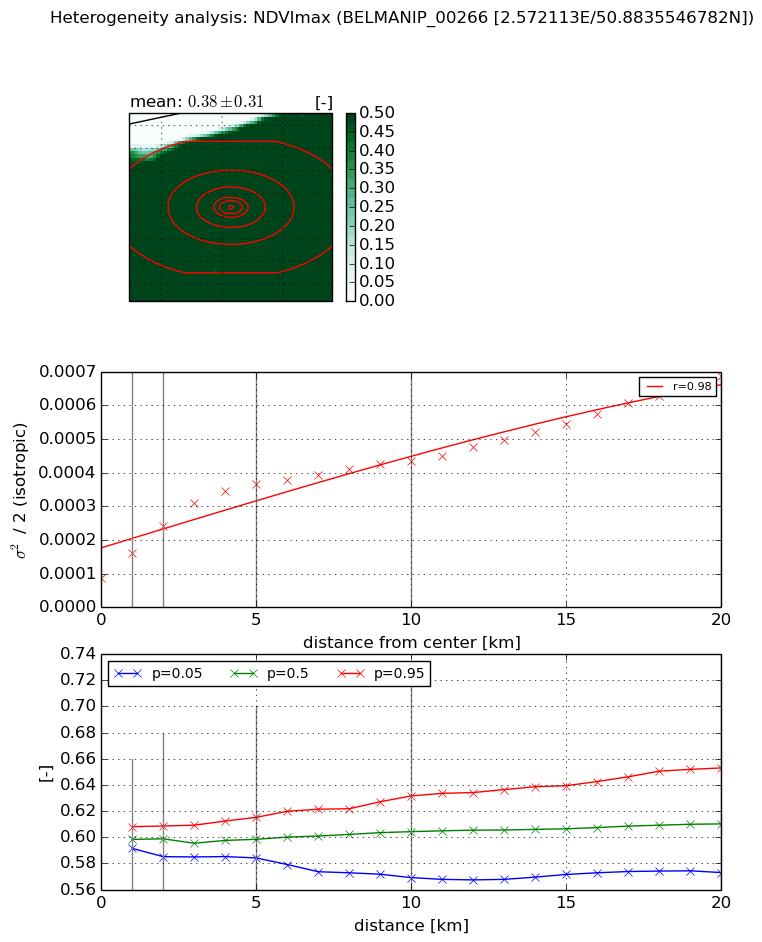
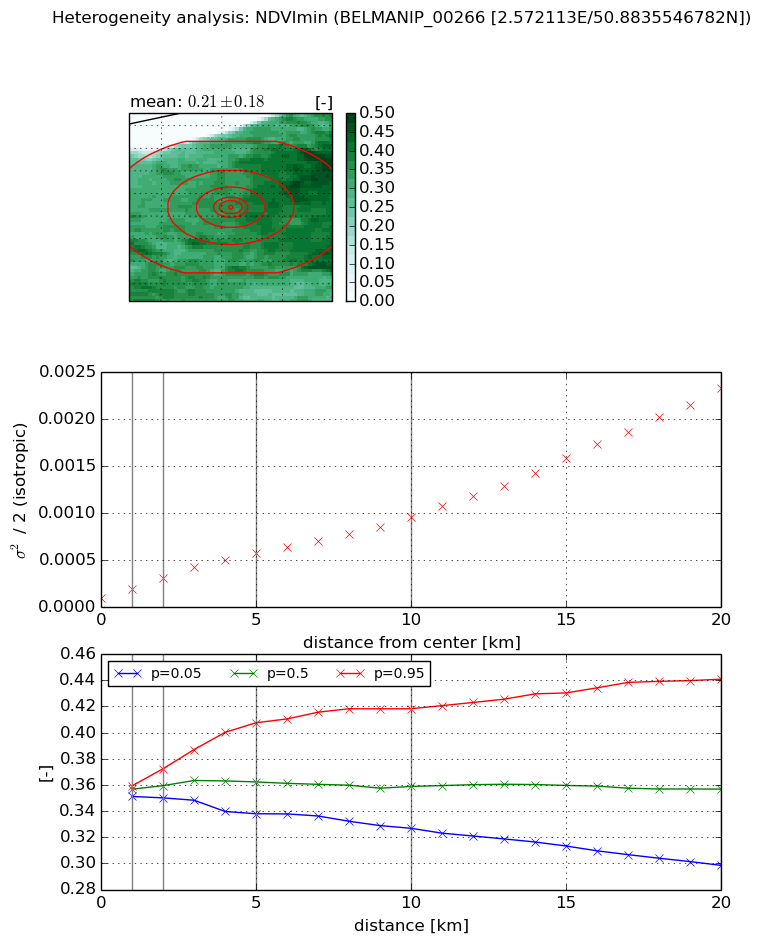
Heterogeneity analysis

The heterogeneity analysis provides information about the spatial and temporal heterogeneity of the site.

Topography


Roman et al. (2009) index


St

1.80632983872e-06

Rcv

0.0567924463472

Rse

0.0

Rst

-0.00779414353854

Rsv

1660826.1786


Height range @ 1km [m]

7

Height range @ 2km [m]

11

Height range @ 5km [m]

18

Height range @ 10km [m]

-999

Height range @ 20km [m]

-999


Variance slope @ 1 km

8

Variance slope @ 2 km

8

Variance slope @ 5 km

7

Variance slope @ 10 km

-999

Variance slope @ 20 km

-999


NDVI (max. NDVI composite)


Roman et al. (2009) index


St

2.05271053247

Rcv

0.163073994625

Rse

0.0

Rst

-0.298409239511

Rsv

-0.999999012165


NDVI range @ 1km [-]

0.02

NDVI range @ 2km [-]

0.02

NDVI range @ 5km [-]

0.03

NDVI range @ 10km [-]

0.06

NDVI range @ 20km [-]

0.08


Variance slope @ 1 km

7.26845382979e-05

Variance slope @ 2 km

7.66189334296e-05

Variance slope @ 5 km

5.73838405982e-05

Variance slope @ 10 km

3.18987263946e-05

Variance slope @ 20 km

2.46163529369e-05


NDVI (min. NDVI composite)I


Roman et al. (2009) index


St

2.28639130233

Rcv

0.772913826674

Rse

0.0

Rst

-1.98909353399e-09

Rsv

0.539197530818


NDVI range @ 1km [-]

0.01

NDVI range @ 2km [-]

0.02

NDVI range @ 5km [-]

0.07

NDVI range @ 10km [-]

0.09

NDVI range @ 20km [-]

0.14


NDVI slope @ 1 km

9.74616281459e-05

NDVI slope @ 2 km

0.000107601773904

NDVI slope @ 5 km

9.81245025392e-05

NDVI slope @ 10 km

8.19940694716e-05

NDVI slope @ 20 km

0.000106449983165


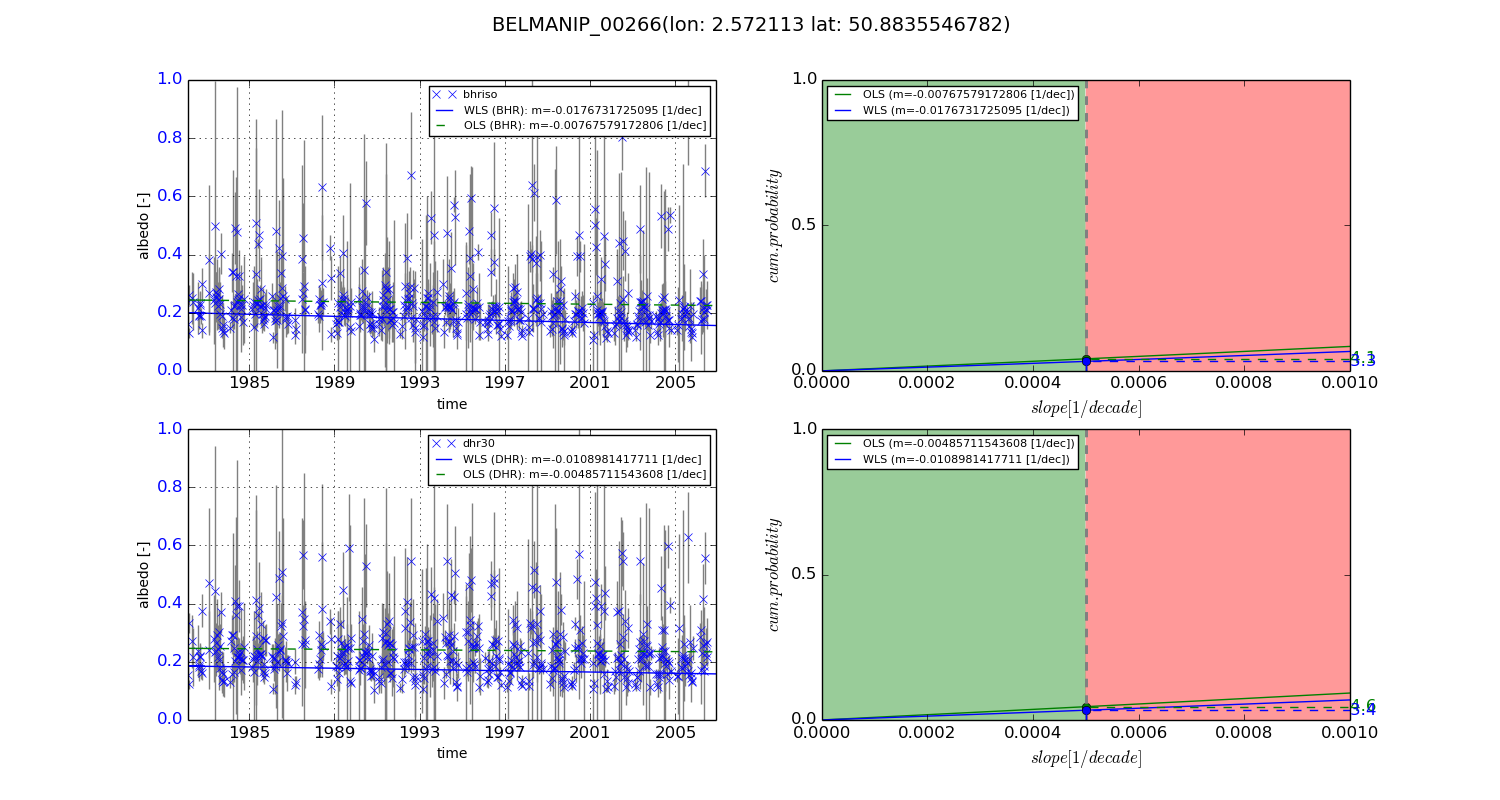
Temporal stability analysis

+000 deg (BHR)


BHR statistics

Temporal stability [1/decade]:


abs

rel


Weighted least square:

-0.0176731725095


Ordinary least square:

-0.00767579172806


Probabilities that GCOS criteria is met:

Weighted least square:

3.3 %

Ordinary least square:

4.1 %


DHR statistics

Temporal stability [1/decade]:


abs

rel


Weighted least square:

-0.0108981417711


Ordinary least square:

-0.00485711543608


Probabilities that GCOS criteria is met:

Weighted least square:

3.4 %

Ordinary least square:

4.6 %


+057/+063 deg (BHR)


BHR statistics

Temporal stability [1/decade]:


abs

rel


Weighted least square:

-99999.0


Ordinary least square:

-99999.0


Probabilities that GCOS criteria is met:

Weighted least square:

-99999.0 %

Ordinary least square:

-99999.0 %


DHR statistics

Temporal stability [1/decade]:


abs

rel


Weighted least square:

-99999.0


Ordinary least square:

-99999.0


Probabilities that GCOS criteria is met:

Weighted least square:

-99999.0 %

Ordinary least square:

-99999.0 %


Temporal anomaly analyis

The variance of the temporal anomalies provides an additional measure about the stability of the signal AFTER removal of the mean seasonal cylce.
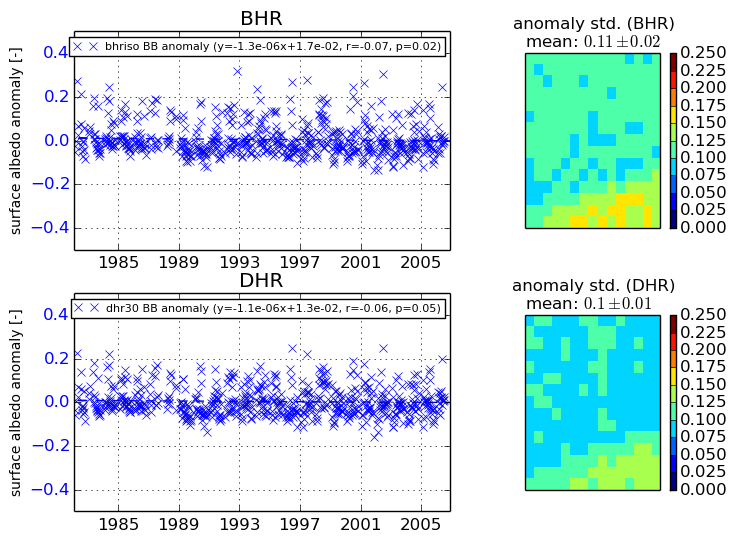
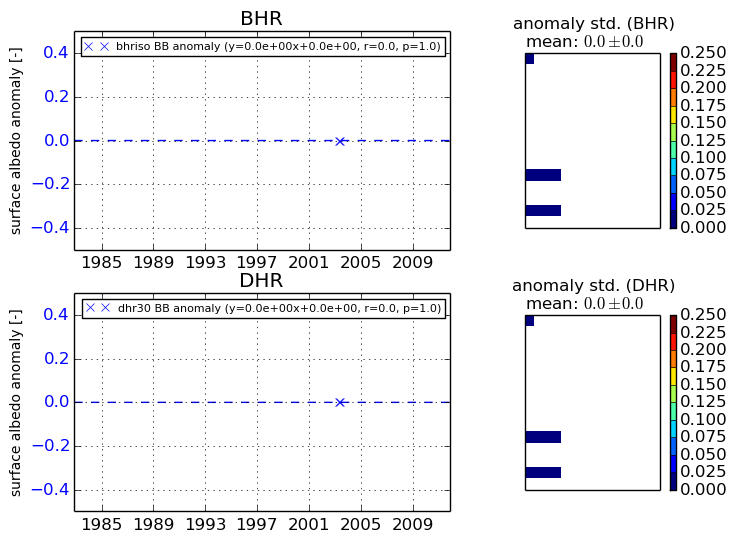
+000 deg


+057/+063 deg