BELMANIP_00267


Location

lon / lat [deg]: 11.4999 / 51.068

Source network: BELMANIP


Geostationary surface albedo (GSA) data


“+000”


“+057/+063”


Landcover information (based on ESA CCI landcover data)


Landcover fractions @ 2km distance


Landcover fractions @ 20 km distance


Legend


Distance to open water bodies [km]:

12.11

Distance to urban areas [km]:

1.23


Radius: 1 km

Number of landcover classes:

1

Dominant landcover type:

10: cropland, rainfed

Fraction of dominant landcover type [%]:

100.0


Radius: 2 km

Number of landcover classes:

2

Dominant landcover type:

10: cropland, rainfed

Fraction of dominant landcover type [%]:

96.0


Radius: 5 km

Number of landcover classes:

2

Dominant landcover type:

10: cropland, rainfed

Fraction of dominant landcover type [%]:

87.0


Radius: 10 km

Number of landcover classes:

3

Dominant landcover type:

10: cropland, rainfed

Fraction of dominant landcover type [%]:

89.0


Radius: 20 km

Number of landcover classes:

4

Dominant landcover type:

10: cropland, rainfed

Fraction of dominant landcover type [%]:

79.0


Disturbances


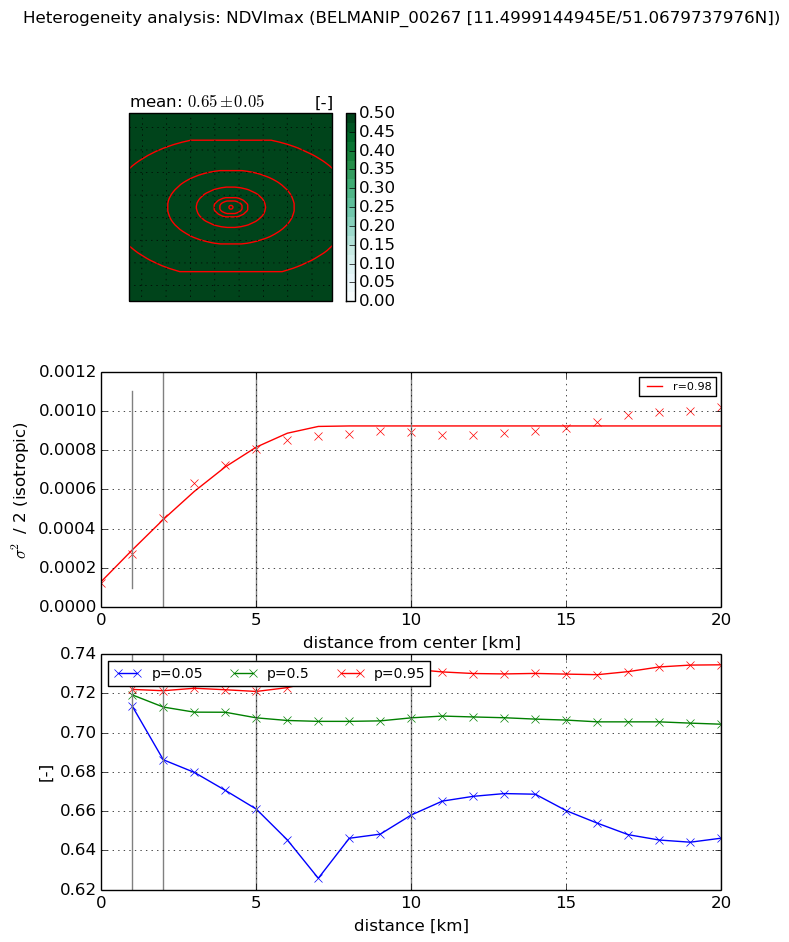
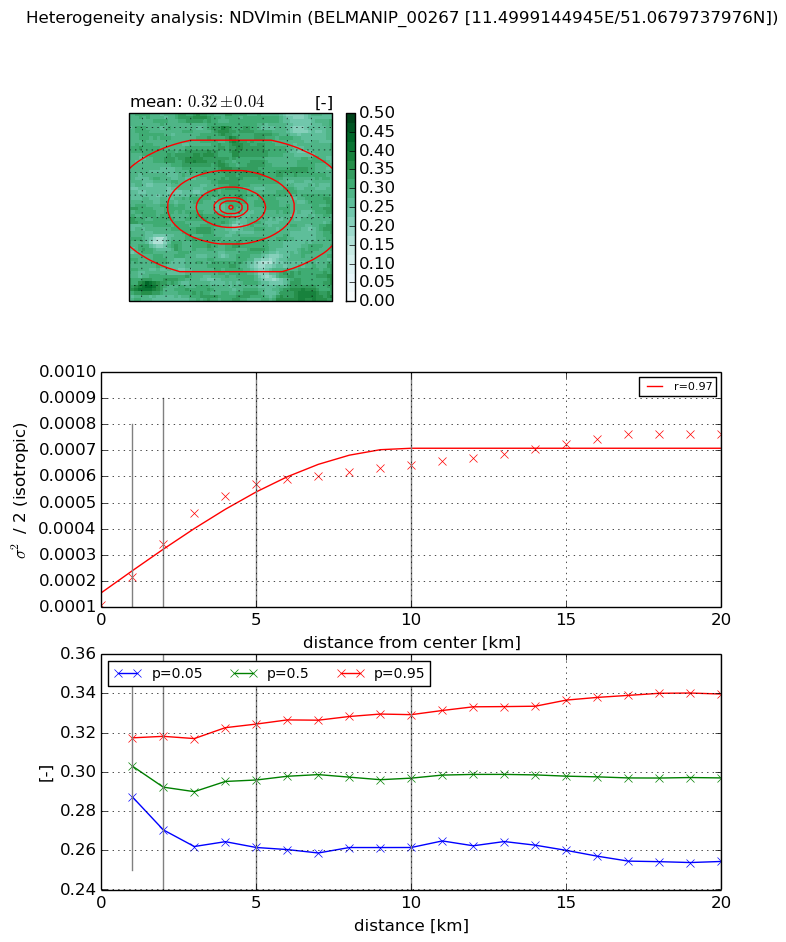
Heterogeneity analysis

The heterogeneity analysis provides information about the spatial and temporal heterogeneity of the site.

Topography


Roman et al. (2009) index


St

5.29627313408

Rcv

0.385991002412

Rse

0.0

Rst

0.0651203984209

Rsv

0.115324642787


Height range @ 1km [m]

39

Height range @ 2km [m]

65

Height range @ 5km [m]

96

Height range @ 10km [m]

-999

Height range @ 20km [m]

-999


Variance slope @ 1 km

254

Variance slope @ 2 km

267

Variance slope @ 5 km

162

Variance slope @ 10 km

-999

Variance slope @ 20 km

-999


NDVI (max. NDVI composite)


Roman et al. (2009) index


St

2.92403870776

Rcv

0.499679121669

Rse

0.0

Rst

-0.0894861914345

Rsv

0.436812897114


NDVI range @ 1km [-]

0.01

NDVI range @ 2km [-]

0.04

NDVI range @ 5km [-]

0.06

NDVI range @ 10km [-]

0.07

NDVI range @ 20km [-]

0.09


Variance slope @ 1 km

0.000147681094104

Variance slope @ 2 km

0.00016444933655

Variance slope @ 5 km

0.000141115642626

Variance slope @ 10 km

7.49667231388e-05

Variance slope @ 20 km

3.15870395686e-05


NDVI (min. NDVI composite)I


Roman et al. (2009) index


St

2.84920811869

Rcv

0.127067869405

Rse

0.0

Rst

-0.179610090466

Rsv

0.746246177302


NDVI range @ 1km [-]

0.03

NDVI range @ 2km [-]

0.05

NDVI range @ 5km [-]

0.06

NDVI range @ 10km [-]

0.07

NDVI range @ 20km [-]

0.09


NDVI slope @ 1 km

0.000105246313699

NDVI slope @ 2 km

0.000116883756347

NDVI slope @ 5 km

9.61636894735e-05

NDVI slope @ 10 km

5.01993760184e-05

NDVI slope @ 20 km

2.58275977326e-05


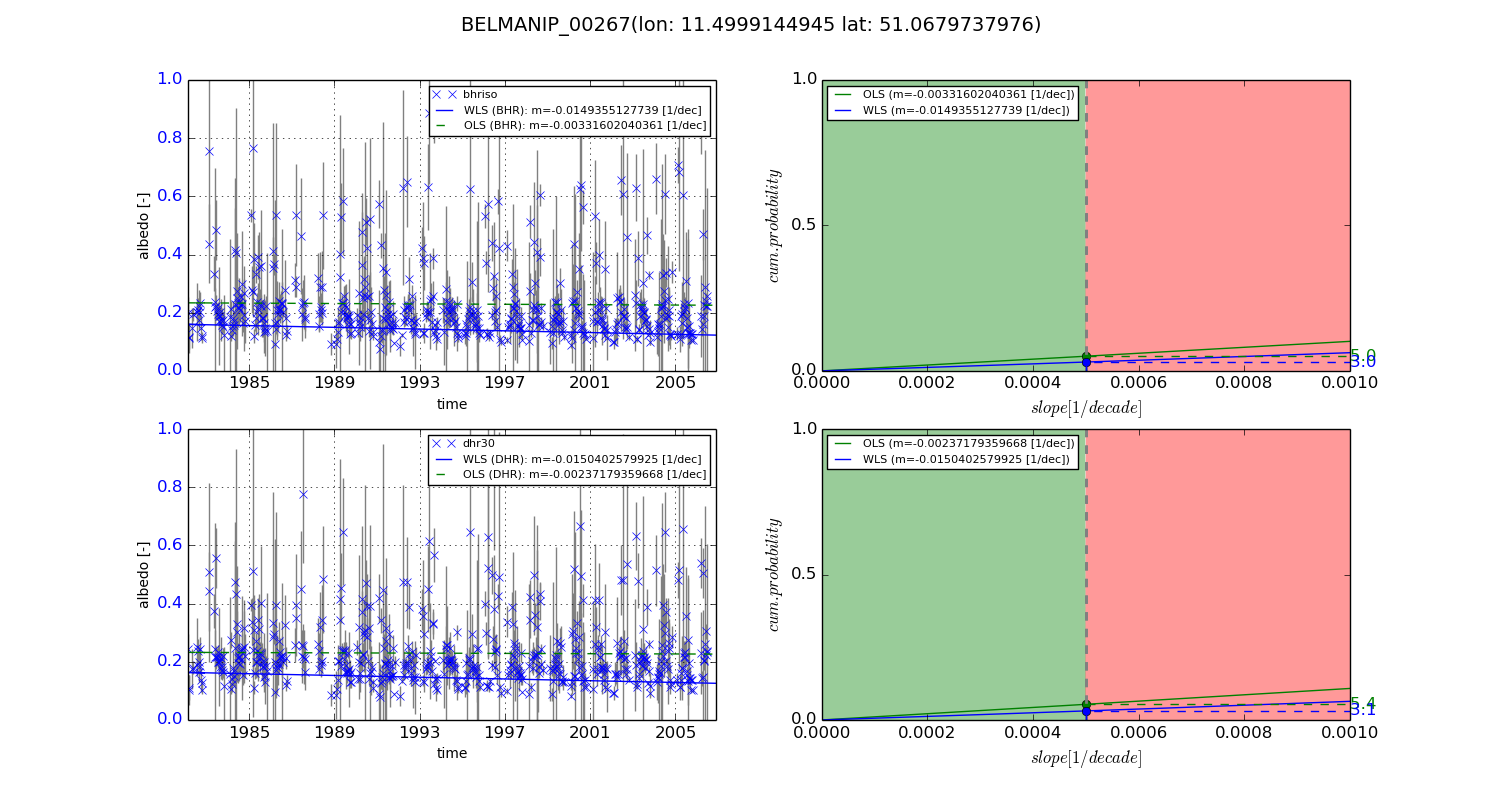
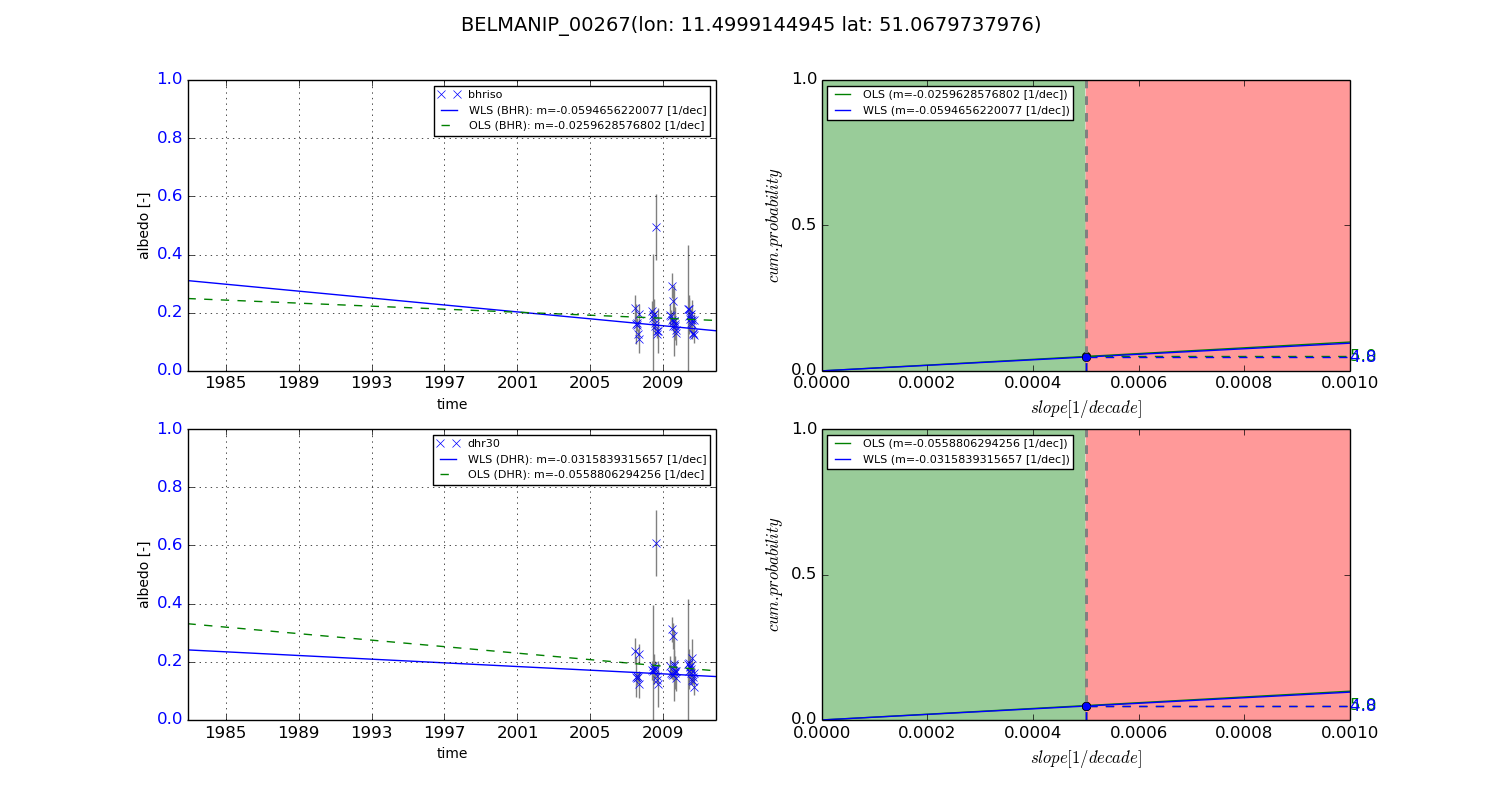
Temporal stability analysis

+000 deg (BHR)


BHR statistics

Temporal stability [1/decade]:


abs

rel


Weighted least square:

-0.0149355127739


Ordinary least square:

-0.00331602040361


Probabilities that GCOS criteria is met:

Weighted least square:

3.0 %

Ordinary least square:

5.0 %


DHR statistics

Temporal stability [1/decade]:


abs

rel


Weighted least square:

-0.0150402579925


Ordinary least square:

-0.00237179359668


Probabilities that GCOS criteria is met:

Weighted least square:

3.1 %

Ordinary least square:

5.4 %


+057/+063 deg (BHR)


BHR statistics

Temporal stability [1/decade]:


abs

rel


Weighted least square:

-0.0594656220077


Ordinary least square:

-0.0259628576802


Probabilities that GCOS criteria is met:

Weighted least square:

4.8 %

Ordinary least square:

5.0 %


DHR statistics

Temporal stability [1/decade]:


abs

rel


Weighted least square:

-0.0315839315657


Ordinary least square:

-0.0558806294256


Probabilities that GCOS criteria is met:

Weighted least square:

4.8 %

Ordinary least square:

5.0 %


Temporal anomaly analyis

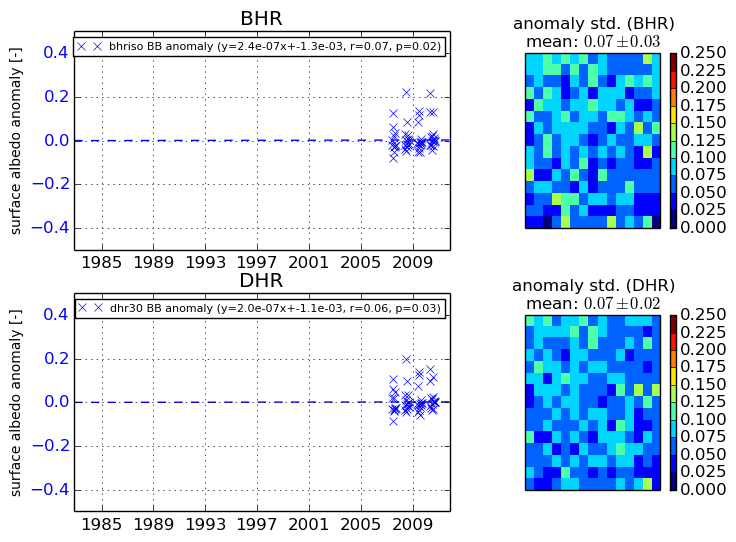
The variance of the temporal anomalies provides an additional measure about the stability of the signal AFTER removal of the mean seasonal cylce.
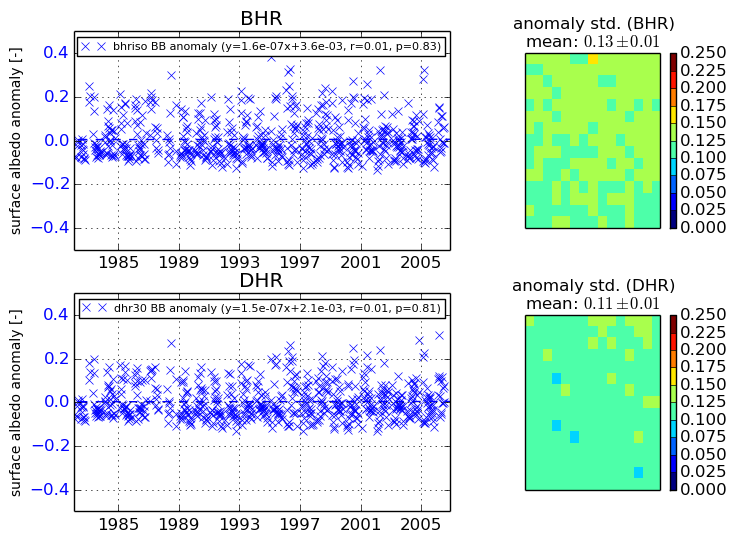
+000 deg


+057/+063 deg