BELMANIP_00268


Location

lon / lat [deg]: 25.6144 / 50.5818

Source network: BELMANIP


Geostationary surface albedo (GSA) data


“+000”


“+057/+063”


Landcover information (based on ESA CCI landcover data)


Landcover fractions @ 2km distance


Landcover fractions @ 20 km distance


Legend


Distance to open water bodies [km]:

4.81

Distance to urban areas [km]:

7.11


Radius: 1 km

Number of landcover classes:

1

Dominant landcover type:

10: cropland, rainfed

Fraction of dominant landcover type [%]:

100.0


Radius: 2 km

Number of landcover classes:

1

Dominant landcover type:

10: cropland, rainfed

Fraction of dominant landcover type [%]:

98.0


Radius: 5 km

Number of landcover classes:

3

Dominant landcover type:

10: cropland, rainfed

Fraction of dominant landcover type [%]:

88.0


Radius: 10 km

Number of landcover classes:

4

Dominant landcover type:

10: cropland, rainfed

Fraction of dominant landcover type [%]:

86.0


Radius: 20 km

Number of landcover classes:

4

Dominant landcover type:

10: cropland, rainfed

Fraction of dominant landcover type [%]:

88.0


Disturbances


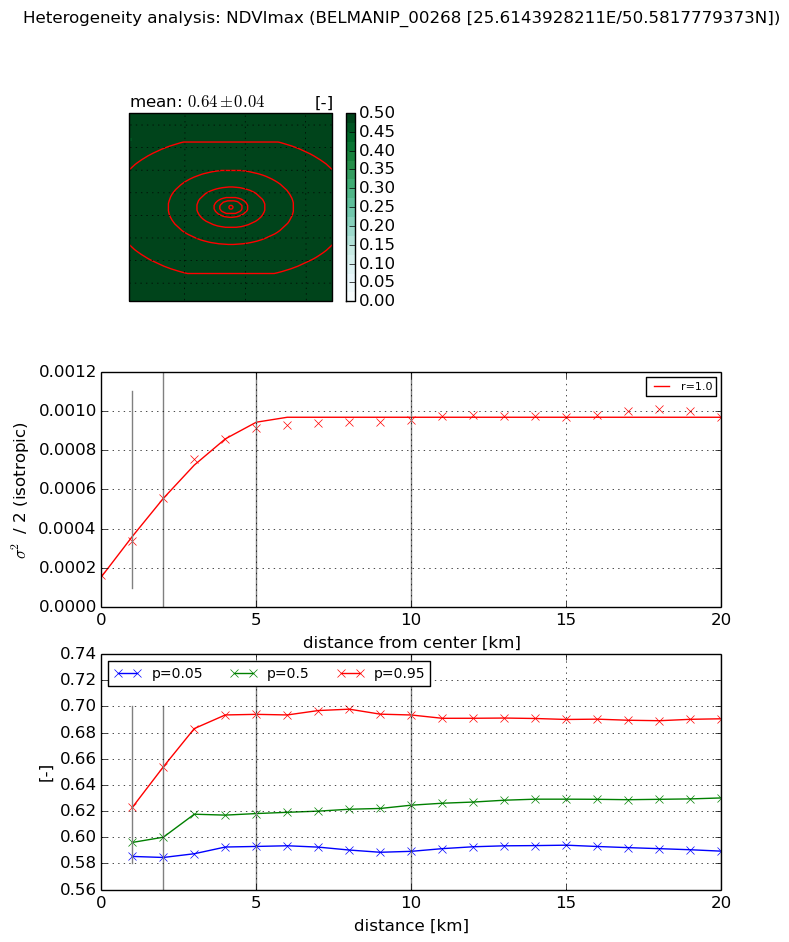
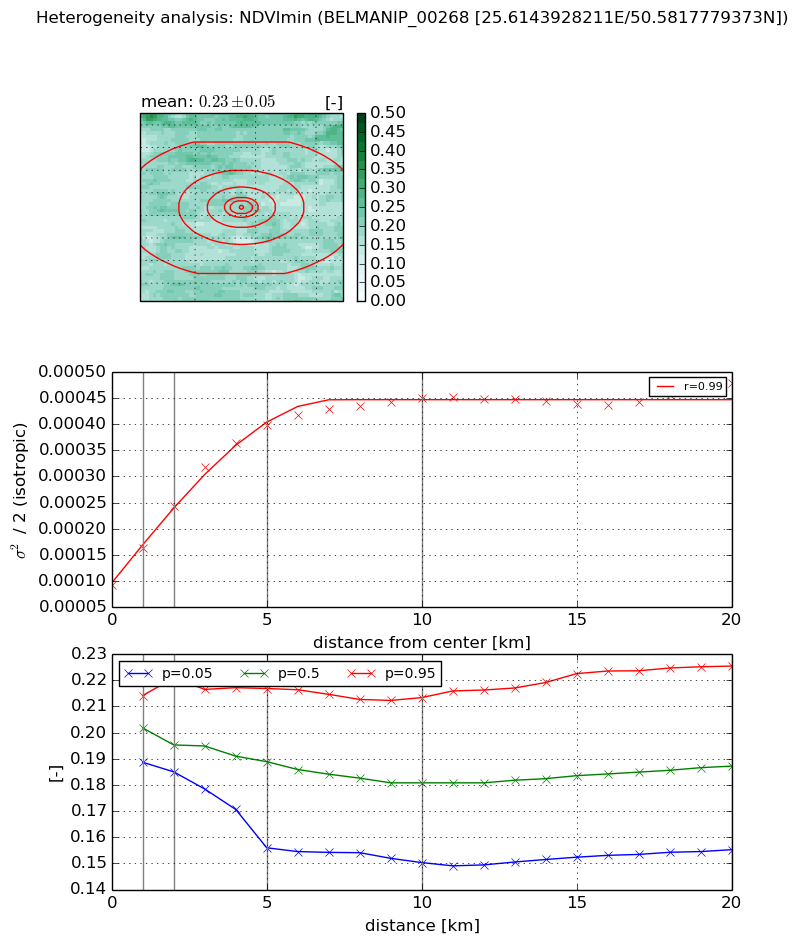
Heterogeneity analysis

The heterogeneity analysis provides information about the spatial and temporal heterogeneity of the site.

Topography


Roman et al. (2009) index


St

8.57501505305e-14

Rcv

0.329117672583

Rse

0.0

Rst

-0.0338897008741

Rsv

3.49853613252e+13


Height range @ 1km [m]

25

Height range @ 2km [m]

32

Height range @ 5km [m]

58

Height range @ 10km [m]

-999

Height range @ 20km [m]

-999


Variance slope @ 1 km

96

Variance slope @ 2 km

95

Variance slope @ 5 km

58

Variance slope @ 10 km

-999

Variance slope @ 20 km

-999


NDVI (max. NDVI composite)


Roman et al. (2009) index


St

16.182513552

Rcv

0.138752439837

Rse

0.0

Rst

0.00409369427984

Rsv

0.042539157875


NDVI range @ 1km [-]

0.04

NDVI range @ 2km [-]

0.07

NDVI range @ 5km [-]

0.1

NDVI range @ 10km [-]

0.1

NDVI range @ 20km [-]

0.1


Variance slope @ 1 km

0.00017138748996

Variance slope @ 2 km

0.000195821363266

Variance slope @ 5 km

0.000157414064909

Variance slope @ 10 km

7.26208358951e-05

Variance slope @ 20 km

2.70132005056e-05


NDVI (min. NDVI composite)I


Roman et al. (2009) index


St

1.9769213115

Rcv

0.52282520717

Rse

0.0

Rst

-0.270953404603

Rsv

0.72373247101


NDVI range @ 1km [-]

0.03

NDVI range @ 2km [-]

0.04

NDVI range @ 5km [-]

0.06

NDVI range @ 10km [-]

0.06

NDVI range @ 20km [-]

0.07


NDVI slope @ 1 km

6.98006544885e-05

NDVI slope @ 2 km

7.54501806491e-05

NDVI slope @ 5 km

6.2990779951e-05

NDVI slope @ 10 km

3.40503550206e-05

NDVI slope @ 20 km

1.2954548361e-05


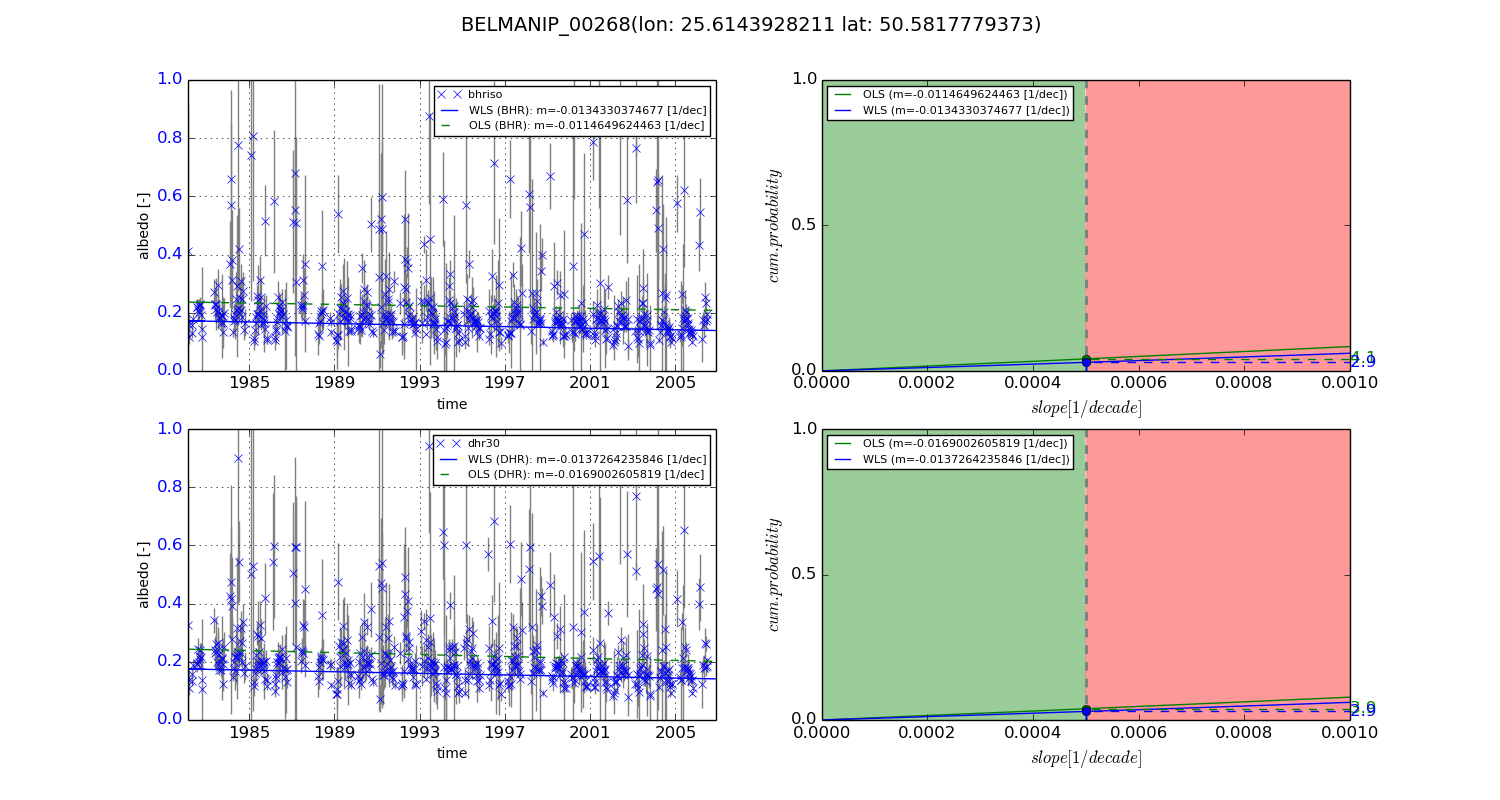
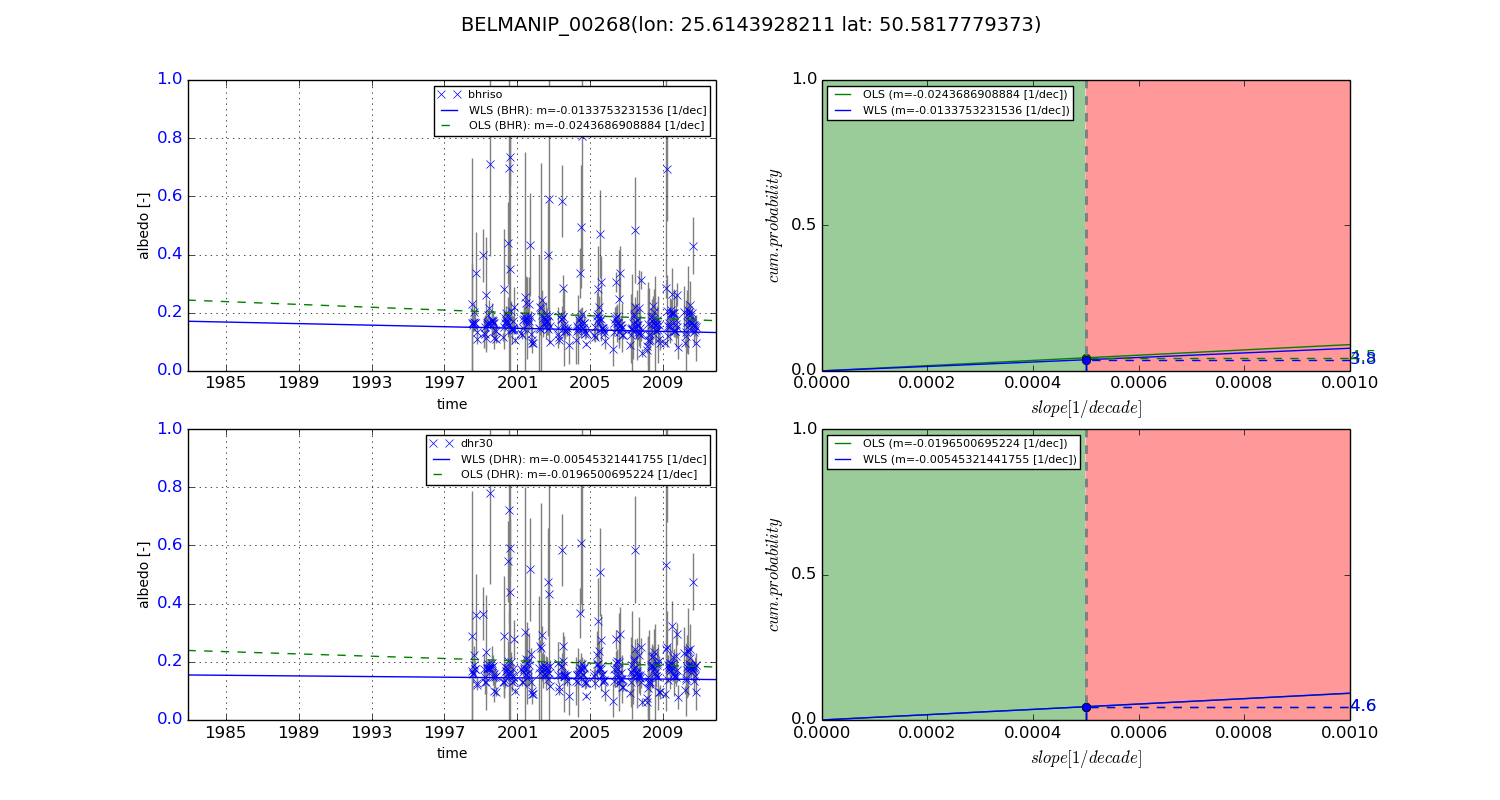
Temporal stability analysis

+000 deg (BHR)


BHR statistics

Temporal stability [1/decade]:


abs

rel


Weighted least square:

-0.0134330374677


Ordinary least square:

-0.0114649624463


Probabilities that GCOS criteria is met:

Weighted least square:

2.9 %

Ordinary least square:

4.1 %


DHR statistics

Temporal stability [1/decade]:


abs

rel


Weighted least square:

-0.0137264235846


Ordinary least square:

-0.0169002605819


Probabilities that GCOS criteria is met:

Weighted least square:

2.9 %

Ordinary least square:

3.9 %


+057/+063 deg (BHR)


BHR statistics

Temporal stability [1/decade]:


abs

rel


Weighted least square:

-0.0133753231536


Ordinary least square:

-0.0243686908884


Probabilities that GCOS criteria is met:

Weighted least square:

3.8 %

Ordinary least square:

4.5 %


DHR statistics

Temporal stability [1/decade]:


abs

rel


Weighted least square:

-0.00545321441755


Ordinary least square:

-0.0196500695224


Probabilities that GCOS criteria is met:

Weighted least square:

4.6 %

Ordinary least square:

4.6 %


Temporal anomaly analyis

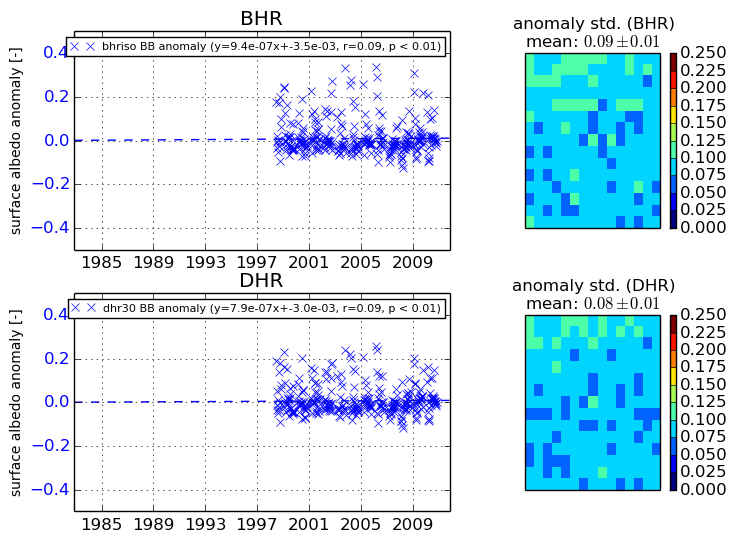
The variance of the temporal anomalies provides an additional measure about the stability of the signal AFTER removal of the mean seasonal cylce.
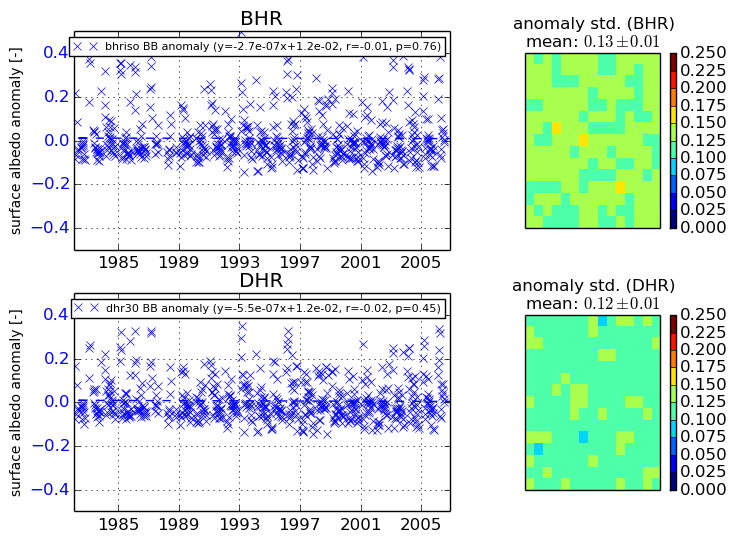
+000 deg


+057/+063 deg