BELMANIP_00269


Location

lon / lat [deg]: 30.615 / 56.282

Source network: BELMANIP


Geostationary surface albedo (GSA) data


“+000”


“+057/+063”


Landcover information (based on ESA CCI landcover data)


Landcover fractions @ 2km distance


Landcover fractions @ 20 km distance


Legend


Distance to open water bodies [km]:

2.23

Distance to urban areas [km]:

5.17


Radius: 1 km

Number of landcover classes:

5

Dominant landcover type:

10: cropland, rainfed

Fraction of dominant landcover type [%]:

67.0


Radius: 2 km

Number of landcover classes:

7

Dominant landcover type:

10: cropland, rainfed

Fraction of dominant landcover type [%]:

54.0


Radius: 5 km

Number of landcover classes:

7

Dominant landcover type:

10: cropland, rainfed

Fraction of dominant landcover type [%]:

52.0


Radius: 10 km

Number of landcover classes:

10

Dominant landcover type:

10: cropland, rainfed

Fraction of dominant landcover type [%]:

41.0


Radius: 20 km

Number of landcover classes:

9

Dominant landcover type:

60: Tree cover, broadleaved, decidous

Fraction of dominant landcover type [%]:

47.0


Disturbances


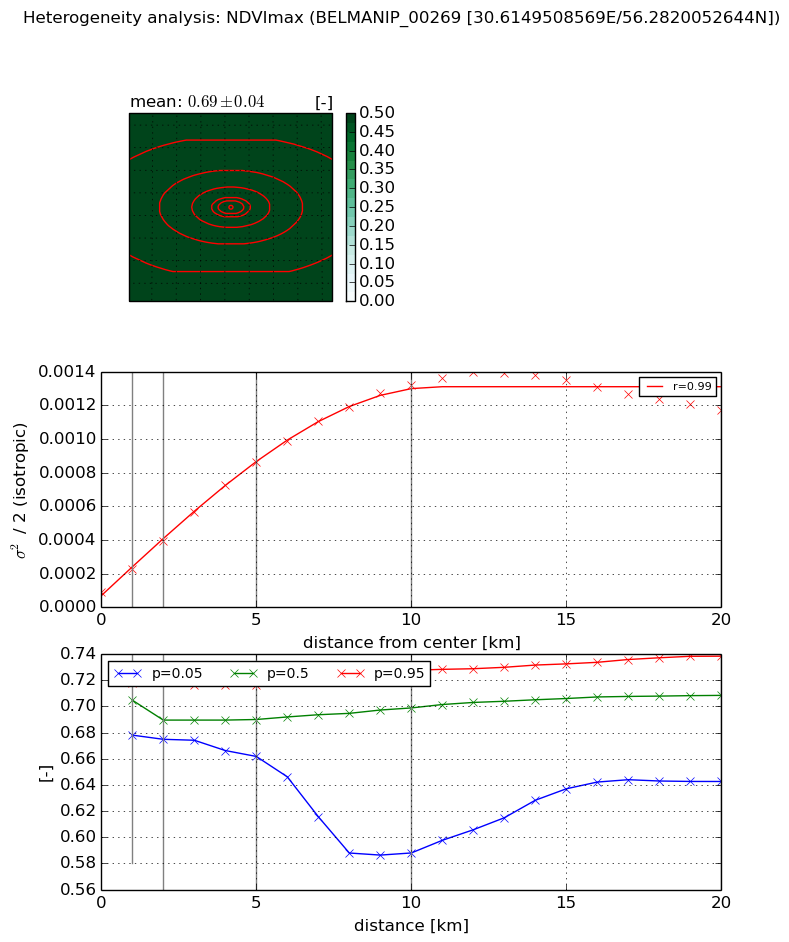
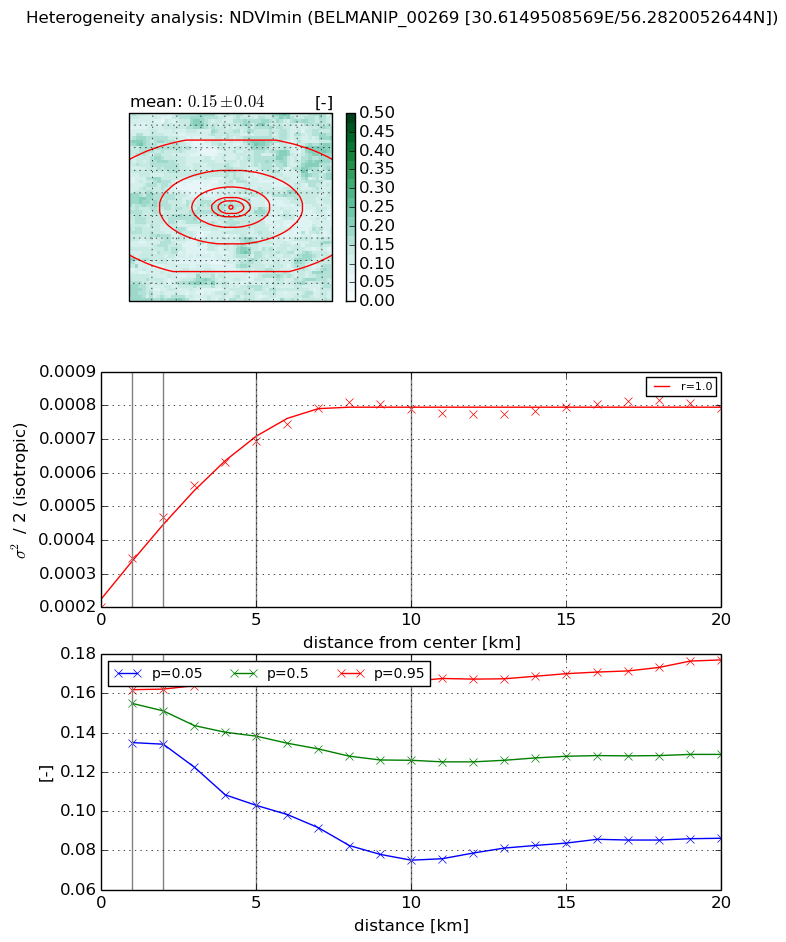
Heterogeneity analysis

The heterogeneity analysis provides information about the spatial and temporal heterogeneity of the site.

Topography


Roman et al. (2009) index


St

1.42409755224

Rcv

0.395131013879

Rse

0.0

Rst

-0.140982218566

Rsv

1.57048402648


Height range @ 1km [m]

19

Height range @ 2km [m]

24

Height range @ 5km [m]

33

Height range @ 10km [m]

-999

Height range @ 20km [m]

-999


Variance slope @ 1 km

46

Variance slope @ 2 km

33

Variance slope @ 5 km

23

Variance slope @ 10 km

-999

Variance slope @ 20 km

-999


NDVI (max. NDVI composite)


Roman et al. (2009) index


St

2.12073870368

Rcv

0.182207424908

Rse

0.0

Rst

-0.232394226212

Rsv

-0.999999777525


NDVI range @ 1km [-]

0.04

NDVI range @ 2km [-]

0.04

NDVI range @ 5km [-]

0.05

NDVI range @ 10km [-]

0.14

NDVI range @ 20km [-]

0.1


Variance slope @ 1 km

0.000135741622754

Variance slope @ 2 km

0.000150191027801

Variance slope @ 5 km

0.000158369223816

Variance slope @ 10 km

0.000127961105022

Variance slope @ 20 km

5.22198179848e-05


NDVI (min. NDVI composite)I


Roman et al. (2009) index


St

2.54094178849e-07

Rcv

0.616232030559

Rse

0.0

Rst

-0.0869976532944

Rsv

11806645.2167


NDVI range @ 1km [-]

0.03

NDVI range @ 2km [-]

0.03

NDVI range @ 5km [-]

0.07

NDVI range @ 10km [-]

0.09

NDVI range @ 20km [-]

0.09


NDVI slope @ 1 km

0.000147447521134

NDVI slope @ 2 km

0.000134634907979

NDVI slope @ 5 km

9.73343741318e-05

NDVI slope @ 10 km

5.78666268968e-05

NDVI slope @ 20 km

2.098296925e-05


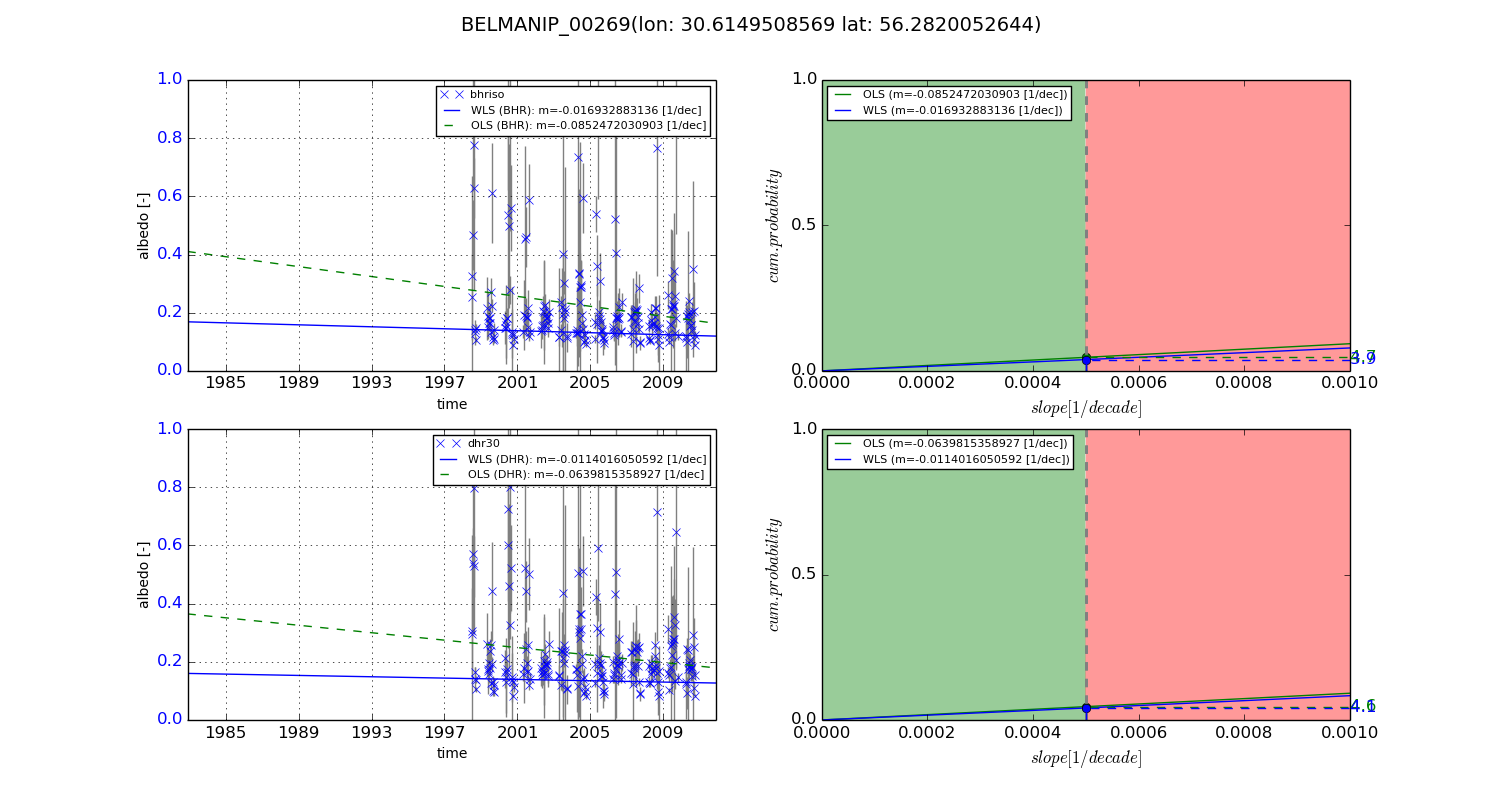
Temporal stability analysis

+000 deg (BHR)


BHR statistics

Temporal stability [1/decade]:


abs

rel


Weighted least square:

-99999.0


Ordinary least square:

-99999.0


Probabilities that GCOS criteria is met:

Weighted least square:

-99999.0 %

Ordinary least square:

-99999.0 %


DHR statistics

Temporal stability [1/decade]:


abs

rel


Weighted least square:

-99999.0


Ordinary least square:

-99999.0


Probabilities that GCOS criteria is met:

Weighted least square:

-99999.0 %

Ordinary least square:

-99999.0 %


+057/+063 deg (BHR)


BHR statistics

Temporal stability [1/decade]:


abs

rel


Weighted least square:

-0.016932883136


Ordinary least square:

-0.0852472030903


Probabilities that GCOS criteria is met:

Weighted least square:

3.9 %

Ordinary least square:

4.7 %


DHR statistics

Temporal stability [1/decade]:


abs

rel


Weighted least square:

-0.0114016050592


Ordinary least square:

-0.0639815358927


Probabilities that GCOS criteria is met:

Weighted least square:

4.1 %

Ordinary least square:

4.6 %


Temporal anomaly analyis

The variance of the temporal anomalies provides an additional measure about the stability of the signal AFTER removal of the mean seasonal cylce.
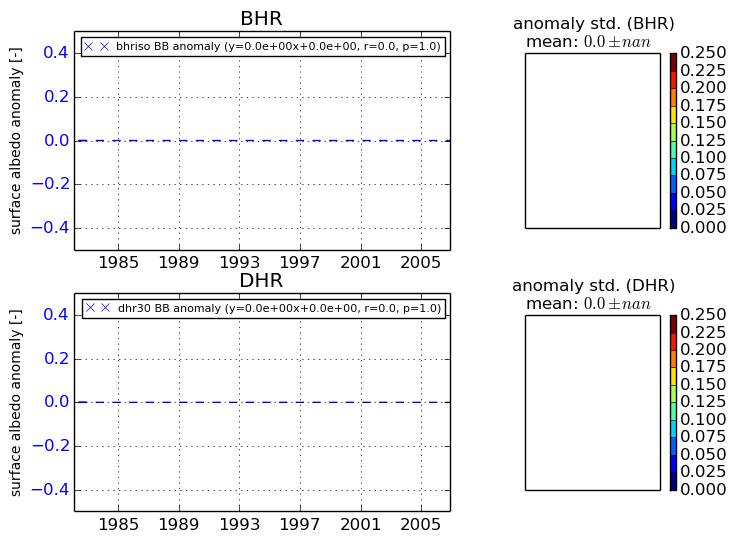
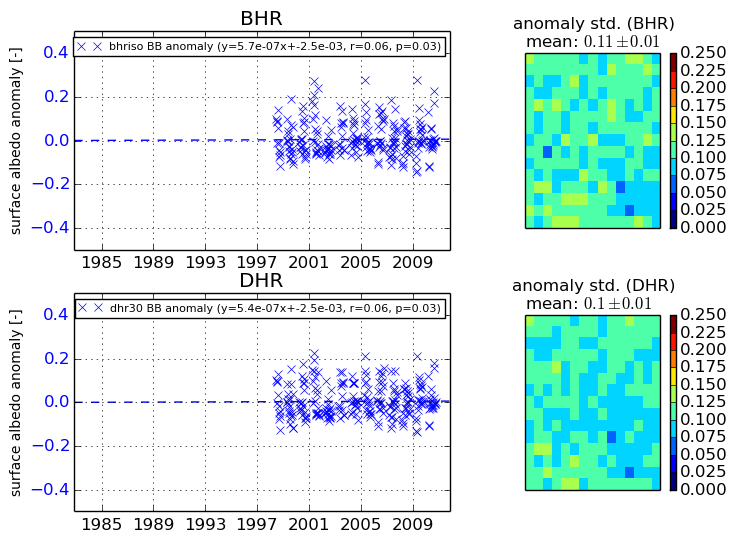
+000 deg


+057/+063 deg