BELMANIP_00270


Location

lon / lat [deg]: 53.2788 / 53.281

Source network: BELMANIP


Geostationary surface albedo (GSA) data


“+000”


“+057/+063”


Landcover information (based on ESA CCI landcover data)


Landcover fractions @ 2km distance


Landcover fractions @ 20 km distance


Legend


Distance to open water bodies [km]:

13.25

Distance to urban areas [km]:

27.28


Radius: 1 km

Number of landcover classes:

1

Dominant landcover type:

10: cropland, rainfed

Fraction of dominant landcover type [%]:

100.0


Radius: 2 km

Number of landcover classes:

1

Dominant landcover type:

10: cropland, rainfed

Fraction of dominant landcover type [%]:

100.0


Radius: 5 km

Number of landcover classes:

1

Dominant landcover type:

10: cropland, rainfed

Fraction of dominant landcover type [%]:

100.0


Radius: 10 km

Number of landcover classes:

1

Dominant landcover type:

10: cropland, rainfed

Fraction of dominant landcover type [%]:

100.0


Radius: 20 km

Number of landcover classes:

1

Dominant landcover type:

10: cropland, rainfed

Fraction of dominant landcover type [%]:

99.0


Disturbances


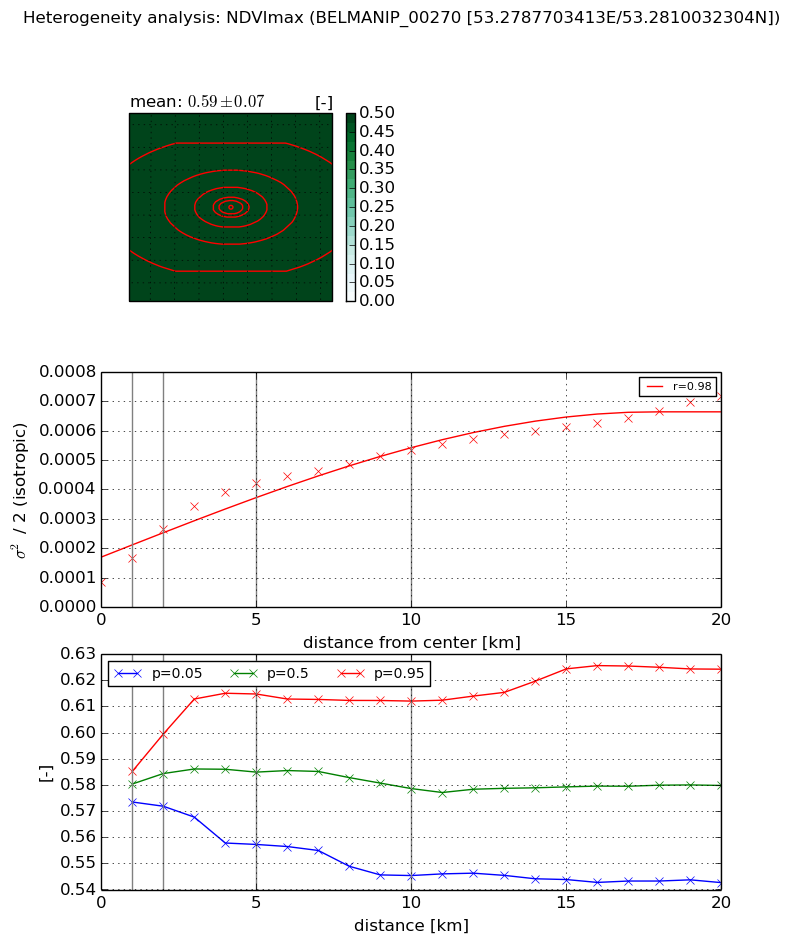
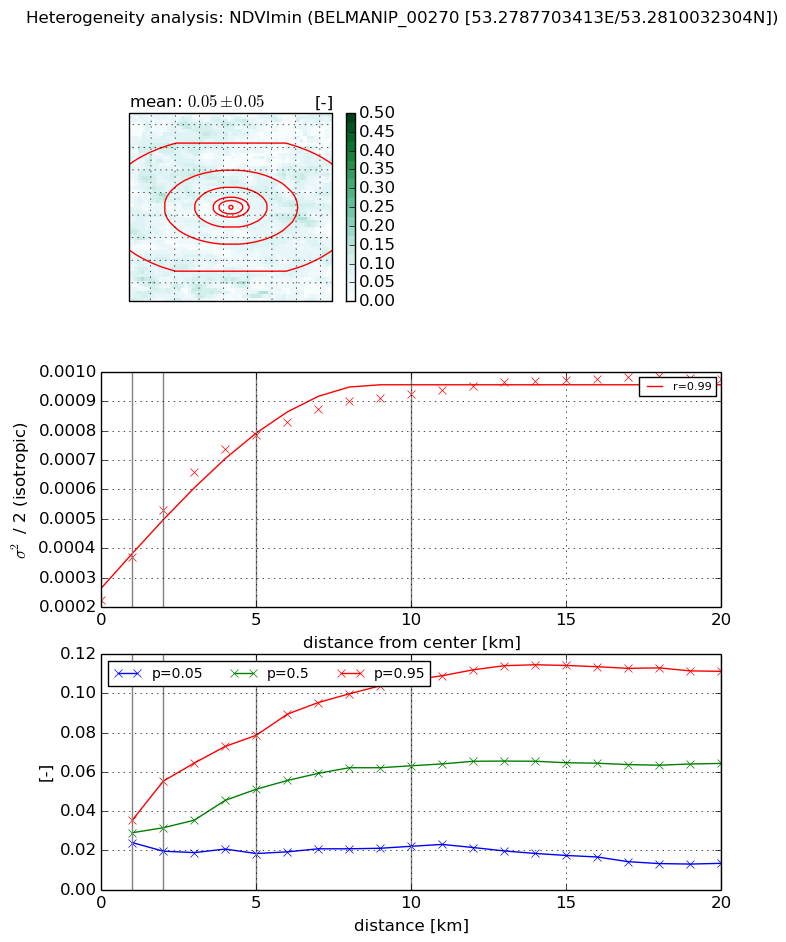
Heterogeneity analysis

The heterogeneity analysis provides information about the spatial and temporal heterogeneity of the site.

Topography


Roman et al. (2009) index


St

3.73900854915e-05

Rcv

0.47329306731

Rse

0.0

Rst

9.83232670837e-08

Rsv

80234.7002979


Height range @ 1km [m]

29

Height range @ 2km [m]

48

Height range @ 5km [m]

104

Height range @ 10km [m]

-999

Height range @ 20km [m]

-999


Variance slope @ 1 km

113

Variance slope @ 2 km

136

Variance slope @ 5 km

182

Variance slope @ 10 km

-999

Variance slope @ 20 km

-999


NDVI (max. NDVI composite)


Roman et al. (2009) index


St

1.33515209694e-08

Rcv

0.33182119678

Rse

0.0

Rst

0.0710613870264

Rsv

224693501.325


NDVI range @ 1km [-]

0.01

NDVI range @ 2km [-]

0.03

NDVI range @ 5km [-]

0.06

NDVI range @ 10km [-]

0.07

NDVI range @ 20km [-]

0.08


Variance slope @ 1 km

8.05599832475e-05

Variance slope @ 2 km

8.9699940856e-05

Variance slope @ 5 km

6.96426130428e-05

Variance slope @ 10 km

4.18337819229e-05

Variance slope @ 20 km

2.59994312895e-05


NDVI (min. NDVI composite)I


Roman et al. (2009) index


St

2.51011607845

Rcv

-0.0424531747757

Rse

0.0

Rst

-0.152747431697

Rsv

-0.999963245013


NDVI range @ 1km [-]

0.01

NDVI range @ 2km [-]

0.04

NDVI range @ 5km [-]

0.06

NDVI range @ 10km [-]

0.08

NDVI range @ 20km [-]

0.1


NDVI slope @ 1 km

0.00014684426512

NDVI slope @ 2 km

0.000154290788152

NDVI slope @ 5 km

0.000115856038282

NDVI slope @ 10 km

6.64149208547e-05

NDVI slope @ 20 km

2.88956388101e-05


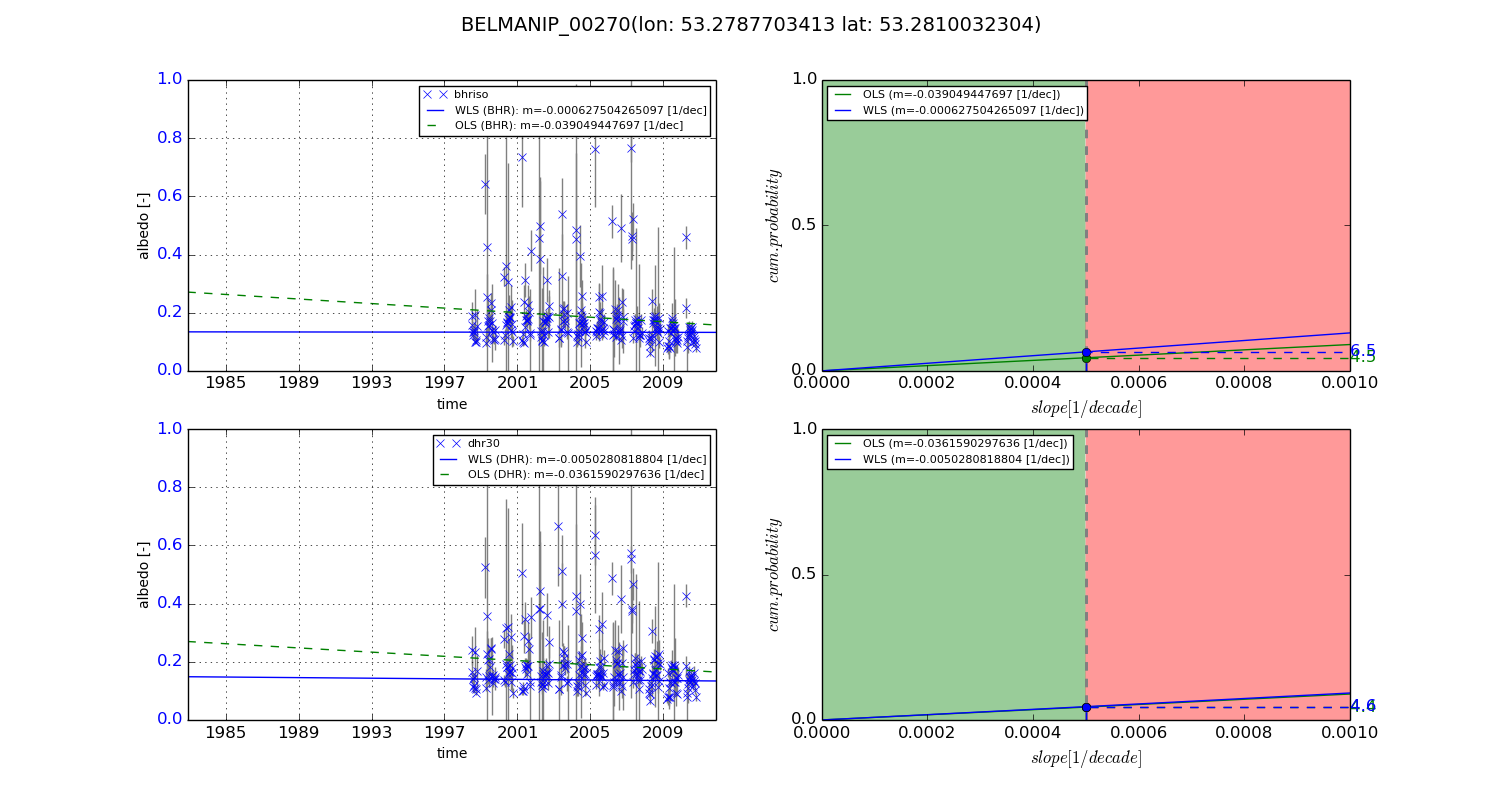
Temporal stability analysis

+000 deg (BHR)


BHR statistics

Temporal stability [1/decade]:


abs

rel


Weighted least square:

-99999.0


Ordinary least square:

-99999.0


Probabilities that GCOS criteria is met:

Weighted least square:

-99999.0 %

Ordinary least square:

-99999.0 %


DHR statistics

Temporal stability [1/decade]:


abs

rel


Weighted least square:

-99999.0


Ordinary least square:

-99999.0


Probabilities that GCOS criteria is met:

Weighted least square:

-99999.0 %

Ordinary least square:

-99999.0 %


+057/+063 deg (BHR)


BHR statistics

Temporal stability [1/decade]:


abs

rel


Weighted least square:

-0.000627504265097


Ordinary least square:

-0.039049447697


Probabilities that GCOS criteria is met:

Weighted least square:

6.5 %

Ordinary least square:

4.5 %


DHR statistics

Temporal stability [1/decade]:


abs

rel


Weighted least square:

-0.0050280818804


Ordinary least square:

-0.0361590297636


Probabilities that GCOS criteria is met:

Weighted least square:

4.6 %

Ordinary least square:

4.4 %


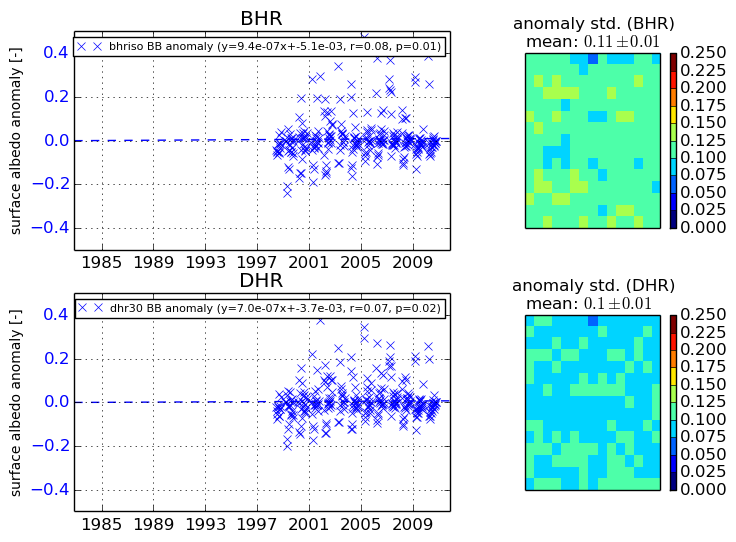
Temporal anomaly analyis

The variance of the temporal anomalies provides an additional measure about the stability of the signal AFTER removal of the mean seasonal cylce.
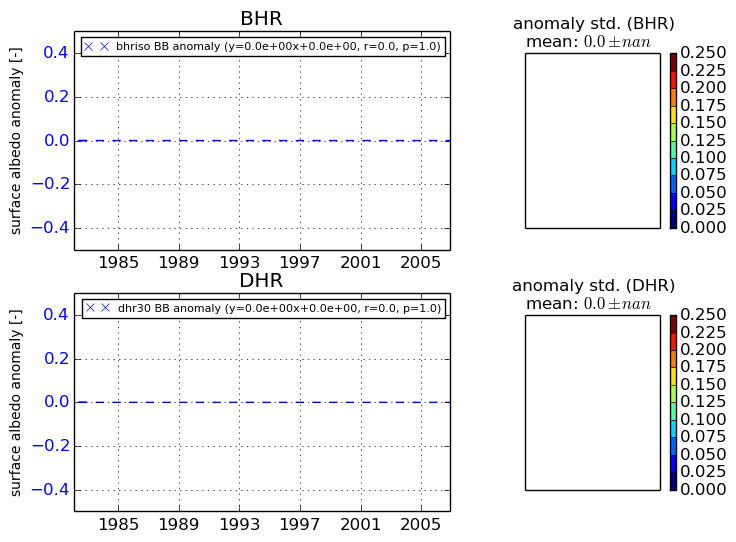
+000 deg


+057/+063 deg