BELMANIP_00274


Location

lon / lat [deg]: 26.7436 / 63.8846

Source network: BELMANIP


Geostationary surface albedo (GSA) data


“+000”


“+057/+063”


Landcover information (based on ESA CCI landcover data)


Landcover fractions @ 2km distance


Landcover fractions @ 20 km distance


Legend


Distance to open water bodies [km]:

6.64

Distance to urban areas [km]:

12.0


Radius: 1 km

Number of landcover classes:

3

Dominant landcover type:

70: Tree cover, needleleaved, evergreen, closed to open (>15%)

Fraction of dominant landcover type [%]:

84.0


Radius: 2 km

Number of landcover classes:

4

Dominant landcover type:

70: Tree cover, needleleaved, evergreen, closed to open (>15%)

Fraction of dominant landcover type [%]:

68.0


Radius: 5 km

Number of landcover classes:

6

Dominant landcover type:

70: Tree cover, needleleaved, evergreen, closed to open (>15%)

Fraction of dominant landcover type [%]:

66.0


Radius: 10 km

Number of landcover classes:

7

Dominant landcover type:

70: Tree cover, needleleaved, evergreen, closed to open (>15%)

Fraction of dominant landcover type [%]:

60.0


Radius: 20 km

Number of landcover classes:

7

Dominant landcover type:

70: Tree cover, needleleaved, evergreen, closed to open (>15%)

Fraction of dominant landcover type [%]:

62.0


Disturbances


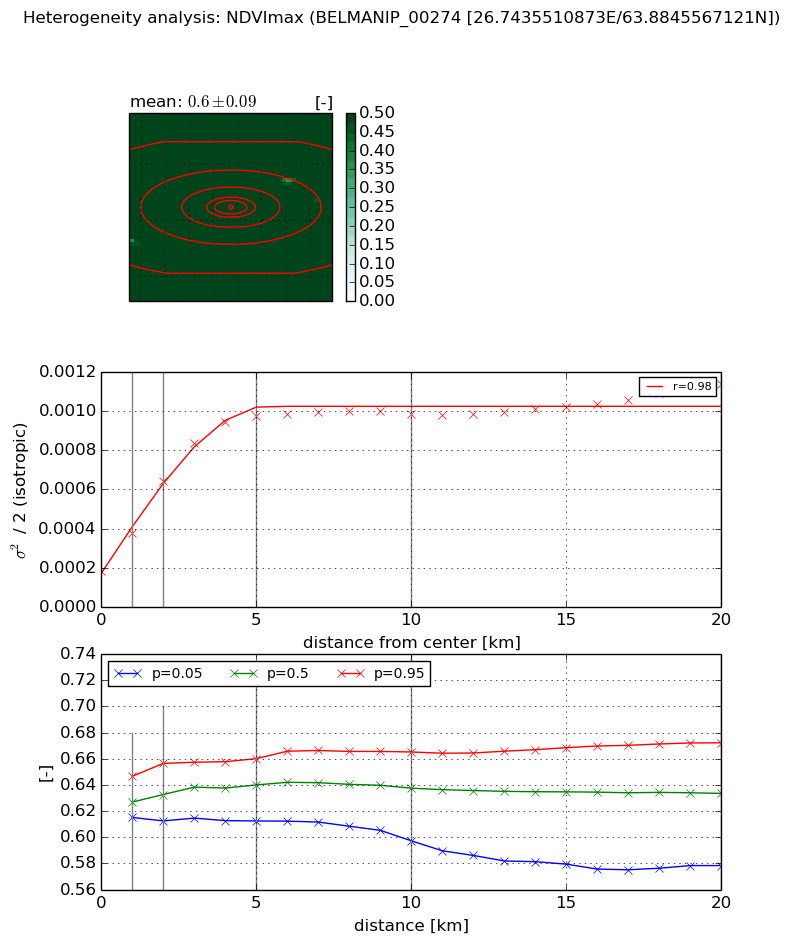
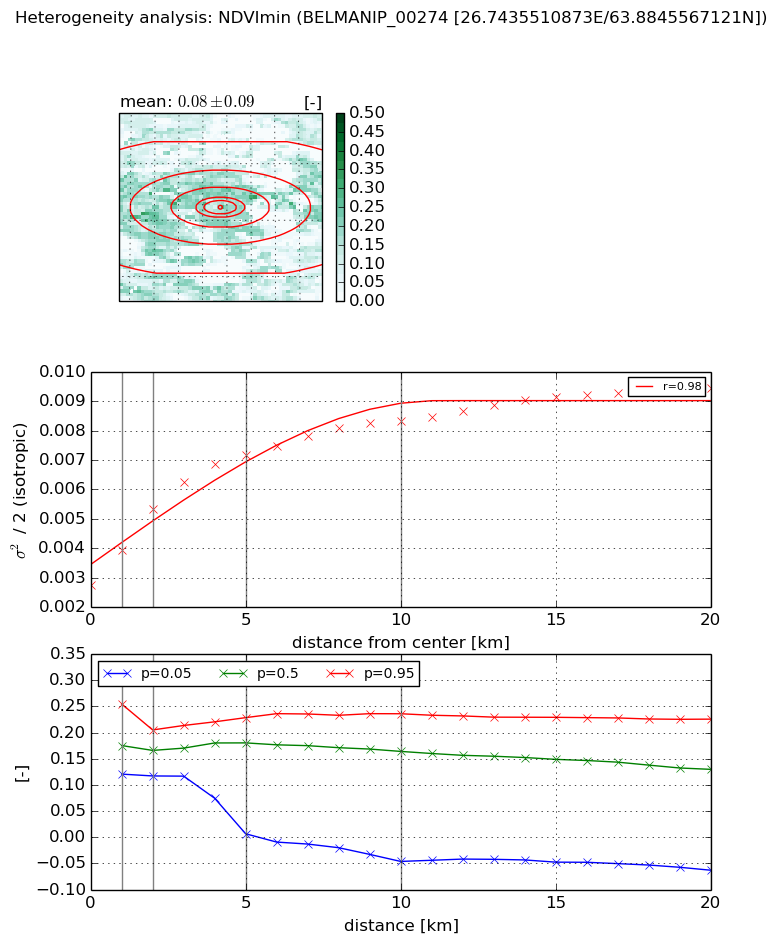
Heterogeneity analysis

The heterogeneity analysis provides information about the spatial and temporal heterogeneity of the site.

Topography


Roman et al. (2009) index


St

1.27291480928

Rcv

0.683860579645

Rse

0.0

Rst

0.182966533643

Rsv

1.48996846967


Height range @ 1km [m]

43

Height range @ 2km [m]

38

Height range @ 5km [m]

64

Height range @ 10km [m]

-999

Height range @ 20km [m]

-999


Variance slope @ 1 km

92

Variance slope @ 2 km

112

Variance slope @ 5 km

120

Variance slope @ 10 km

-999

Variance slope @ 20 km

-999


NDVI (max. NDVI composite)


Roman et al. (2009) index


St

5.22595947375

Rcv

0.0182296976351

Rse

0.0

Rst

-0.144481895027

Rsv

0.411345671859


NDVI range @ 1km [-]

0.03

NDVI range @ 2km [-]

0.04

NDVI range @ 5km [-]

0.05

NDVI range @ 10km [-]

0.07

NDVI range @ 20km [-]

0.09


Variance slope @ 1 km

0.000192503386701

Variance slope @ 2 km

0.000230337391672

Variance slope @ 5 km

0.000166822777327

Variance slope @ 10 km

7.18529411026e-05

Variance slope @ 20 km

2.87748947549e-05


NDVI (min. NDVI composite)I


Roman et al. (2009) index


St

1.29736848235

Rcv

0.964227022216

Rse

0.0

Rst

-0.348146101926

Rsv

-0.999999991754


NDVI range @ 1km [-]

0.13

NDVI range @ 2km [-]

0.09

NDVI range @ 5km [-]

0.22

NDVI range @ 10km [-]

0.28

NDVI range @ 20km [-]

0.29


NDVI slope @ 1 km

0.00120866483277

NDVI slope @ 2 km

0.00129963283108

NDVI slope @ 5 km

0.000905747034559

NDVI slope @ 10 km

0.000518641655442

NDVI slope @ 20 km

0.000266173526672


Temporal stability analysis

+000 deg (BHR)


BHR statistics

Temporal stability [1/decade]:


abs

rel


Weighted least square:

-99999.0


Ordinary least square:

-99999.0


Probabilities that GCOS criteria is met:

Weighted least square:

-99999.0 %

Ordinary least square:

-99999.0 %


DHR statistics

Temporal stability [1/decade]:


abs

rel


Weighted least square:

-99999.0


Ordinary least square:

-99999.0


Probabilities that GCOS criteria is met:

Weighted least square:

-99999.0 %

Ordinary least square:

-99999.0 %


+057/+063 deg (BHR)


BHR statistics

Temporal stability [1/decade]:


abs

rel


Weighted least square:

-99999.0


Ordinary least square:

-99999.0


Probabilities that GCOS criteria is met:

Weighted least square:

-99999.0 %

Ordinary least square:

-99999.0 %


DHR statistics

Temporal stability [1/decade]:


abs

rel


Weighted least square:

-99999.0


Ordinary least square:

-99999.0


Probabilities that GCOS criteria is met:

Weighted least square:

-99999.0 %

Ordinary least square:

-99999.0 %


Temporal anomaly analyis

The variance of the temporal anomalies provides an additional measure about the stability of the signal AFTER removal of the mean seasonal cylce.

+000 deg


+057/+063 deg