BELMANIP_00284


Location

lon / lat [deg]: 115.0816 / -26.2009

Source network: BELMANIP


Geostationary surface albedo (GSA) data


“+000”


“+057/+063”


Landcover information (based on ESA CCI landcover data)


Landcover fractions @ 2km distance


Landcover fractions @ 20 km distance


Legend


Distance to open water bodies [km]:

27.84

Distance to urban areas [km]:

none in region


Radius: 1 km

Number of landcover classes:

1

Dominant landcover type:

130: grassland

Fraction of dominant landcover type [%]:

100.0


Radius: 2 km

Number of landcover classes:

1

Dominant landcover type:

130: grassland

Fraction of dominant landcover type [%]:

100.0


Radius: 5 km

Number of landcover classes:

2

Dominant landcover type:

130: grassland

Fraction of dominant landcover type [%]:

90.0


Radius: 10 km

Number of landcover classes:

2

Dominant landcover type:

130: grassland

Fraction of dominant landcover type [%]:

93.0


Radius: 20 km

Number of landcover classes:

2

Dominant landcover type:

130: grassland

Fraction of dominant landcover type [%]:

97.0


Disturbances


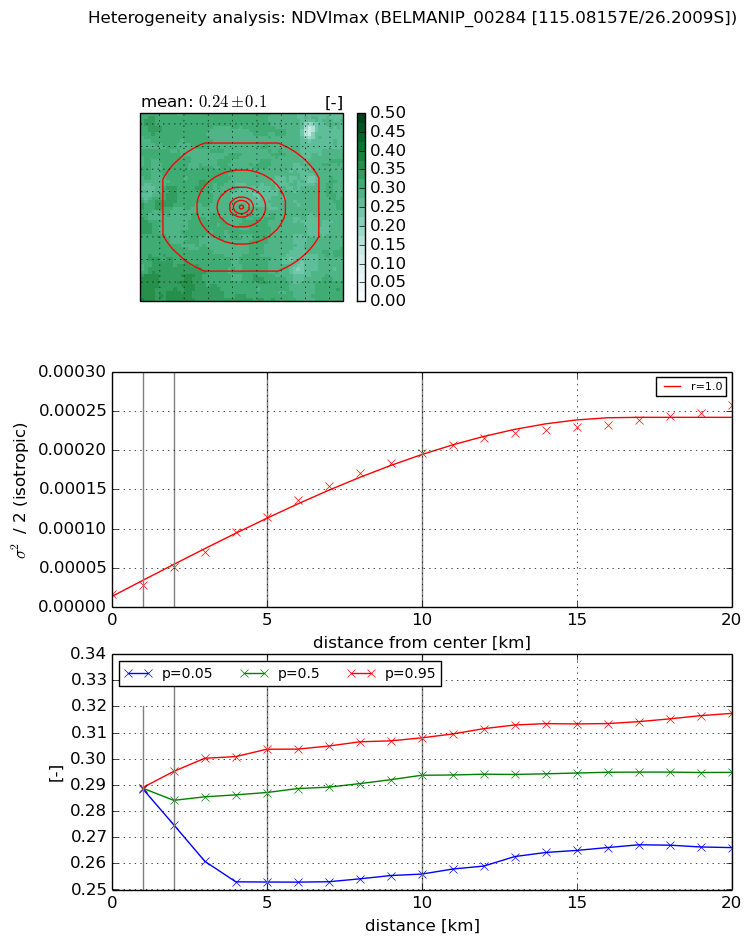
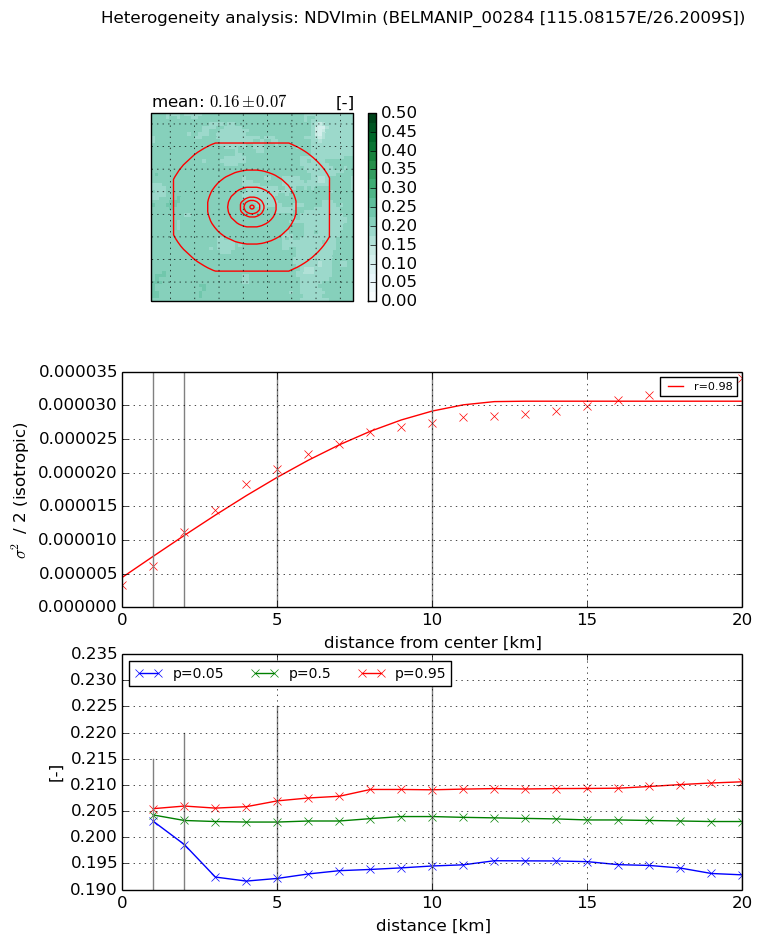
Heterogeneity analysis

The heterogeneity analysis provides information about the spatial and temporal heterogeneity of the site.

Topography


Roman et al. (2009) index


St

2.03051774644

Rcv

0.192771150771

Rse

0.0

Rst

-0.0929646283188

Rsv

1.19171991184


Height range @ 1km [m]

10

Height range @ 2km [m]

16

Height range @ 5km [m]

22

Height range @ 10km [m]

-999

Height range @ 20km [m]

-999


Variance slope @ 1 km

11

Variance slope @ 2 km

13

Variance slope @ 5 km

11

Variance slope @ 10 km

-999

Variance slope @ 20 km

-999


NDVI (max. NDVI composite)


Roman et al. (2009) index


St

0.917822652312

Rcv

0.376112953147

Rse

0.0

Rst

2.00335830451e-08

Rsv

2.89249234228


NDVI range @ 1km [-]

0.0

NDVI range @ 2km [-]

0.02

NDVI range @ 5km [-]

0.05

NDVI range @ 10km [-]

0.05

NDVI range @ 20km [-]

0.05


Variance slope @ 1 km

1.20980903913e-05

Variance slope @ 2 km

1.74534541045e-05

Variance slope @ 5 km

2.03333257417e-05

Variance slope @ 10 km

1.90113526243e-05

Variance slope @ 20 km

1.19226677871e-05


NDVI (min. NDVI composite)I


Roman et al. (2009) index


St

0.000137390651262

Rcv

0.138571252319

Rse

0.0

Rst

0.269511988463

Rsv

21835.1387495


NDVI range @ 1km [-]

0.0

NDVI range @ 2km [-]

0.01

NDVI range @ 5km [-]

0.01

NDVI range @ 10km [-]

0.01

NDVI range @ 20km [-]

0.02


NDVI slope @ 1 km

2.75594177176e-06

NDVI slope @ 2 km

3.90409059425e-06

NDVI slope @ 5 km

3.58864295194e-06

NDVI slope @ 10 km

2.47219336372e-06

NDVI slope @ 20 km

1.30235905844e-06


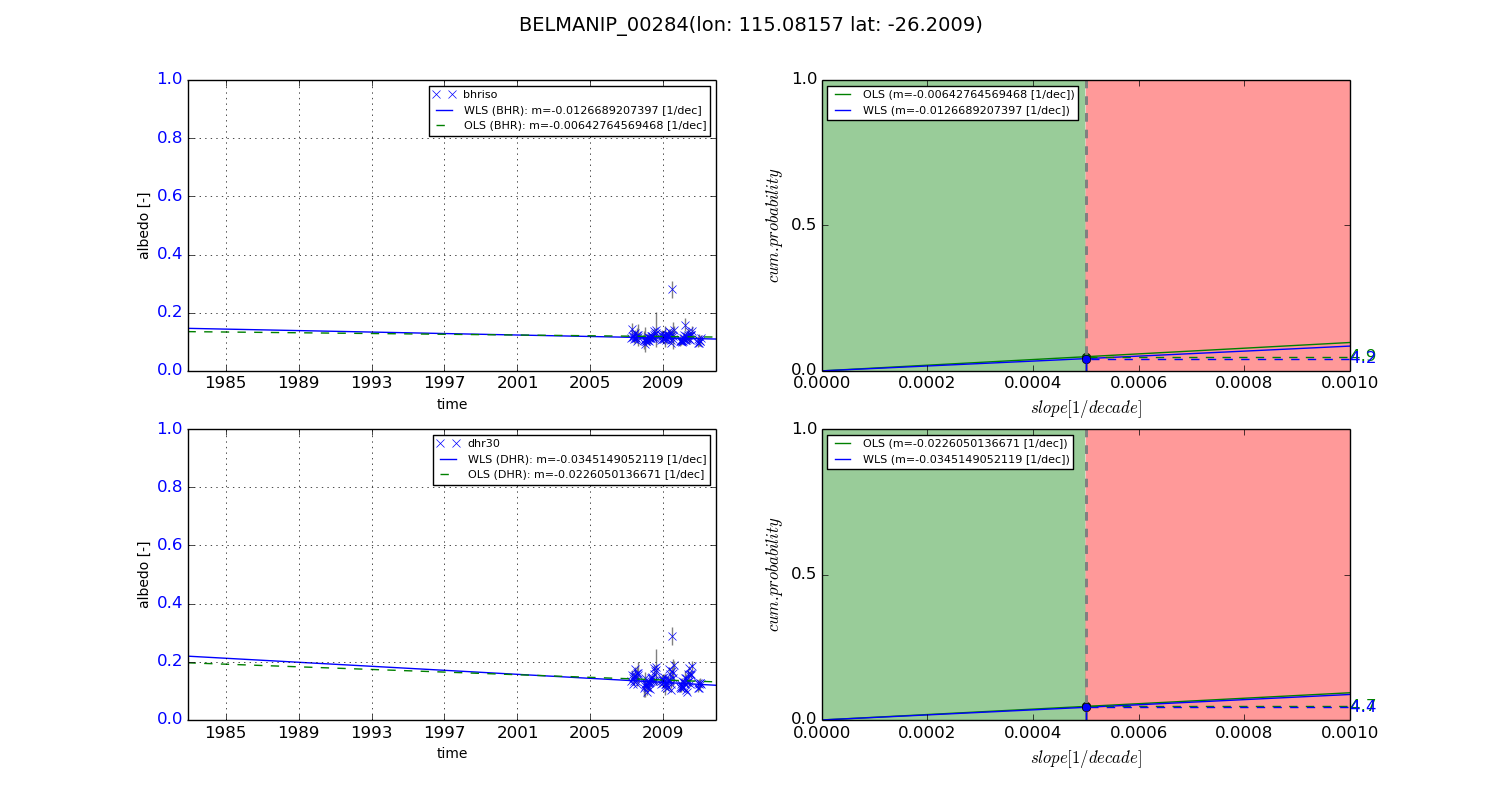
Temporal stability analysis

+000 deg (BHR)


BHR statistics

Temporal stability [1/decade]:


abs

rel


Weighted least square:

None


Ordinary least square:

None


Probabilities that GCOS criteria is met:

Weighted least square:

None %

Ordinary least square:

None %


DHR statistics

Temporal stability [1/decade]:


abs

rel


Weighted least square:

None


Ordinary least square:

None


Probabilities that GCOS criteria is met:

Weighted least square:

None %

Ordinary least square:

None %


+057/+063 deg (BHR)


BHR statistics

Temporal stability [1/decade]:


abs

rel


Weighted least square:

-0.0126689207397


Ordinary least square:

-0.00642764569468


Probabilities that GCOS criteria is met:

Weighted least square:

4.2 %

Ordinary least square:

4.9 %


DHR statistics

Temporal stability [1/decade]:


abs

rel


Weighted least square:

-0.0345149052119


Ordinary least square:

-0.0226050136671


Probabilities that GCOS criteria is met:

Weighted least square:

4.4 %

Ordinary least square:

4.7 %


Temporal anomaly analyis

The variance of the temporal anomalies provides an additional measure about the stability of the signal AFTER removal of the mean seasonal cylce.

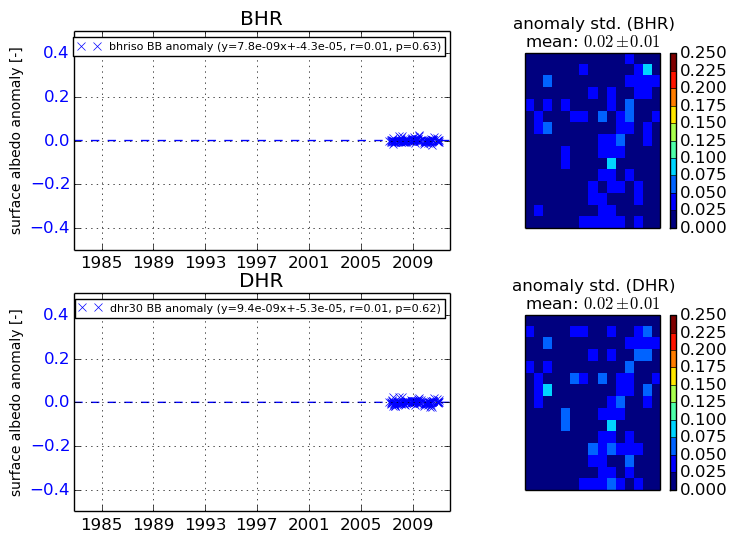
+000 deg


+057/+063 deg