BELMANIP_00293


Location

lon / lat [deg]: 143.8325 / -21.5385

Source network: BELMANIP


Geostationary surface albedo (GSA) data


“+000”


“+057/+063”


Landcover information (based on ESA CCI landcover data)


Landcover fractions @ 2km distance


Landcover fractions @ 20 km distance


Legend


Distance to open water bodies [km]:

38.84

Distance to urban areas [km]:

none in region


Radius: 1 km

Number of landcover classes:

1

Dominant landcover type:

150: Sparse vegetation (tree, shrub, herbaceous cover) (<15%)

Fraction of dominant landcover type [%]:

100.0


Radius: 2 km

Number of landcover classes:

1

Dominant landcover type:

150: Sparse vegetation (tree, shrub, herbaceous cover) (<15%)

Fraction of dominant landcover type [%]:

100.0


Radius: 5 km

Number of landcover classes:

1

Dominant landcover type:

150: Sparse vegetation (tree, shrub, herbaceous cover) (<15%)

Fraction of dominant landcover type [%]:

100.0


Radius: 10 km

Number of landcover classes:

1

Dominant landcover type:

150: Sparse vegetation (tree, shrub, herbaceous cover) (<15%)

Fraction of dominant landcover type [%]:

100.0


Radius: 20 km

Number of landcover classes:

1

Dominant landcover type:

150: Sparse vegetation (tree, shrub, herbaceous cover) (<15%)

Fraction of dominant landcover type [%]:

100.0


Disturbances


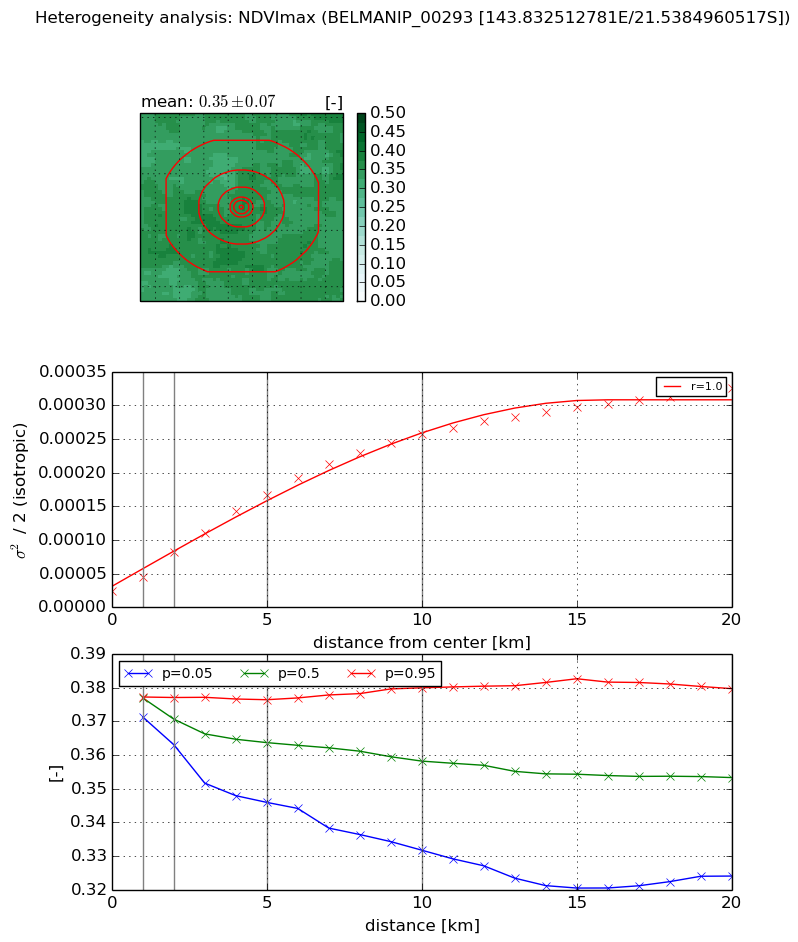
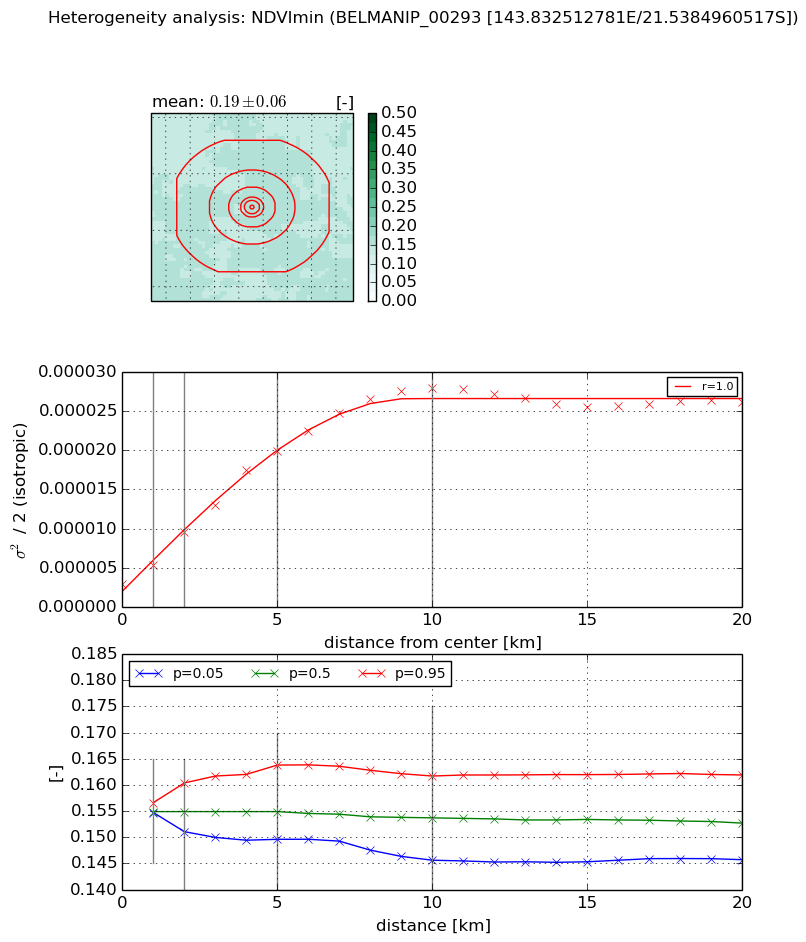
Heterogeneity analysis

The heterogeneity analysis provides information about the spatial and temporal heterogeneity of the site.

Topography


Roman et al. (2009) index


St

8.27801932825

Rcv

0.243265726508

Rse

0.0

Rst

-0.00335643714955

Rsv

-0.115783368516


Height range @ 1km [m]

5

Height range @ 2km [m]

9

Height range @ 5km [m]

14

Height range @ 10km [m]

-999

Height range @ 20km [m]

-999


Variance slope @ 1 km

4

Variance slope @ 2 km

4

Variance slope @ 5 km

4

Variance slope @ 10 km

-999

Variance slope @ 20 km

-999


NDVI (max. NDVI composite)


Roman et al. (2009) index


St

8.32605685902

Rcv

0.255541650423

Rse

0.0

Rst

-0.0551212072798

Rsv

-0.049651760705


NDVI range @ 1km [-]

0.01

NDVI range @ 2km [-]

0.01

NDVI range @ 5km [-]

0.03

NDVI range @ 10km [-]

0.05

NDVI range @ 20km [-]

0.06


Variance slope @ 1 km

2.00980101505e-05

Variance slope @ 2 km

2.89518839939e-05

Variance slope @ 5 km

2.94885993215e-05

Variance slope @ 10 km

2.41390815308e-05

Variance slope @ 20 km

1.43819863281e-05


NDVI (min. NDVI composite)I


Roman et al. (2009) index


St

7.45125860061

Rcv

0.121787740317

Rse

0.0

Rst

-0.237731081358

Rsv

0.0430977241733


NDVI range @ 1km [-]

0.0

NDVI range @ 2km [-]

0.01

NDVI range @ 5km [-]

0.01

NDVI range @ 10km [-]

0.02

NDVI range @ 20km [-]

0.02


NDVI slope @ 1 km

2.45446771452e-06

NDVI slope @ 2 km

3.33510027736e-06

NDVI slope @ 5 km

3.55753735752e-06

NDVI slope @ 10 km

2.66292380599e-06

NDVI slope @ 20 km

9.65006459699e-07


Temporal stability analysis

+000 deg (BHR)


BHR statistics

Temporal stability [1/decade]:


abs

rel


Weighted least square:

None


Ordinary least square:

None


Probabilities that GCOS criteria is met:

Weighted least square:

None %

Ordinary least square:

None %


DHR statistics

Temporal stability [1/decade]:


abs

rel


Weighted least square:

None


Ordinary least square:

None


Probabilities that GCOS criteria is met:

Weighted least square:

None %

Ordinary least square:

None %


+057/+063 deg (BHR)


BHR statistics

Temporal stability [1/decade]:


abs

rel


Weighted least square:

None


Ordinary least square:

None


Probabilities that GCOS criteria is met:

Weighted least square:

None %

Ordinary least square:

None %


DHR statistics

Temporal stability [1/decade]:


abs

rel


Weighted least square:

None


Ordinary least square:

None


Probabilities that GCOS criteria is met:

Weighted least square:

None %

Ordinary least square:

None %


Temporal anomaly analyis

The variance of the temporal anomalies provides an additional measure about the stability of the signal AFTER removal of the mean seasonal cylce.

+000 deg


+057/+063 deg